| Param | Original file | Final file |
|---|---|---|
| Filename | modeM0/AS1G07_044T09_9000001334cztM0_level2.fits | modeM0/AS1G07_044T09_9000001334cztM0_level2_quad_clean.evt |
| Size (bytes) | 699,071,040 | 696,790,080 |
| Size | 666.7 MB | 664.5 MB |
| Events in quadrant A | 4,168,144 | 4,111,205 |
| Events in quadrant B | 4,065,894 | 4,114,314 |
| Events in quadrant C | 4,174,794 | 4,008,605 |
| Events in quadrant D | 3,627,114 | 3,733,746 |
| Mode M0 | |||
|---|---|---|---|
| Quadrant | BADHDUFLAG | Total packets | Discarded packets |
| A | 0 | 172203 | 0 |
| B | 0 | 155709 | 0 |
| C | 0 | 158780 | 0 |
| D | 0 | 160095 | 0 |
| Mode M9 | |||
|---|---|---|---|
| Quadrant | BADHDUFLAG | Total packets | Discarded packets |
| A | 0 | 115 | 0 |
| B | 0 | 115 | 0 |
| C | 0 | 115 | 0 |
| D | 0 | 115 | 0 |
| Mode SS | |||
|---|---|---|---|
| Quadrant | BADHDUFLAG | Total packets | Discarded packets |
| A | 0 | 1526 | 0 |
| B | 0 | 1524 | 0 |
| C | 0 | 1524 | 0 |
| D | 0 | 1522 | 0 |
| Quadrant | Total seconds | Saturated seconds | Saturation percentage |
|---|---|---|---|
| A | 74891 | 1276 | 1.703810% |
| B | 74903 | 931 | 1.242941% |
| C | 74902 | 1011 | 1.349764% |
| D | 74882 | 974 | 1.300713% |
Noise dominated data is calculated using 1-second bins in cleaned event files. If a bin has >2000 counts, and if more than 50% of those come from <1% of pixels, then it is considered to be noise-dominated and hence unusable.
| Quadrant | # 1 sec bins | Bins with >0 counts | Bins with >2000 counts | High rate bins dominated by noise | Noise dominated (total time) | Noise dominated (detector-on time) | Marked lightcurve |
|---|---|---|---|---|---|---|---|
| A | 86390 | 74992 | 0 | 0 | 0.00% | 0.00% |  |
| B | 86389 | 74987 | 0 | 0 | 0.00% | 0.00% |  |
| C | 86390 | 74987 | 0 | 0 | 0.00% | 0.00% |  |
| D | 86390 | 74980 | 0 | 0 | 0.00% | 0.00% |  |
Top three noisy pixels from each quadrant. If the there are fewer than three noisy pixels in the level2.evt file, extra rows are filled as -1
| Pixel properties | Quadrant properties | ||||||
|---|---|---|---|---|---|---|---|
| Quadrant | DetID | PixID | Counts | Sigma | Mean | Median | Sigma |
| A | 0 | 29 | 4114 | 11.39 | 1084 | 1013 | 272.2 |
| A | 7 | 110 | 3362 | 8.63 | 1084 | 1013 | 272.2 |
| A | 0 | 30 | 3161 | 7.89 | 1084 | 1013 | 272.2 |
| B | 2 | 9 | 3593 | 12.09 | 1071 | 1015 | 213.2 |
| B | 12 | 226 | 2691 | 7.86 | 1071 | 1015 | 213.2 |
| B | 3 | 17 | 2676 | 7.79 | 1071 | 1015 | 213.2 |
| C | 12 | 241 | 2897 | 6.45 | 1103 | 1023 | 290.4 |
| C | 2 | 191 | 2791 | 6.09 | 1103 | 1023 | 290.4 |
| C | 9 | 188 | 2780 | 6.05 | 1103 | 1023 | 290.4 |
| D | 6 | 231 | 2810 | 6.87 | 1031 | 937 | 272.6 |
| D | 7 | 5 | 2650 | 6.28 | 1031 | 937 | 272.6 |
| D | 7 | 3 | 2548 | 5.91 | 1031 | 937 | 272.6 |
Histogram calculated using DETX and DETY for each event in the final _common_clean file
| Quadrant A |  |
 |
Quadrant B |
|---|---|---|---|
| Quadrant D |  |
 |
Quadrant C |
| Plot type | Count rate plots | Images |
|---|---|---|
| Comparison with Poisson distribution Blue bars denote a histogram of data divided into 1 sec bins. Red curve is a Poisson curve with rate = median count rate of data. |
 |
 |
| Quadrant-wise count rates Data is divided into 100 sec bins |
 |
|
| Module-wise count rates for Quadrant A Data is divided into 100 sec bins |
 |
 |
| Module-wise count rates for Quadrant B Data is divided into 100 sec bins |
 |
 |
| Module-wise count rates for Quadrant C Data is divided into 100 sec bins |
 |
 |
| Module-wise count rates for Quadrant D Data is divided into 100 sec bins |
 |
 |
| Parameter | Plot |
|---|---|
| CZT HV Monitor |  |
| D_VDD | 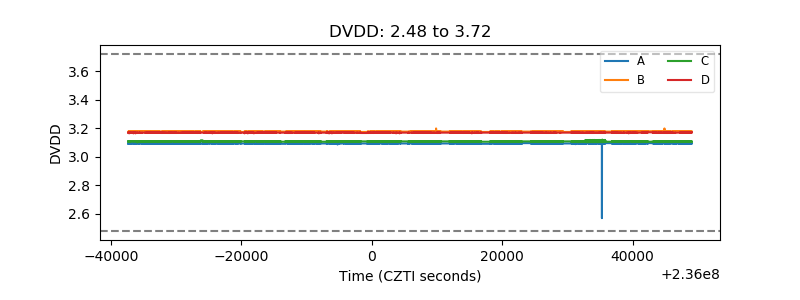 |
| Temperature 1 |  |
| Veto HV Monitor |  |
| Veto LLD | 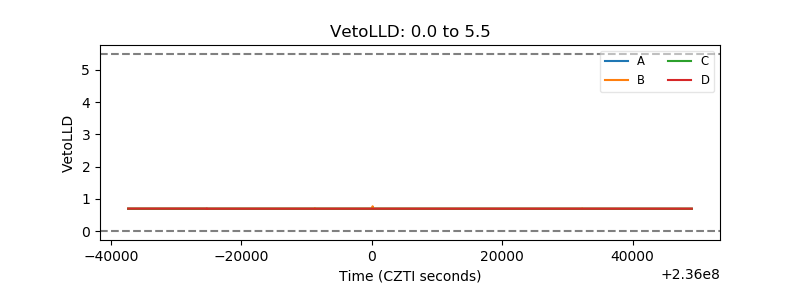 |
| Alpha Counter |  |
| _CPM_Rate |  |
| CZT Counter |  |
| +2.5 Volts monitor |  |
| +5 Volts monitor |  |
| _ROLL_ROT |  |
| _Roll_DEC |  |
| _Roll_RA |  |
| Veto Counter |  |