| Param | Original file | Final file |
|---|---|---|
| Filename | modeM0/AS1G07_044T09_9000001334_09398cztM0_level2.evt | modeM0/AS1G07_044T09_9000001334_09398cztM0_level2_quad_clean.evt |
| Size (bytes) | 417,507,840 | 80,694,720 |
| Size | 398.2 MB | 77.0 MB |
| Events in quadrant A | 3,208,459 | 496,619 |
| Events in quadrant B | 2,974,537 | 504,103 |
| Events in quadrant C | 2,858,971 | 509,143 |
| Events in quadrant D | 3,164,322 | 484,757 |
| Mode M0 | |||
|---|---|---|---|
| Quadrant | BADHDUFLAG | Total packets | Discarded packets |
| A | 0 | 13834 | 39 |
| B | 0 | 13365 | 29 |
| C | 0 | 13214 | 44 |
| D | 0 | 14208 | 67 |
| Mode M9 | |||
|---|---|---|---|
| Quadrant | BADHDUFLAG | Total packets | Discarded packets |
| A | 0 | 2 | 0 |
| B | 0 | 2 | 0 |
| C | 0 | 2 | 0 |
| D | 0 | 2 | 0 |
| Mode SS | |||
|---|---|---|---|
| Quadrant | BADHDUFLAG | Total packets | Discarded packets |
| A | 0 | 130 | 0 |
| B | 0 | 130 | 0 |
| C | 0 | 130 | 0 |
| D | 0 | 130 | 0 |
| Quadrant | Total seconds | Saturated seconds | Saturation percentage |
|---|---|---|---|
| A | 6437 | 132 | 2.050645% |
| B | 6439 | 139 | 2.158720% |
| C | 6433 | 63 | 0.979325% |
| D | 6430 | 161 | 2.503888% |
Noise dominated data is calculated using 1-second bins in cleaned event files. If a bin has >2000 counts, and if more than 50% of those come from <1% of pixels, then it is considered to be noise-dominated and hence unusable.
| Quadrant | # 1 sec bins | Bins with >0 counts | Bins with >2000 counts | High rate bins dominated by noise | Noise dominated (total time) | Noise dominated (detector-on time) | Marked lightcurve |
|---|---|---|---|---|---|---|---|
| A | 6606 | 6452 | 3 | 3 | 0.05% | 0.05% |  |
| B | 6606 | 6452 | 1 | 1 | 0.02% | 0.02% | 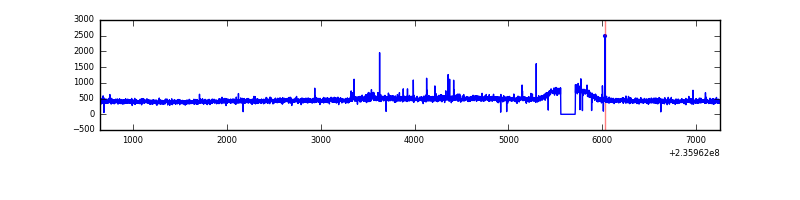 |
| C | 6606 | 6450 | 0 | 0 | 0.00% | 0.00% | 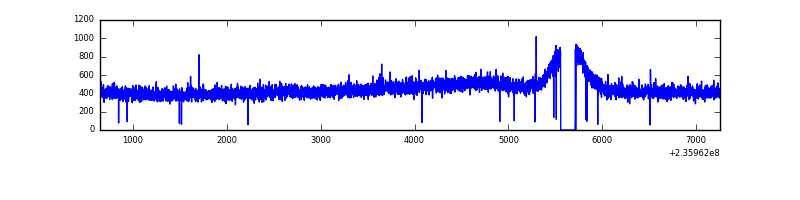 |
| D | 6606 | 6452 | 39 | 39 | 0.59% | 0.60% | 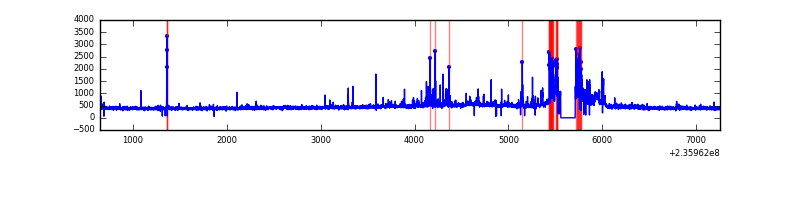 |
Top three noisy pixels from each quadrant. If the there are fewer than three noisy pixels in the level2.evt file, extra rows are filled as -1
| Pixel properties | Quadrant properties | ||||||
|---|---|---|---|---|---|---|---|
| Quadrant | DetID | PixID | Counts | Sigma | Mean | Median | Sigma |
| A | 8 | 5 | 281344 | 1819.82 | 744 | 727 | 154.2 |
| A | 14 | 111 | 19134 | 119.37 | 744 | 727 | 154.2 |
| A | 12 | 236 | 15743 | 97.38 | 744 | 727 | 154.2 |
| B | 0 | 214 | 29040 | 196.45 | 747 | 727 | 144.1 |
| B | 0 | 187 | 22227 | 149.17 | 747 | 727 | 144.1 |
| B | 12 | 111 | 16338 | 108.31 | 747 | 727 | 144.1 |
| C | 13 | 61 | 5639 | 28.91 | 732 | 733 | 169.7 |
| C | 14 | 234 | 2353 | 9.54 | 732 | 733 | 169.7 |
| C | 3 | 202 | 1737 | 5.92 | 732 | 733 | 169.7 |
| D | 1 | 52 | 221218 | 1263.78 | 716 | 697 | 174.5 |
| D | 8 | 195 | 60924 | 345.15 | 716 | 697 | 174.5 |
| D | 9 | 64 | 47444 | 267.9 | 716 | 697 | 174.5 |
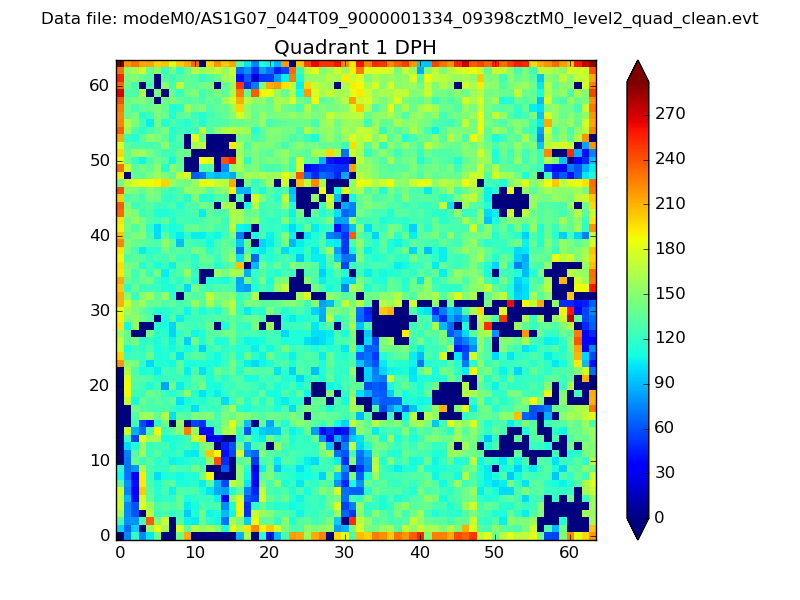
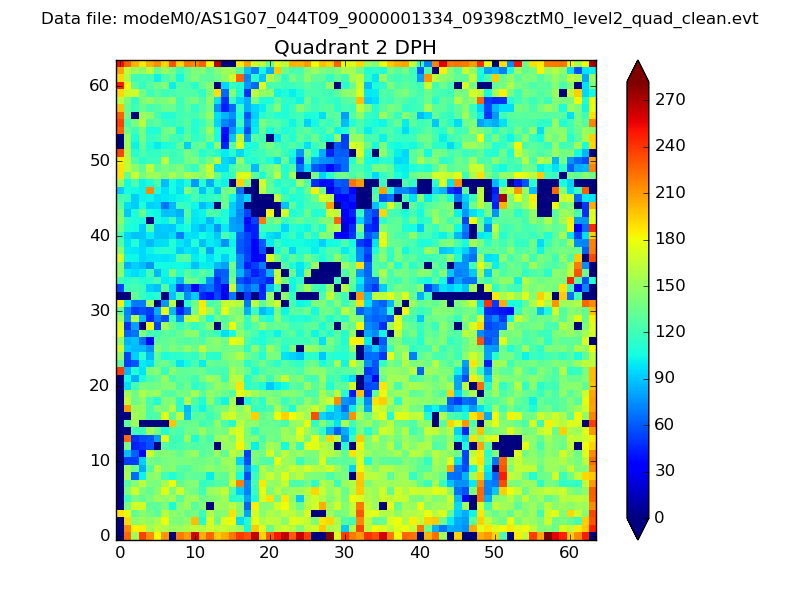
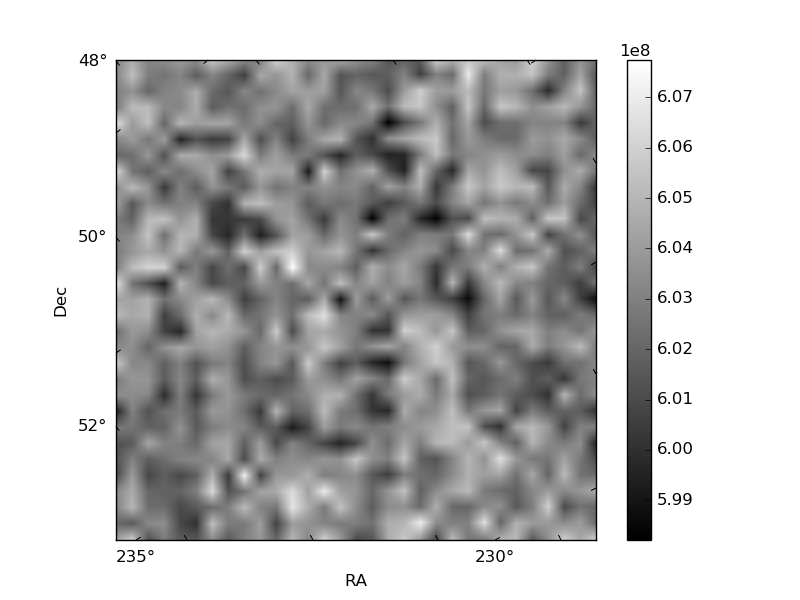
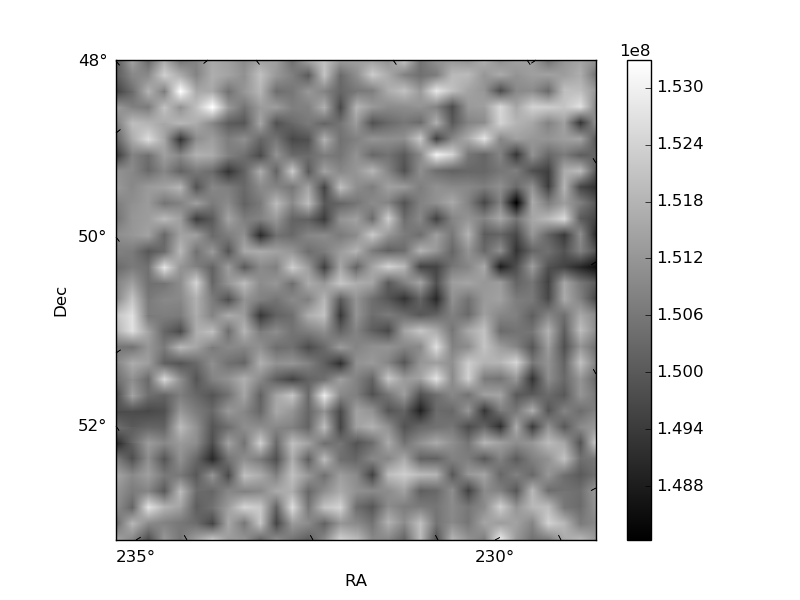
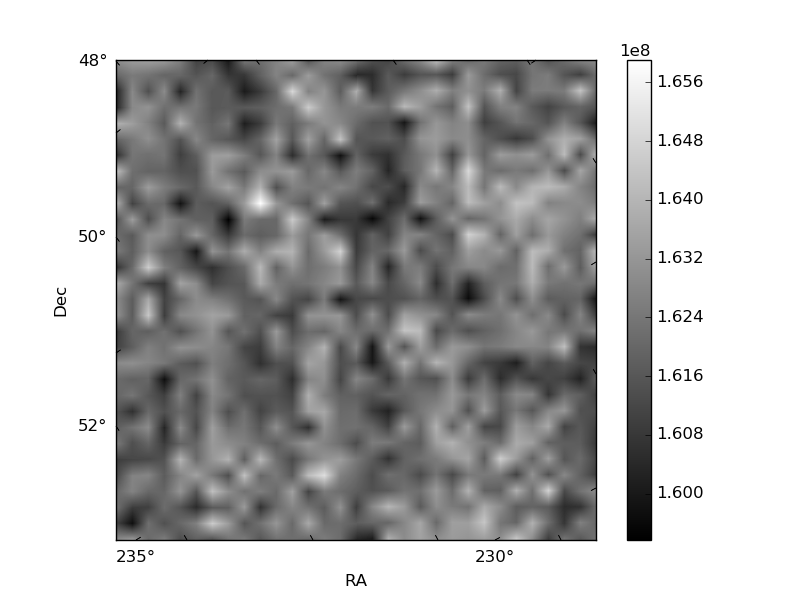
Histogram calculated using DETX and DETY for each event in the final _common_clean file
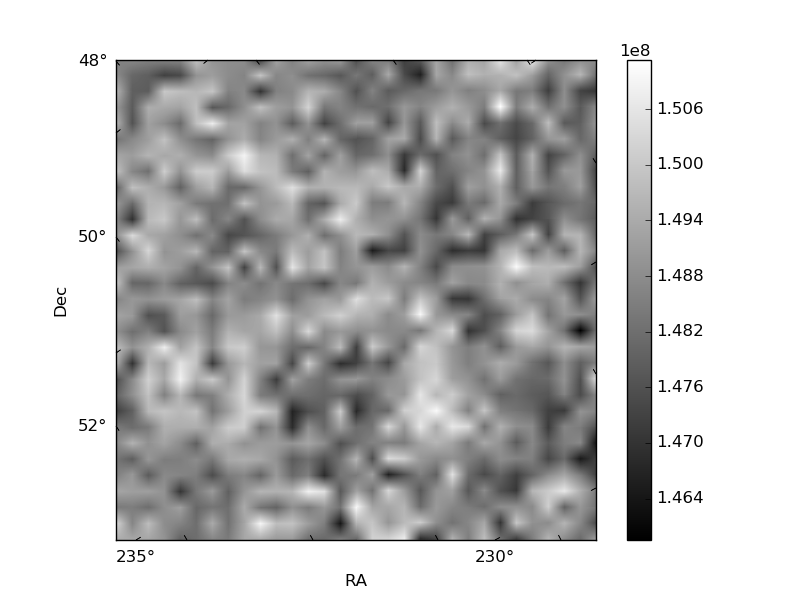
| Quadrant A | 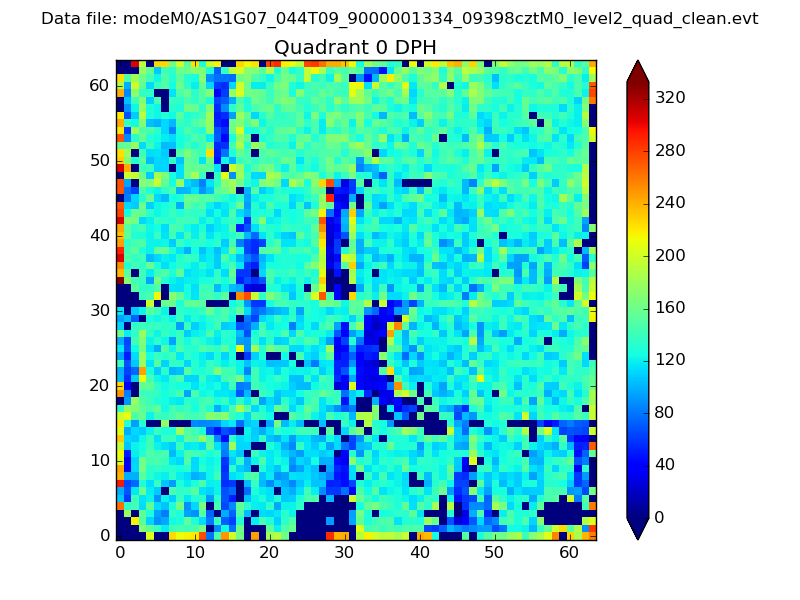 |
 |
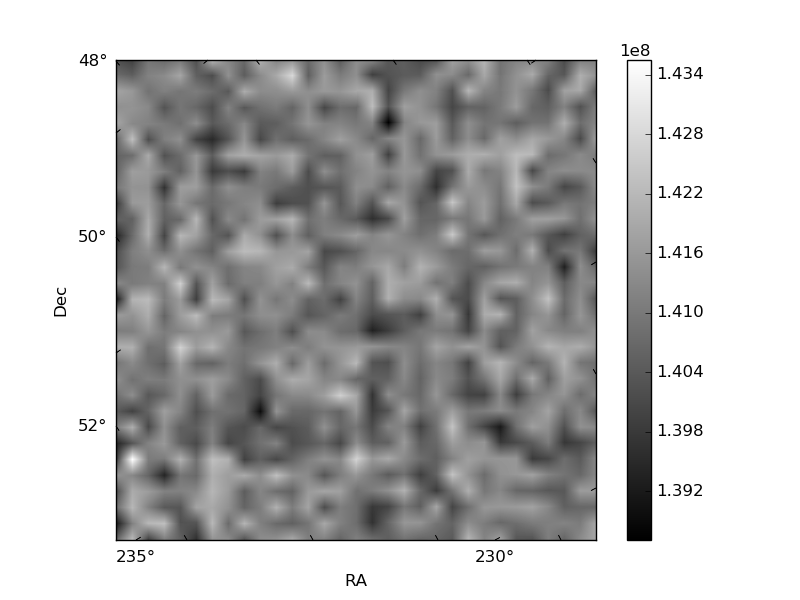
Quadrant B |
|---|---|---|---|
| Quadrant D | 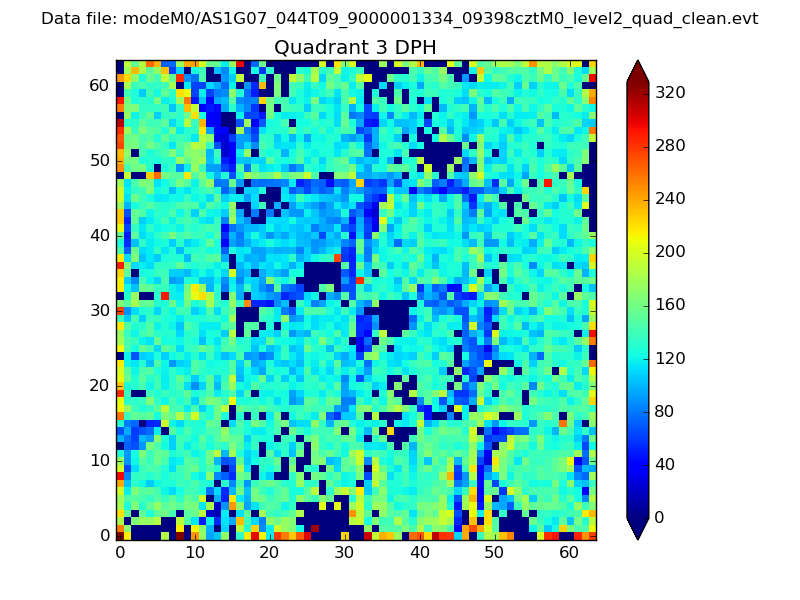 |
 |
Quadrant C |
| Plot type | Count rate plots | Images |
|---|---|---|
| Comparison with Poisson distribution Blue bars denote a histogram of data divided into 1 sec bins. Red curve is a Poisson curve with rate = median count rate of data. |
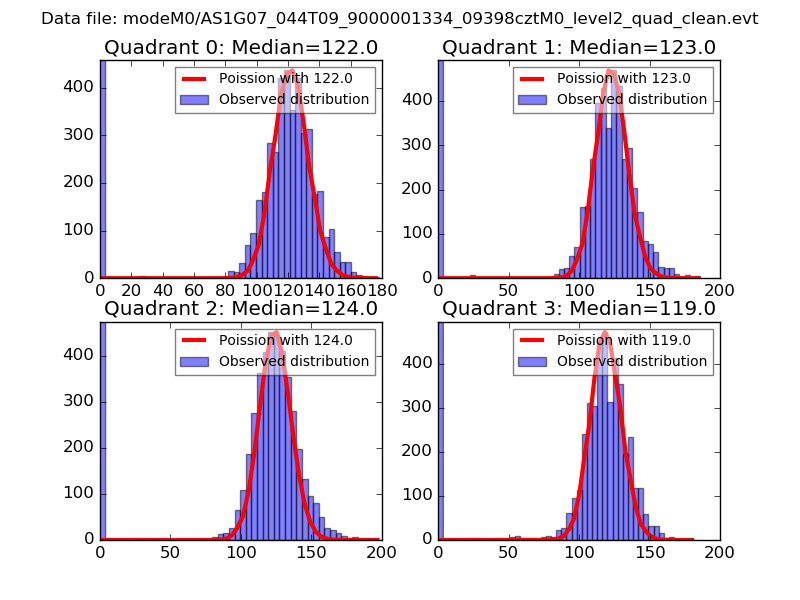 |
 |
| Quadrant-wise count rates Data is divided into 100 sec bins |
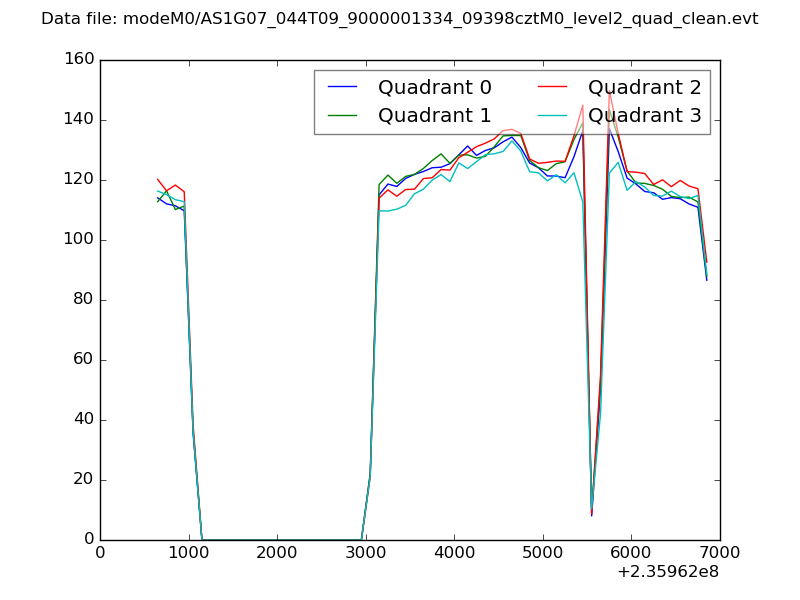 |
|
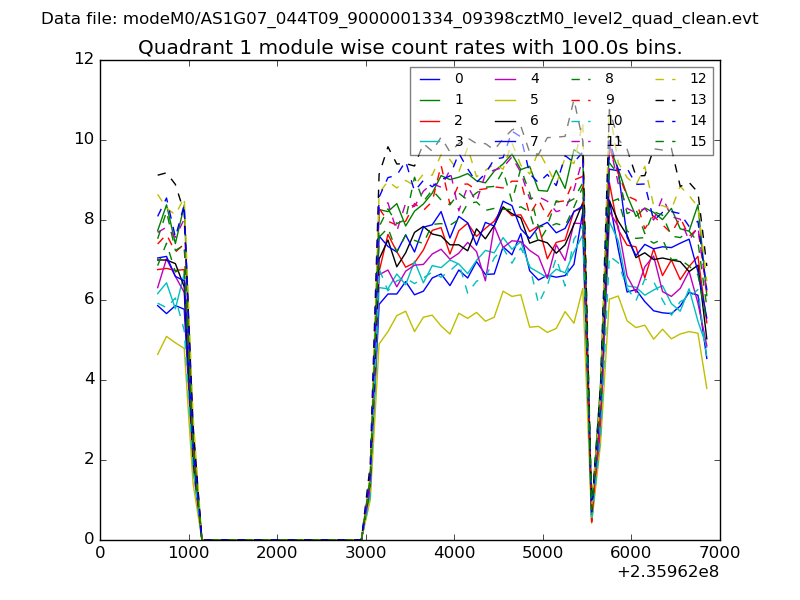
| Module-wise count rates for Quadrant A Data is divided into 100 sec bins |
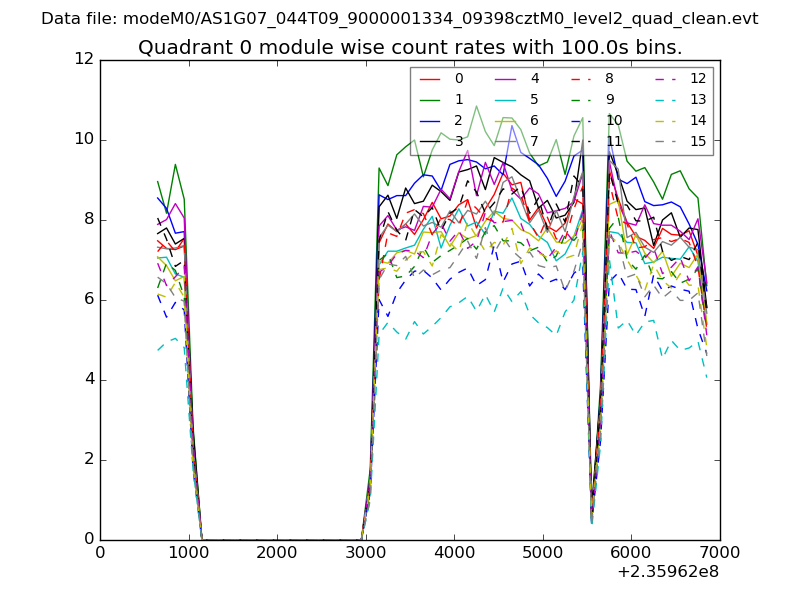 |
 |
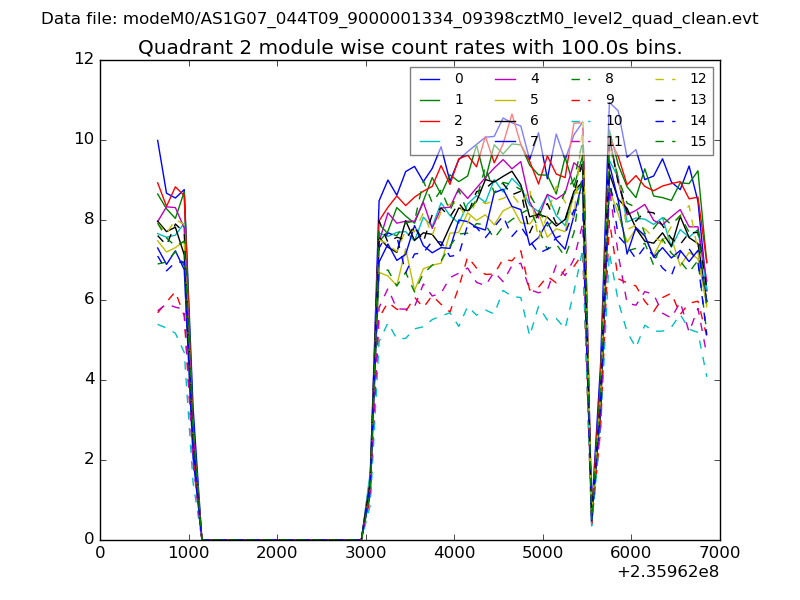
| Module-wise count rates for Quadrant B Data is divided into 100 sec bins |
 |
 |
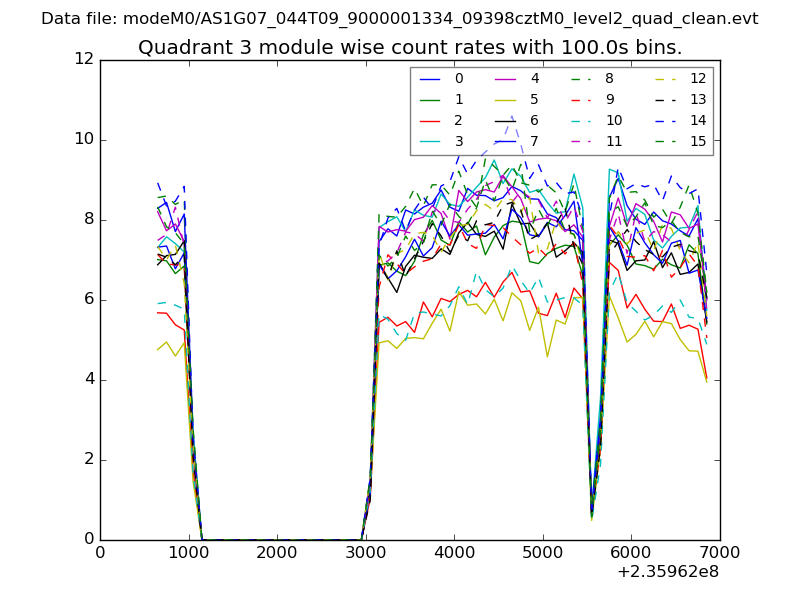
| Module-wise count rates for Quadrant C Data is divided into 100 sec bins |
 |
 |
| Module-wise count rates for Quadrant D Data is divided into 100 sec bins |
 |
 |
| Parameter | Plot |
|---|---|
| CZT HV Monitor | 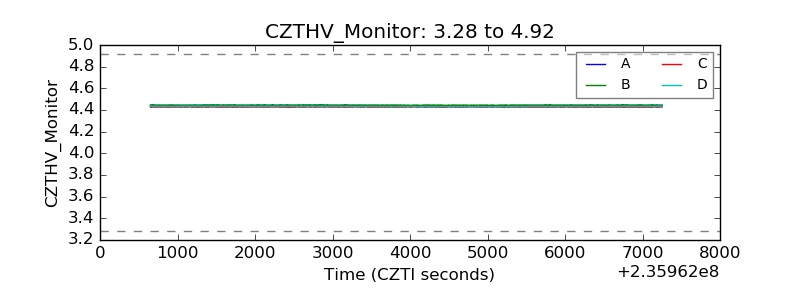 |
| D_VDD | 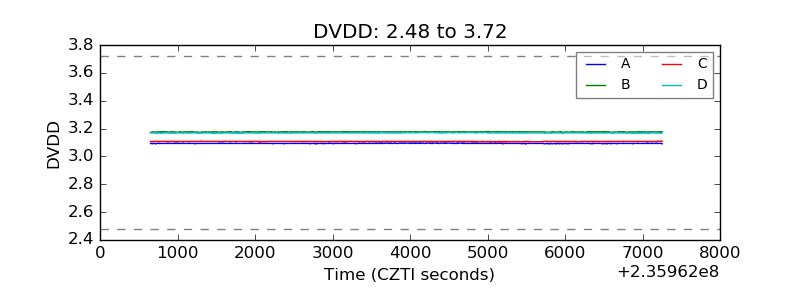 |
| Temperature 1 | 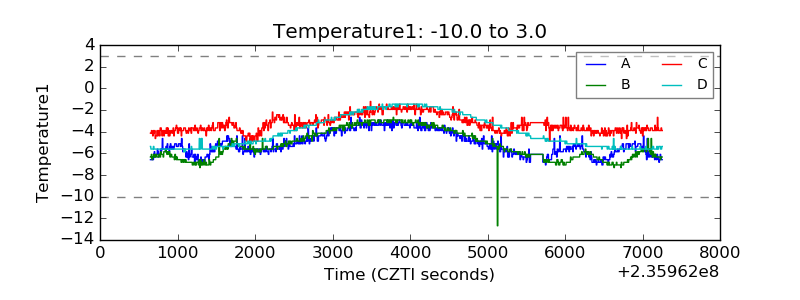 |
| Veto HV Monitor | 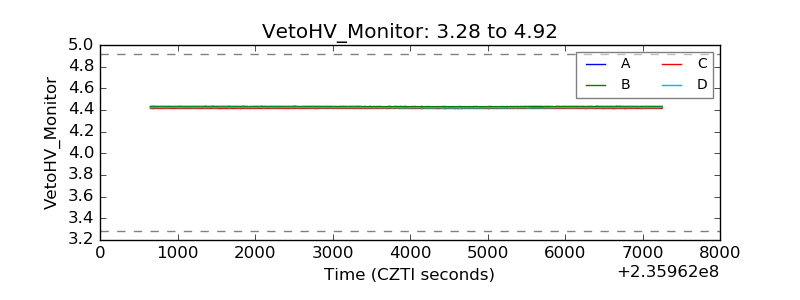 |
| Veto LLD |  |
| Alpha Counter | 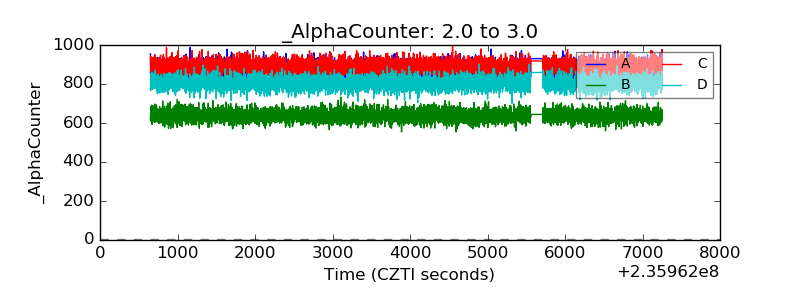 |
| _CPM_Rate | 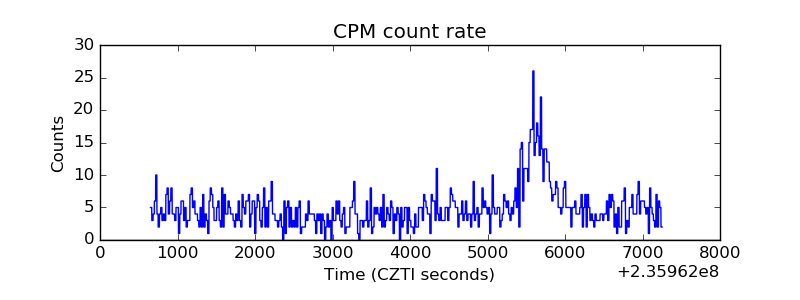 |
| CZT Counter | 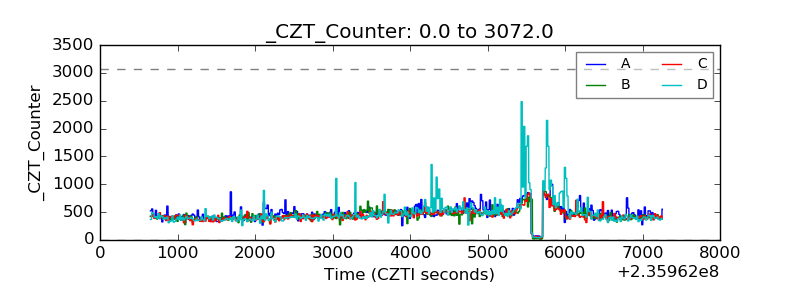 |
| +2.5 Volts monitor |  |
| +5 Volts monitor |  |
| _ROLL_ROT | 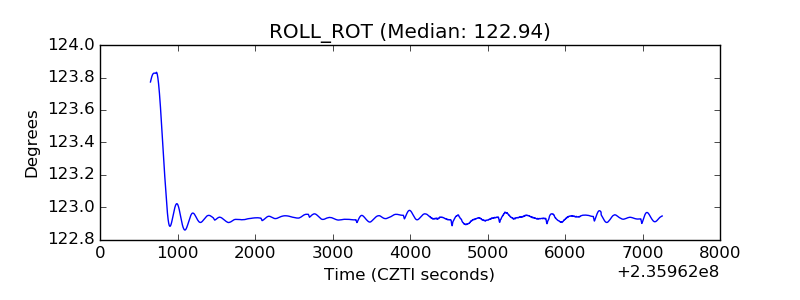 |
| _Roll_DEC | 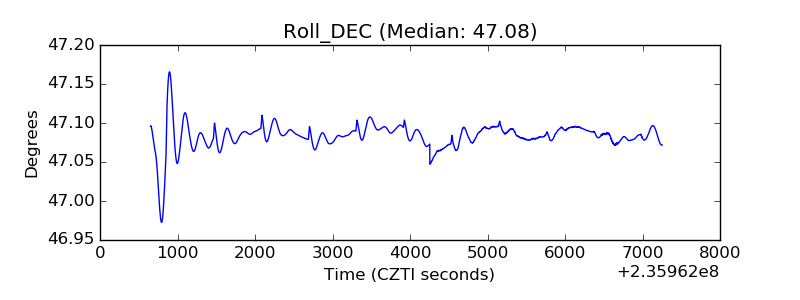 |
| _Roll_RA | 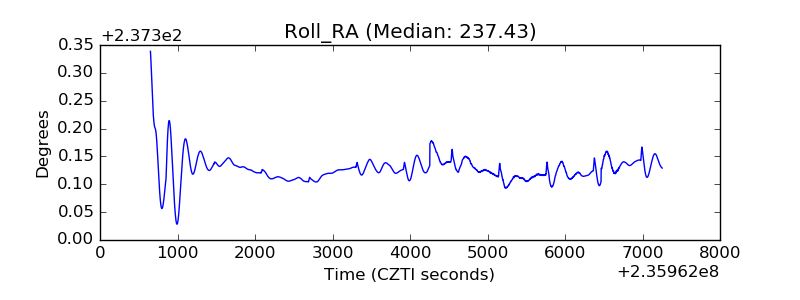 |
| Veto Counter | 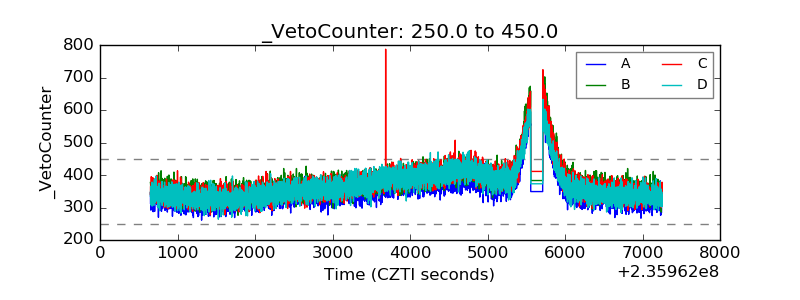 |