| Param | Original file | Final file |
|---|---|---|
| Filename | modeM0/AS1G07_044T09_9000001334_09402cztM0_level2.evt | modeM0/AS1G07_044T09_9000001334_09402cztM0_level2_quad_clean.evt |
| Size (bytes) | 1,332,123,840 | 237,856,320 |
| Size | 1.2 GB | 226.8 MB |
| Events in quadrant A | 10,616,708 | 1,466,152 |
| Events in quadrant B | 9,106,758 | 1,483,311 |
| Events in quadrant C | 9,766,807 | 1,484,611 |
| Events in quadrant D | 9,549,196 | 1,441,271 |
| Mode M0 | |||
|---|---|---|---|
| Quadrant | BADHDUFLAG | Total packets | Discarded packets |
| A | 0 | 43909 | 320 |
| B | 0 | 39949 | 280 |
| C | 0 | 42724 | 261 |
| D | 0 | 42364 | 298 |
| Mode M9 | |||
|---|---|---|---|
| Quadrant | BADHDUFLAG | Total packets | Discarded packets |
| A | 0 | 24 | 0 |
| B | 0 | 24 | 0 |
| C | 0 | 24 | 0 |
| D | 0 | 24 | 0 |
| Mode SS | |||
|---|---|---|---|
| Quadrant | BADHDUFLAG | Total packets | Discarded packets |
| A | 0 | 396 | 2 |
| B | 0 | 396 | 4 |
| C | 0 | 396 | 4 |
| D | 0 | 396 | 6 |
| Quadrant | Total seconds | Saturated seconds | Saturation percentage |
|---|---|---|---|
| A | 19285 | 407 | 2.110449% |
| B | 19288 | 348 | 1.804231% |
| C | 19296 | 472 | 2.446103% |
| D | 19279 | 397 | 2.059235% |
Noise dominated data is calculated using 1-second bins in cleaned event files. If a bin has >2000 counts, and if more than 50% of those come from <1% of pixels, then it is considered to be noise-dominated and hence unusable.
| Quadrant | # 1 sec bins | Bins with >0 counts | Bins with >2000 counts | High rate bins dominated by noise | Noise dominated (total time) | Noise dominated (detector-on time) | Marked lightcurve |
|---|---|---|---|---|---|---|---|
| A | 21781 | 19374 | 29 | 29 | 0.13% | 0.15% | 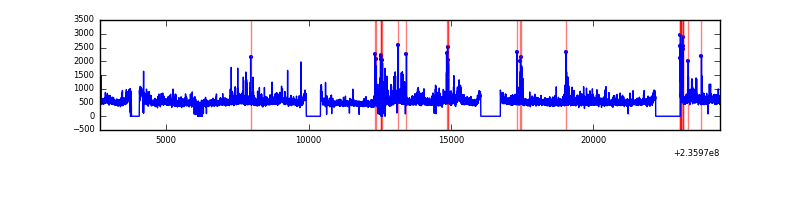 |
| B | 21781 | 19368 | 4 | 4 | 0.02% | 0.02% | 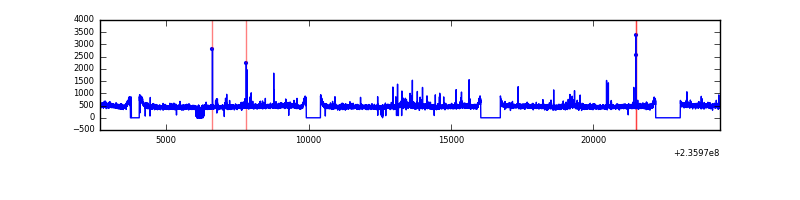 |
| C | 21781 | 19375 | 127 | 127 | 0.58% | 0.66% | 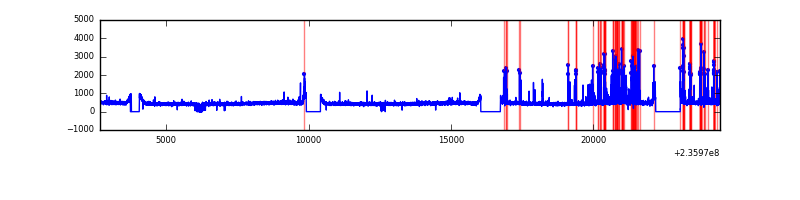 |
| D | 21781 | 19365 | 129 | 129 | 0.59% | 0.67% | 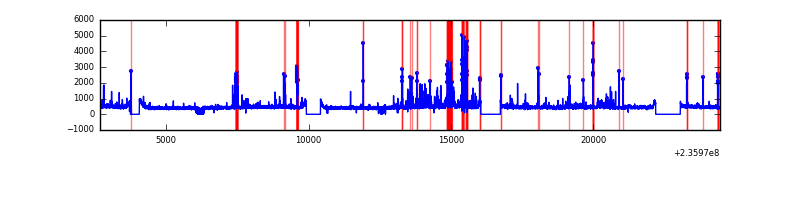 |
Top three noisy pixels from each quadrant. If the there are fewer than three noisy pixels in the level2.evt file, extra rows are filled as -1
| Pixel properties | Quadrant properties | ||||||
|---|---|---|---|---|---|---|---|
| Quadrant | DetID | PixID | Counts | Sigma | Mean | Median | Sigma |
| A | 8 | 5 | 1554621 | 3371.07 | 2257 | 2205 | 460.5 |
| A | 13 | 251 | 163690 | 350.66 | 2257 | 2205 | 460.5 |
| A | 1 | 162 | 69884 | 146.96 | 2257 | 2205 | 460.5 |
| B | 0 | 219 | 110278 | 249.99 | 2268 | 2207 | 432.3 |
| B | 0 | 214 | 100119 | 226.49 | 2268 | 2207 | 432.3 |
| B | 12 | 111 | 49645 | 109.73 | 2268 | 2207 | 432.3 |
| C | 4 | 254 | 1136785 | 2230.89 | 2208 | 2216 | 508.6 |
| C | 13 | 61 | 16472 | 28.03 | 2208 | 2216 | 508.6 |
| C | 14 | 234 | 9451 | 14.23 | 2208 | 2216 | 508.6 |
| D | 1 | 52 | 484720 | 918.0 | 2190 | 2139 | 525.7 |
| D | 7 | 71 | 305688 | 577.43 | 2190 | 2139 | 525.7 |
| D | 8 | 195 | 142158 | 266.35 | 2190 | 2139 | 525.7 |
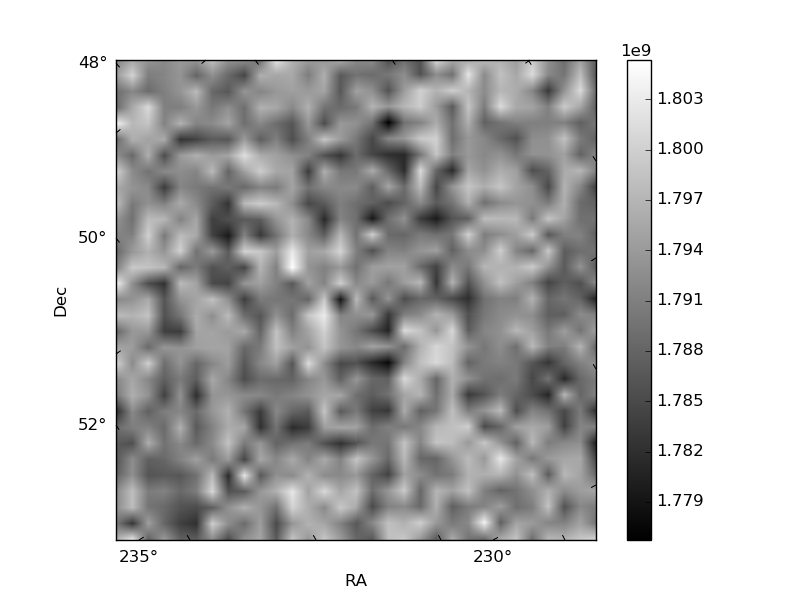
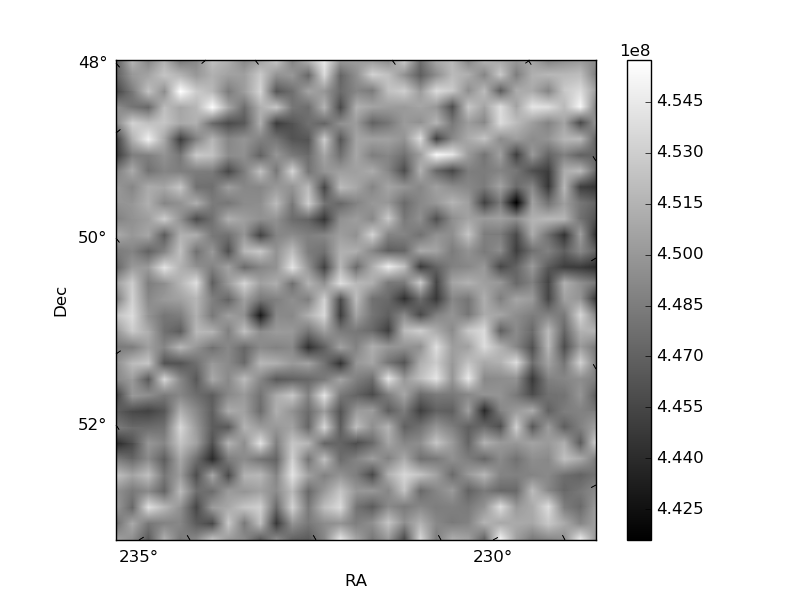
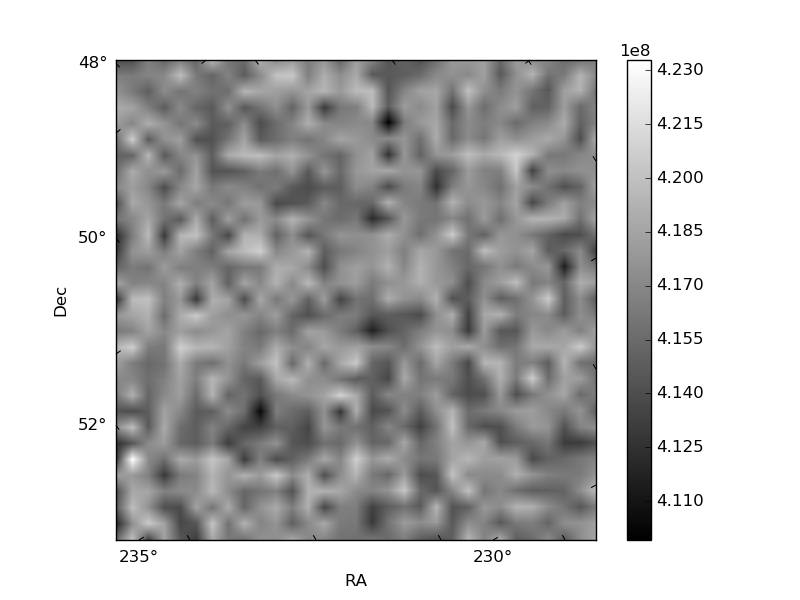
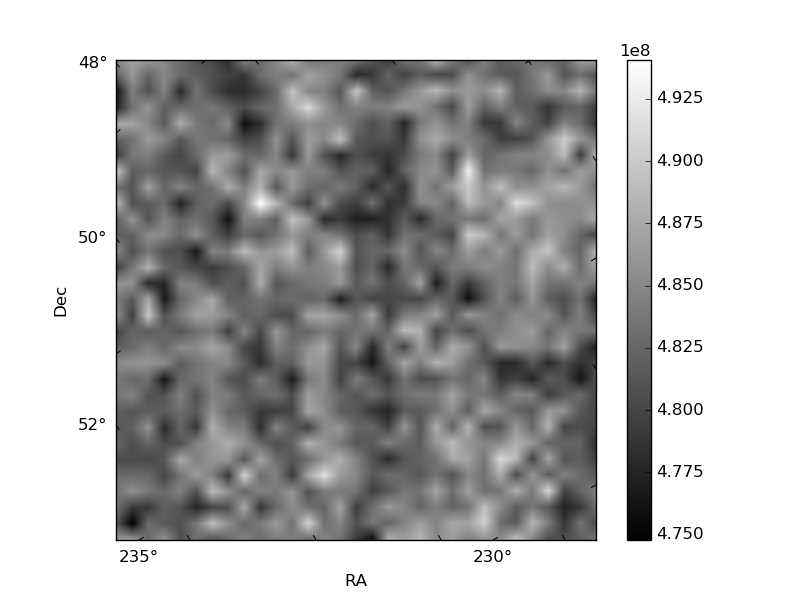
Histogram calculated using DETX and DETY for each event in the final _common_clean file
| Quadrant A |  |
 |
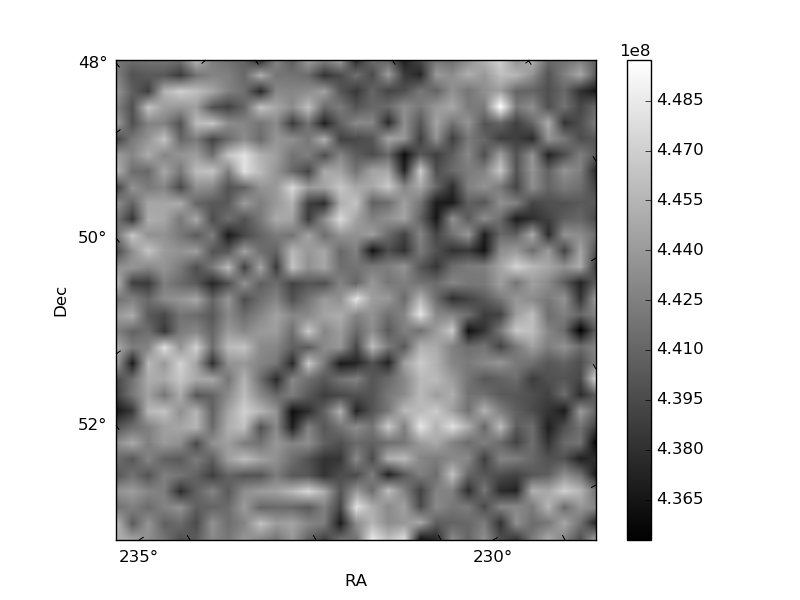
Quadrant B |
|---|---|---|---|
| Quadrant D |  |
 |
Quadrant C |
| Plot type | Count rate plots | Images |
|---|---|---|
| Comparison with Poisson distribution Blue bars denote a histogram of data divided into 1 sec bins. Red curve is a Poisson curve with rate = median count rate of data. |
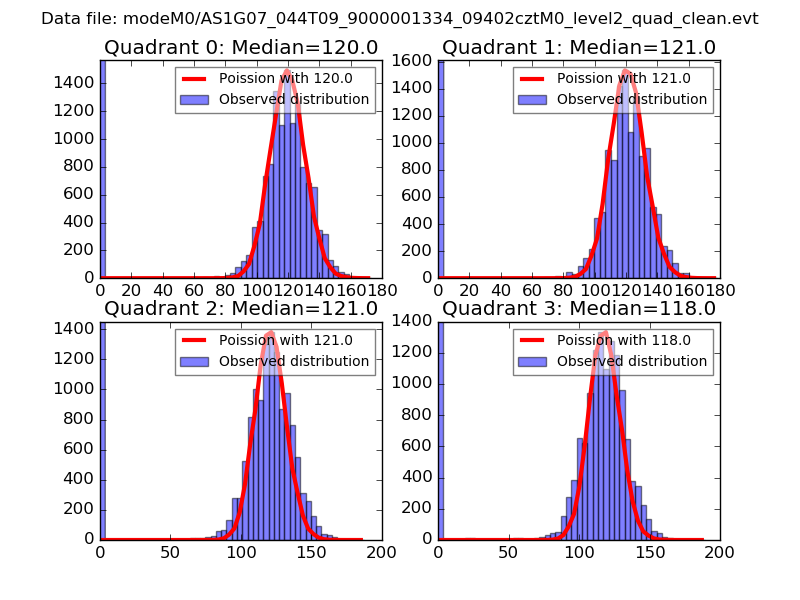 |
 |
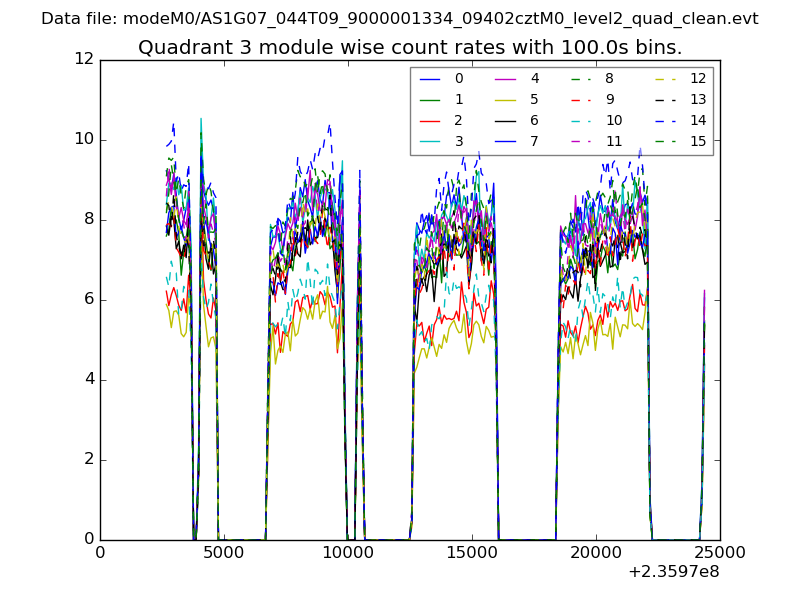
| Quadrant-wise count rates Data is divided into 100 sec bins |
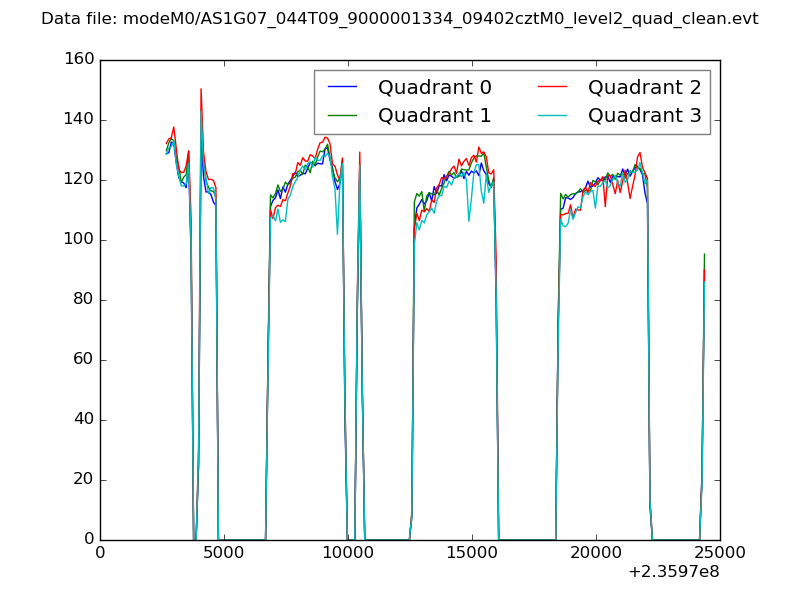 |
|
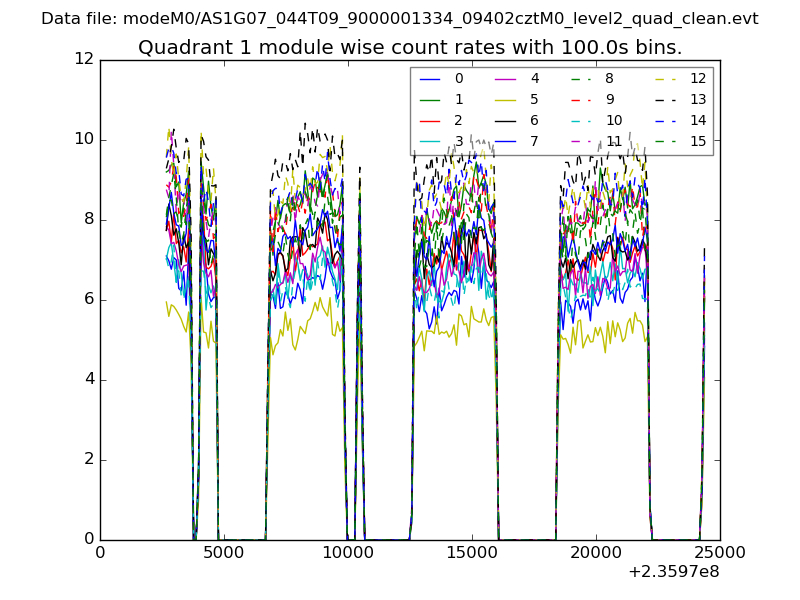
| Module-wise count rates for Quadrant A Data is divided into 100 sec bins |
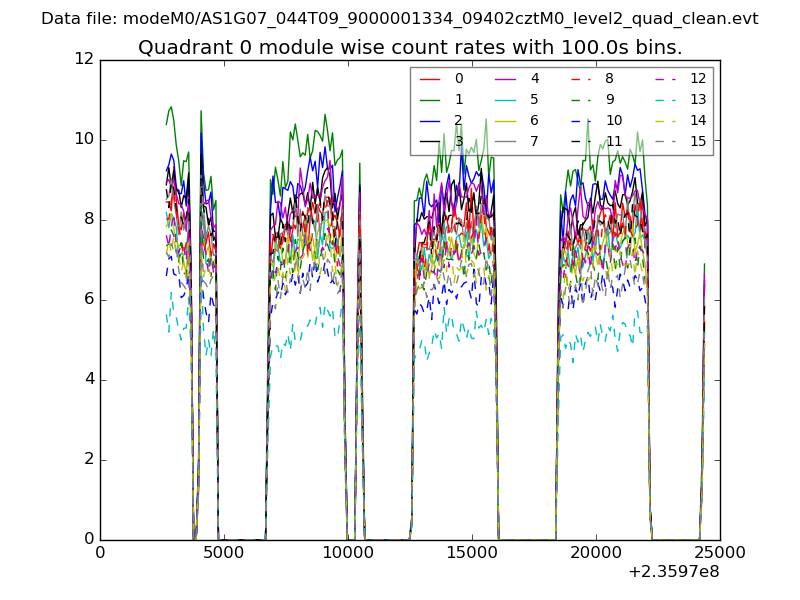 |
 |
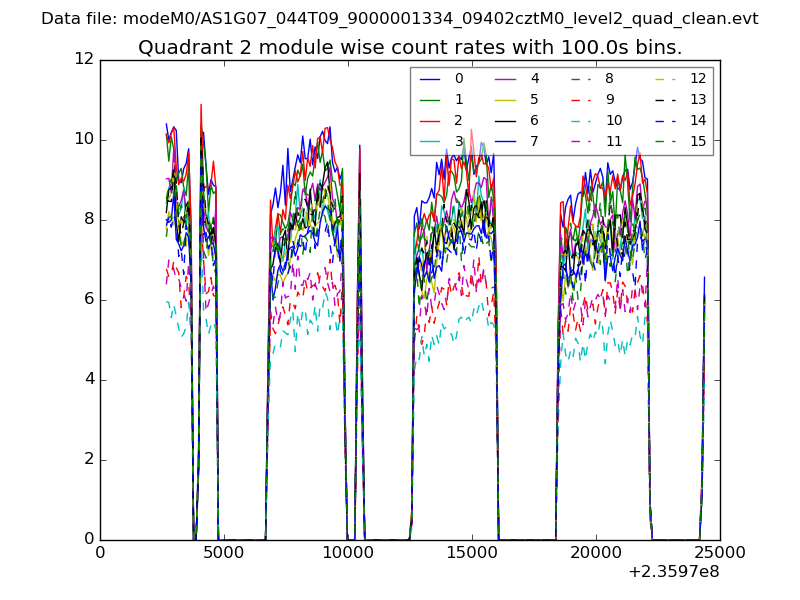
| Module-wise count rates for Quadrant B Data is divided into 100 sec bins |
 |
 |
| Module-wise count rates for Quadrant C Data is divided into 100 sec bins |
 |
 |
| Module-wise count rates for Quadrant D Data is divided into 100 sec bins |
 |
 |
| Parameter | Plot |
|---|---|
| CZT HV Monitor | 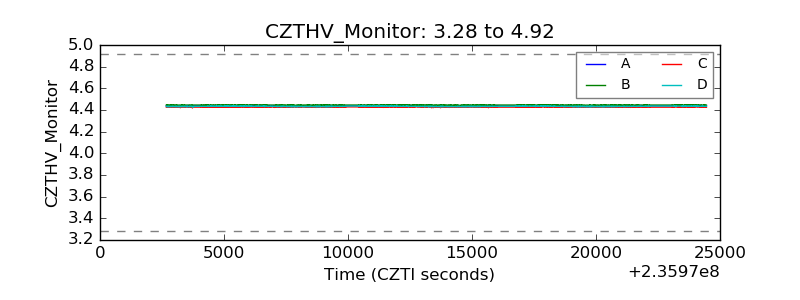 |
| D_VDD | 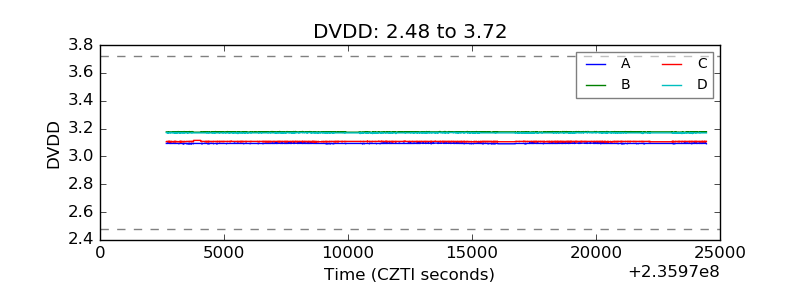 |
| Temperature 1 | 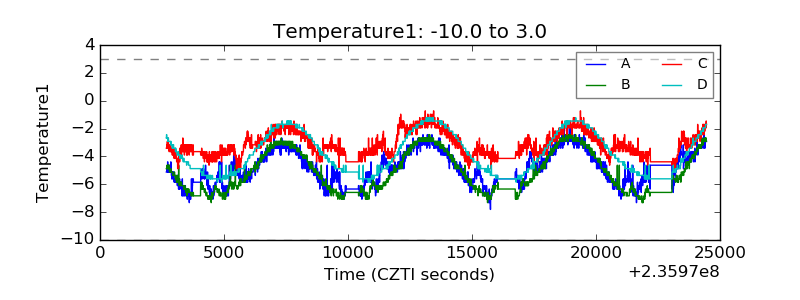 |
| Veto HV Monitor | 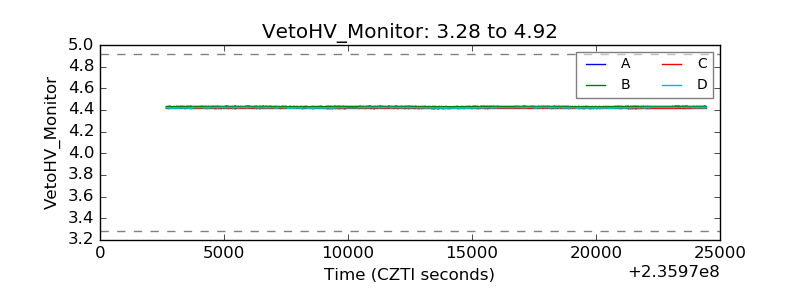 |
| Veto LLD | 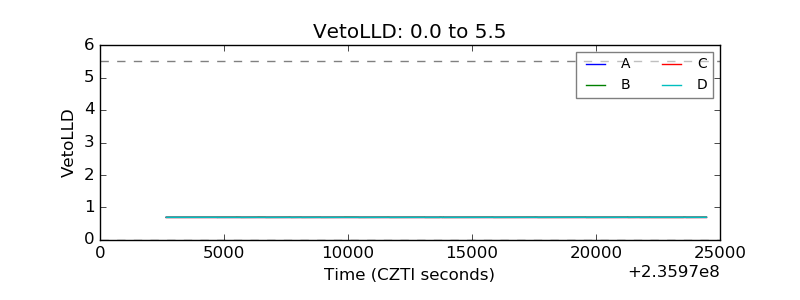 |
| Alpha Counter | 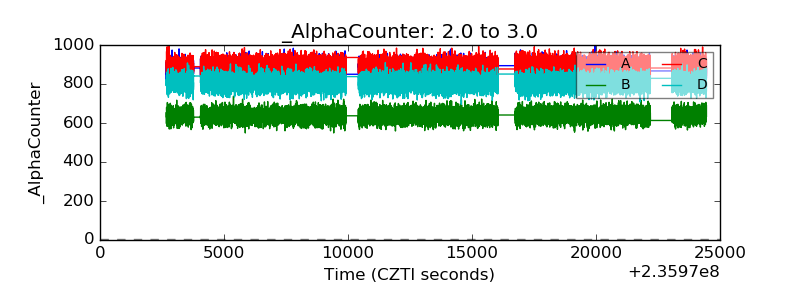 |
| _CPM_Rate | 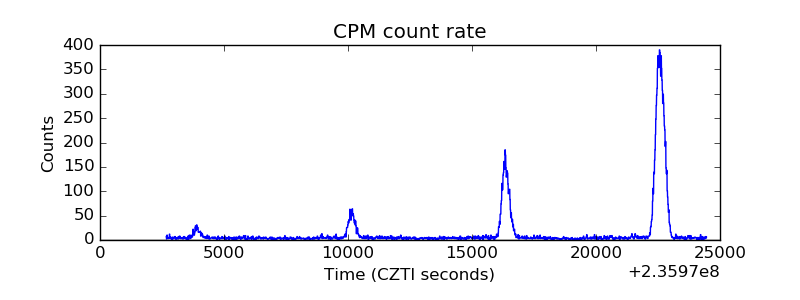 |
| CZT Counter |  |
| +2.5 Volts monitor |  |
| +5 Volts monitor |  |
| _ROLL_ROT | 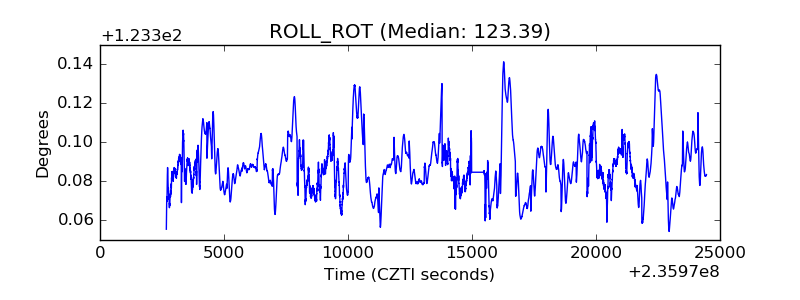 |
| _Roll_DEC | 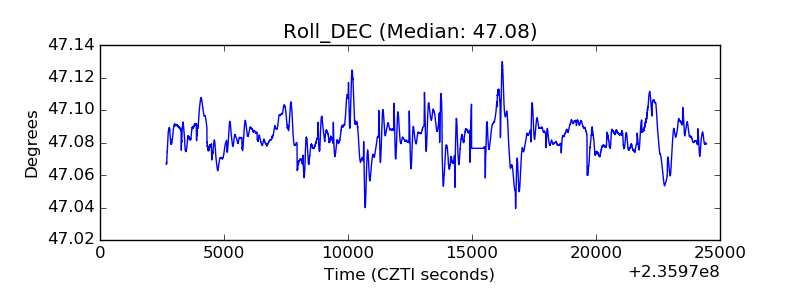 |
| _Roll_RA | 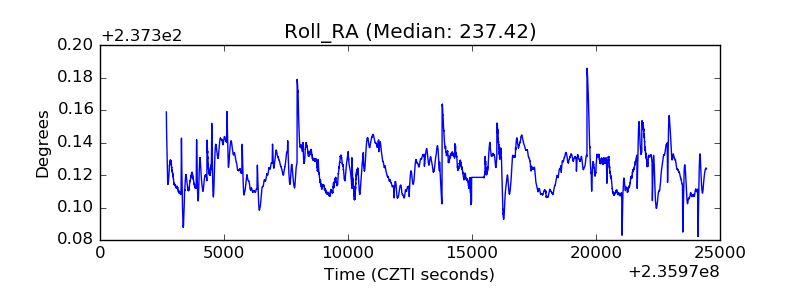 |
| Veto Counter | 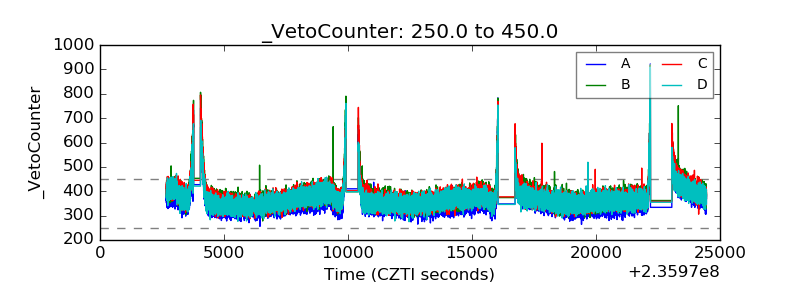 |