| Param | Original file | Final file |
|---|---|---|
| Filename | modeM0/AS1G07_044T09_9000001334_09403cztM0_level2.evt | modeM0/AS1G07_044T09_9000001334_09403cztM0_level2_quad_clean.evt |
| Size (bytes) | 468,679,680 | 83,496,960 |
| Size | 447.0 MB | 79.6 MB |
| Events in quadrant A | 3,708,399 | 518,389 |
| Events in quadrant B | 3,228,523 | 522,243 |
| Events in quadrant C | 3,503,031 | 516,376 |
| Events in quadrant D | 3,300,448 | 506,047 |
| Mode M0 | |||
|---|---|---|---|
| Quadrant | BADHDUFLAG | Total packets | Discarded packets |
| A | 0 | 15203 | 8 |
| B | 0 | 13805 | 2 |
| C | 0 | 14898 | 2 |
| D | 0 | 14260 | 4 |
| Mode M9 | |||
|---|---|---|---|
| Quadrant | BADHDUFLAG | Total packets | Discarded packets |
| A | 0 | 17 | 0 |
| B | 0 | 17 | 0 |
| C | 0 | 17 | 0 |
| D | 0 | 18 | 0 |
| Mode SS | |||
|---|---|---|---|
| Quadrant | BADHDUFLAG | Total packets | Discarded packets |
| A | 0 | 136 | 0 |
| B | 0 | 136 | 0 |
| C | 0 | 136 | 0 |
| D | 0 | 136 | 0 |
| Quadrant | Total seconds | Saturated seconds | Saturation percentage |
|---|---|---|---|
| A | 6673 | 121 | 1.813277% |
| B | 6675 | 84 | 1.258427% |
| C | 6675 | 172 | 2.576779% |
| D | 6674 | 102 | 1.528319% |
Noise dominated data is calculated using 1-second bins in cleaned event files. If a bin has >2000 counts, and if more than 50% of those come from <1% of pixels, then it is considered to be noise-dominated and hence unusable.
| Quadrant | # 1 sec bins | Bins with >0 counts | Bins with >2000 counts | High rate bins dominated by noise | Noise dominated (total time) | Noise dominated (detector-on time) | Marked lightcurve |
|---|---|---|---|---|---|---|---|
| A | 7645 | 6676 | 14 | 14 | 0.18% | 0.21% | 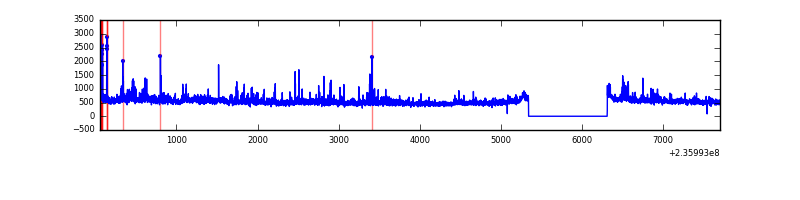 |
| B | 7645 | 6676 | 2 | 2 | 0.03% | 0.03% | 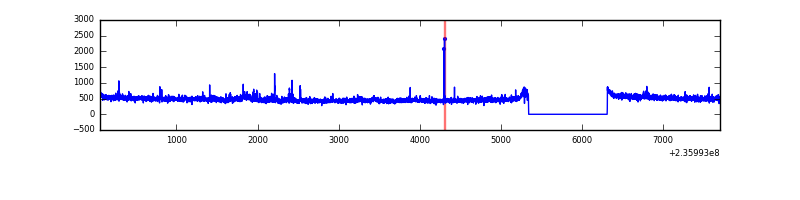 |
| C | 7645 | 6676 | 67 | 67 | 0.88% | 1.00% | 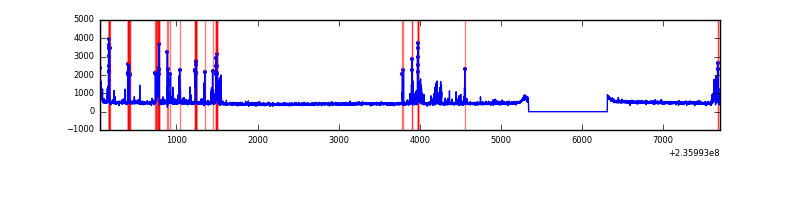 |
| D | 7645 | 6676 | 22 | 22 | 0.29% | 0.33% | 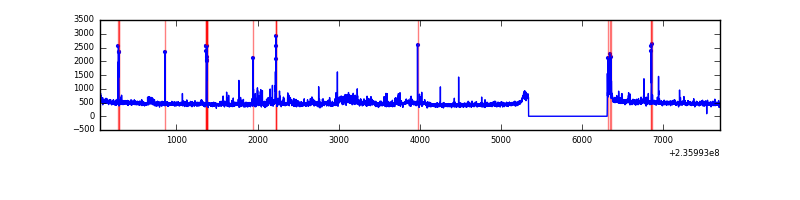 |
Top three noisy pixels from each quadrant. If the there are fewer than three noisy pixels in the level2.evt file, extra rows are filled as -1
| Pixel properties | Quadrant properties | ||||||
|---|---|---|---|---|---|---|---|
| Quadrant | DetID | PixID | Counts | Sigma | Mean | Median | Sigma |
| A | 8 | 5 | 531849 | 3232.25 | 805 | 785 | 164.3 |
| A | 13 | 251 | 22554 | 132.49 | 805 | 785 | 164.3 |
| A | 1 | 162 | 21288 | 124.79 | 805 | 785 | 164.3 |
| B | 0 | 219 | 45983 | 293.19 | 805 | 782 | 154.2 |
| B | 0 | 214 | 38193 | 242.66 | 805 | 782 | 154.2 |
| B | 12 | 111 | 17099 | 105.84 | 805 | 782 | 154.2 |
| C | 4 | 254 | 475808 | 2646.48 | 775 | 777 | 179.5 |
| C | 13 | 61 | 5710 | 27.48 | 775 | 777 | 179.5 |
| C | 8 | 222 | 2268 | 8.31 | 775 | 777 | 179.5 |
| D | 8 | 195 | 106146 | 556.58 | 779 | 758 | 189.3 |
| D | 1 | 52 | 88768 | 464.8 | 779 | 758 | 189.3 |
| D | 7 | 71 | 64085 | 334.44 | 779 | 758 | 189.3 |
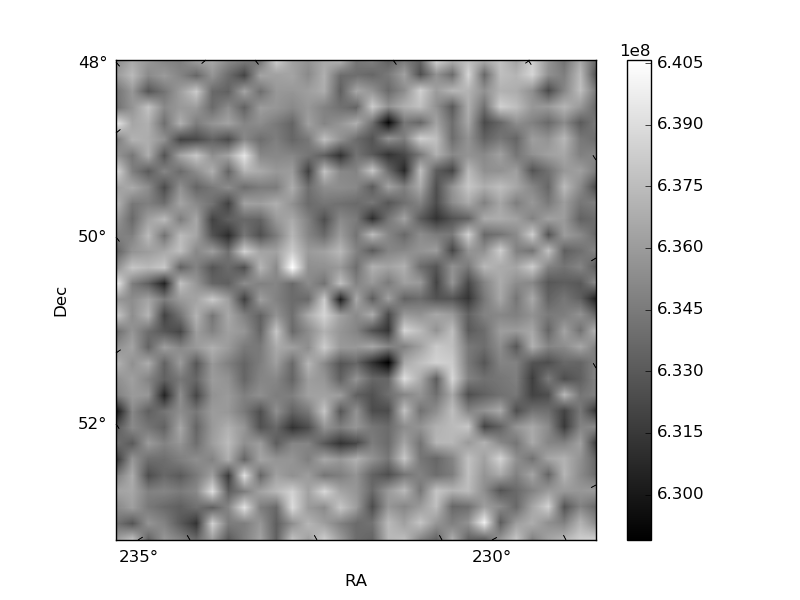
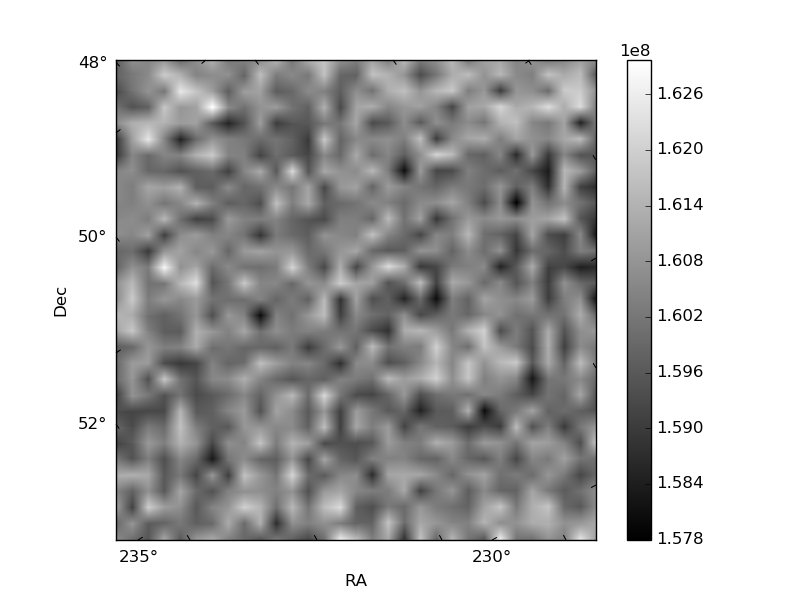
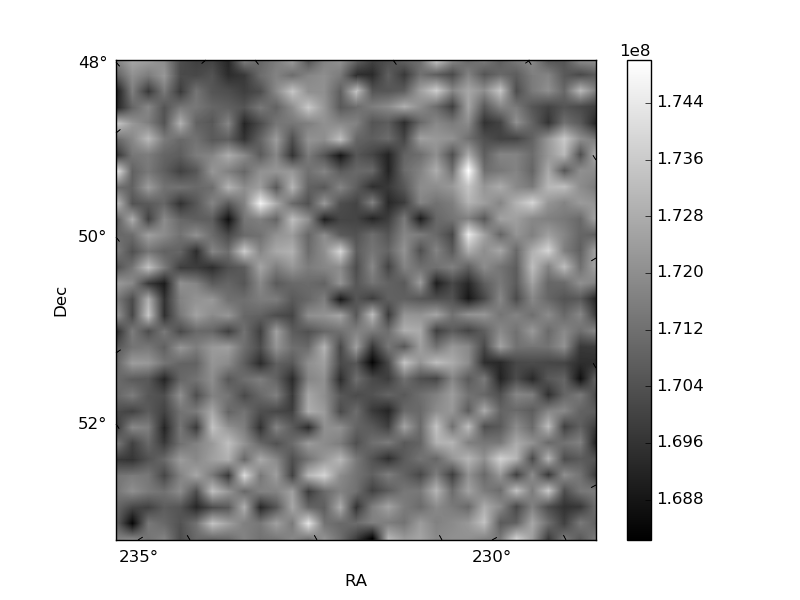
Histogram calculated using DETX and DETY for each event in the final _common_clean file
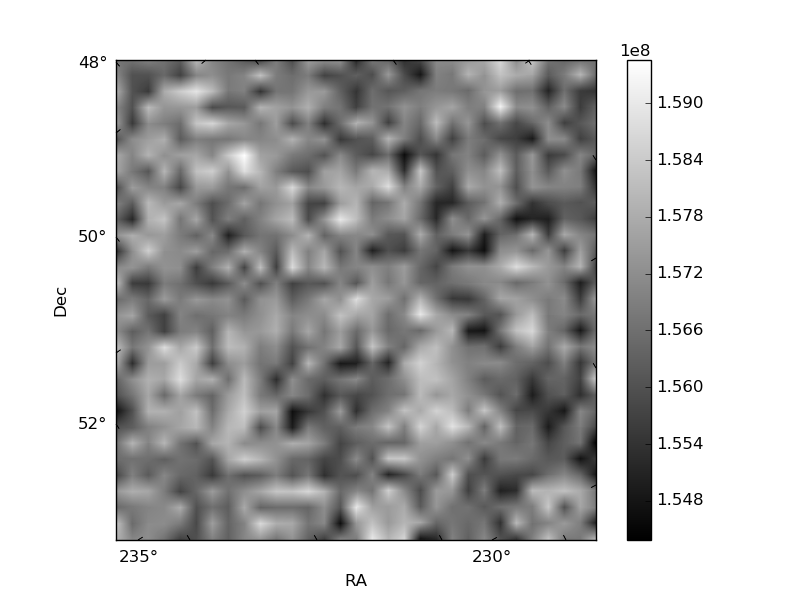
| Quadrant A | 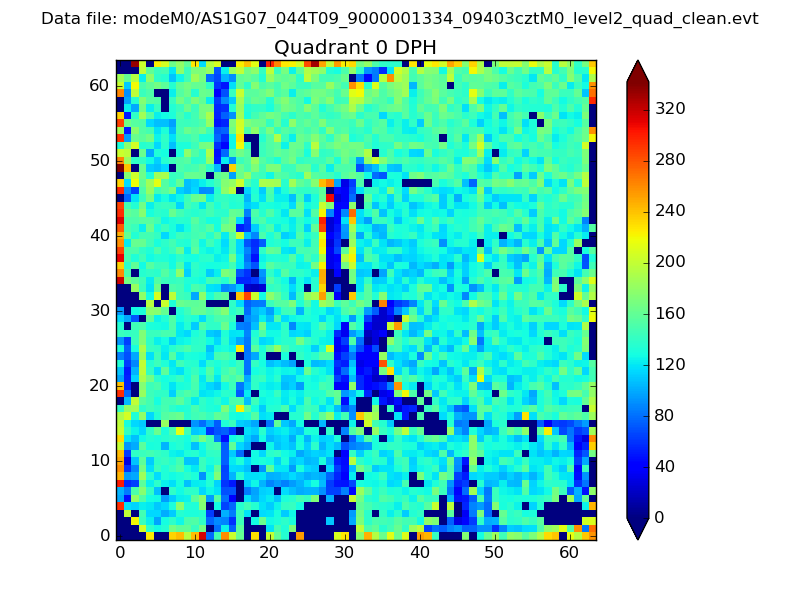 |
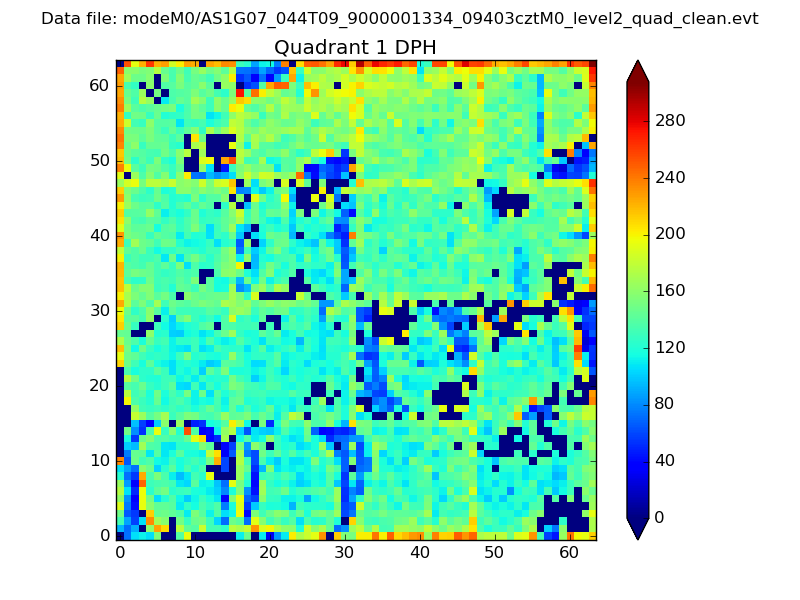 |
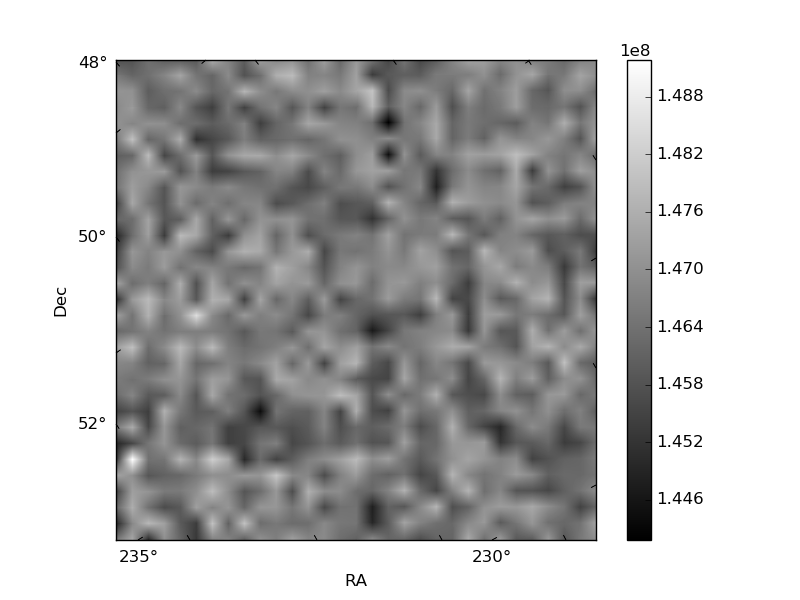
Quadrant B |
|---|---|---|---|
| Quadrant D |  |
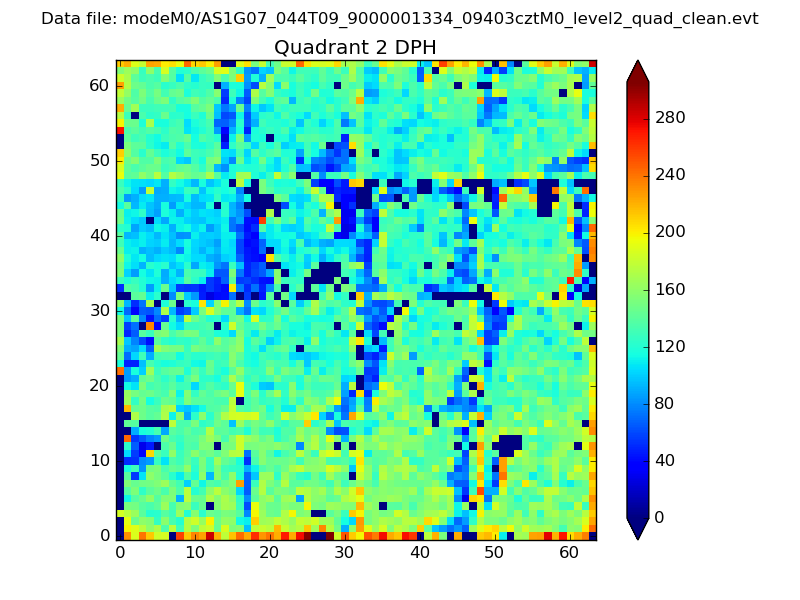 |
Quadrant C |
| Plot type | Count rate plots | Images |
|---|---|---|
| Comparison with Poisson distribution Blue bars denote a histogram of data divided into 1 sec bins. Red curve is a Poisson curve with rate = median count rate of data. |
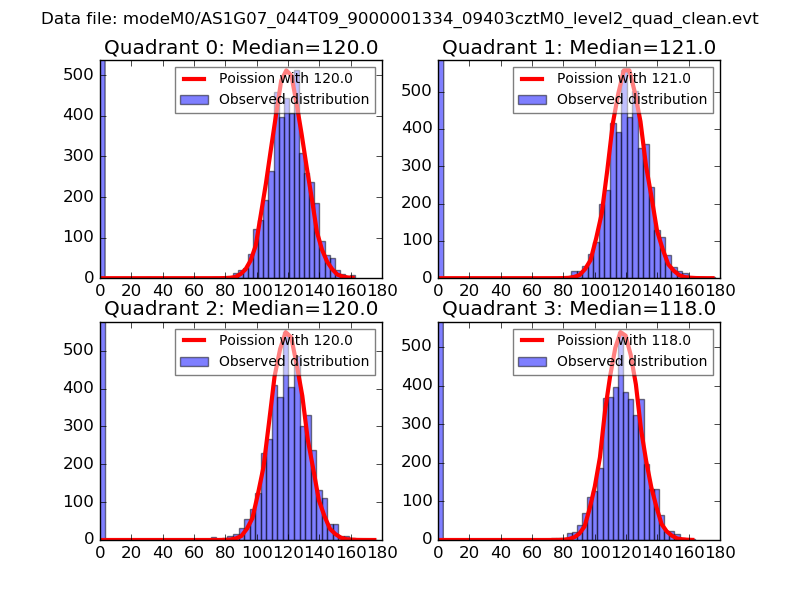 |
 |
| Quadrant-wise count rates Data is divided into 100 sec bins |
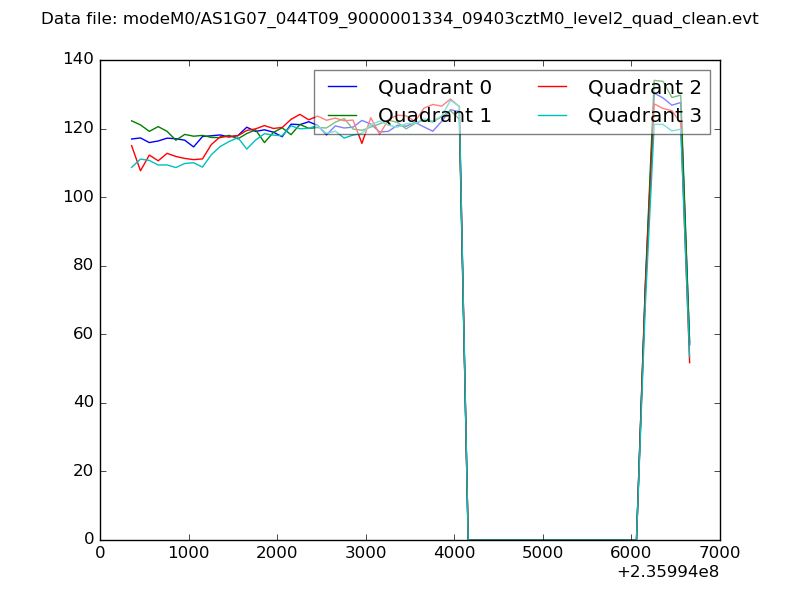 |
|
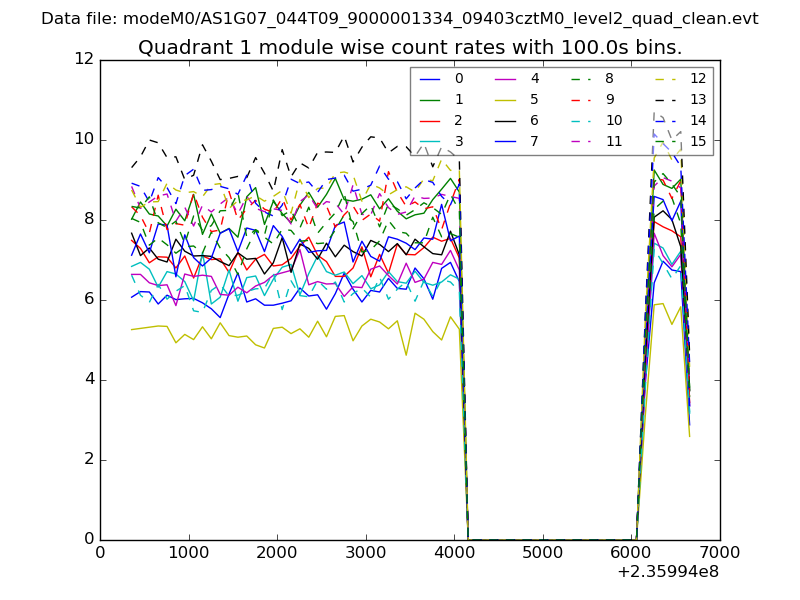
| Module-wise count rates for Quadrant A Data is divided into 100 sec bins |
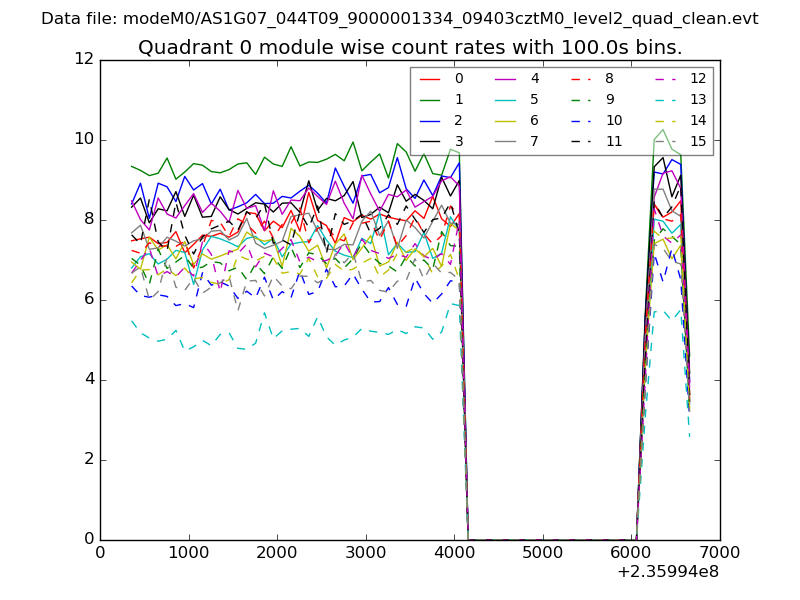 |
 |
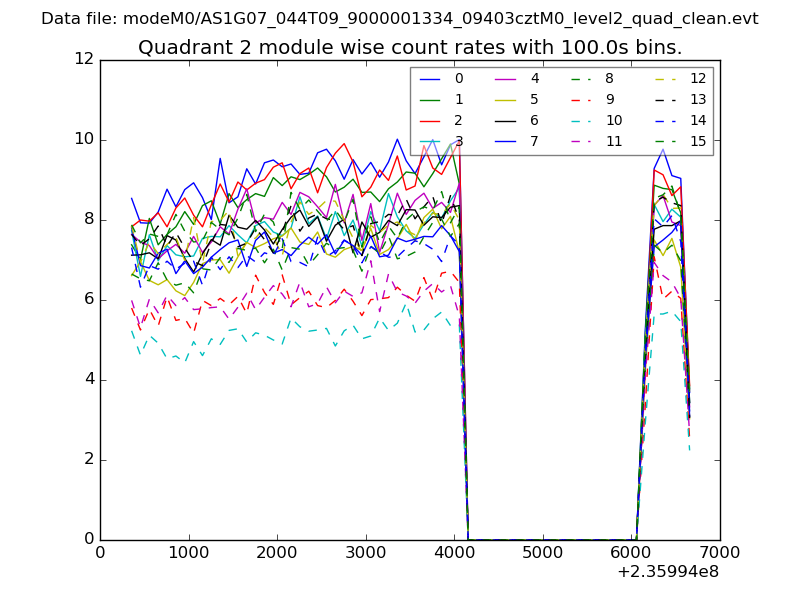
| Module-wise count rates for Quadrant B Data is divided into 100 sec bins |
 |
 |
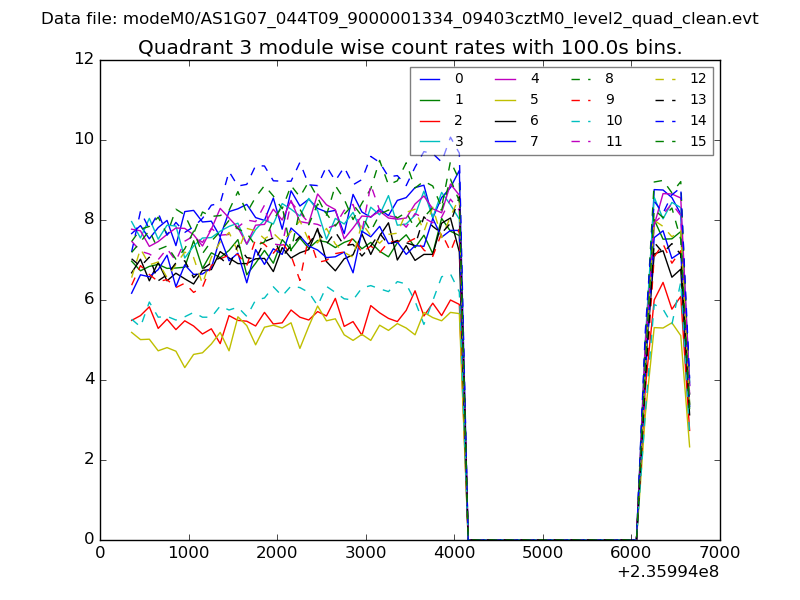
| Module-wise count rates for Quadrant C Data is divided into 100 sec bins |
 |
 |
| Module-wise count rates for Quadrant D Data is divided into 100 sec bins |
 |
 |
| Parameter | Plot |
|---|---|
| CZT HV Monitor | 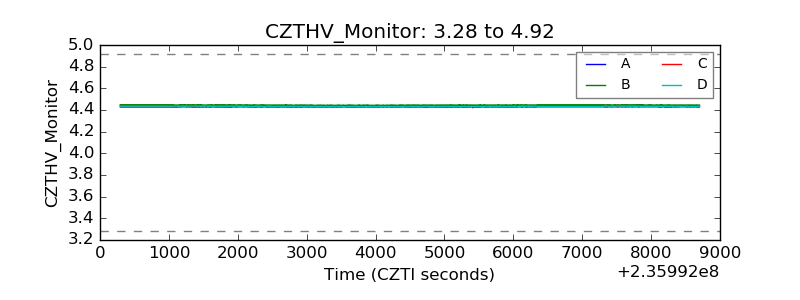 |
| D_VDD | 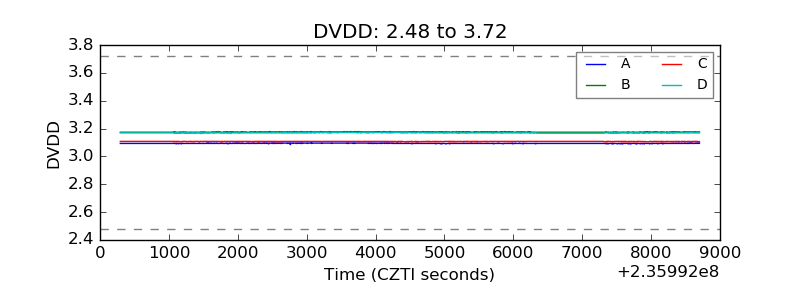 |
| Temperature 1 | 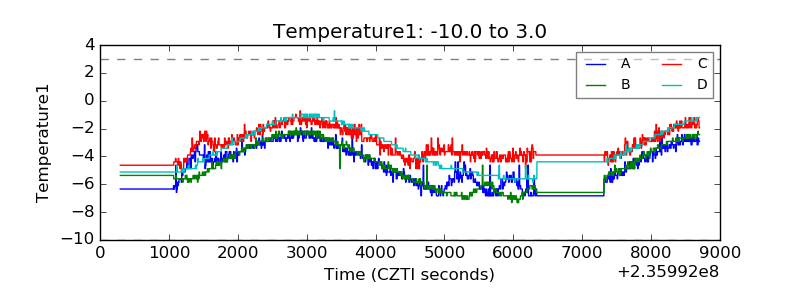 |
| Veto HV Monitor | 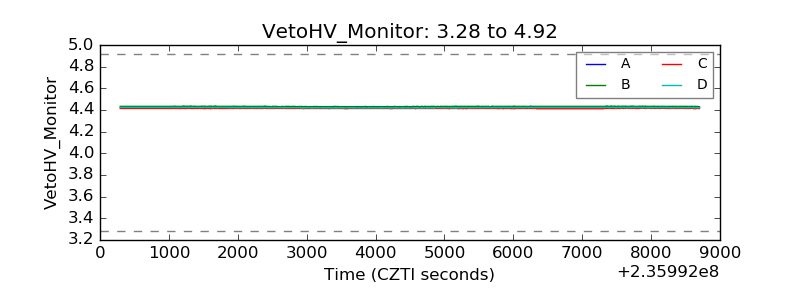 |
| Veto LLD | 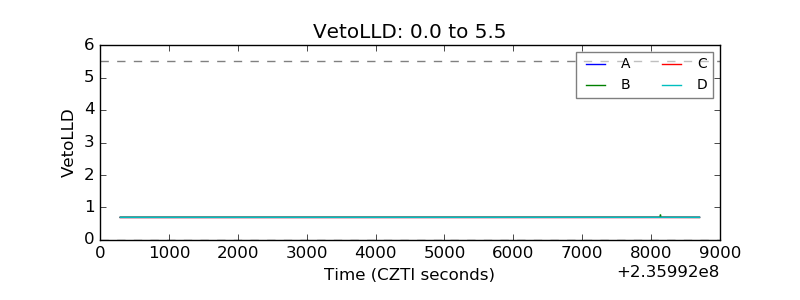 |
| Alpha Counter | 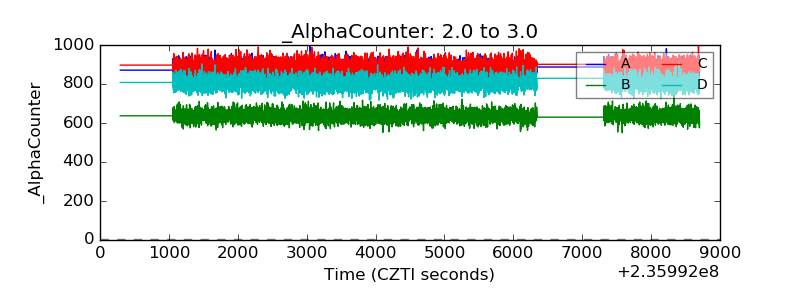 |
| _CPM_Rate | 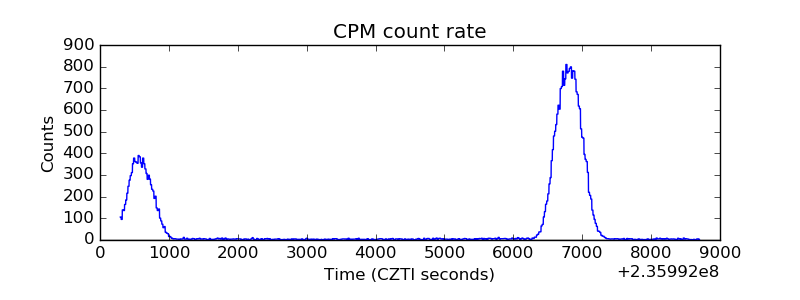 |
| CZT Counter | 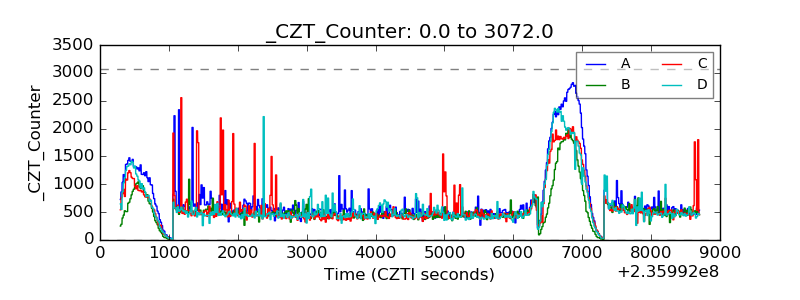 |
| +2.5 Volts monitor |  |
| +5 Volts monitor |  |
| _ROLL_ROT | 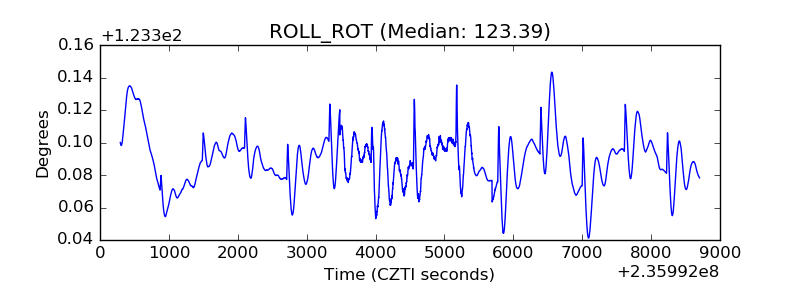 |
| _Roll_DEC | 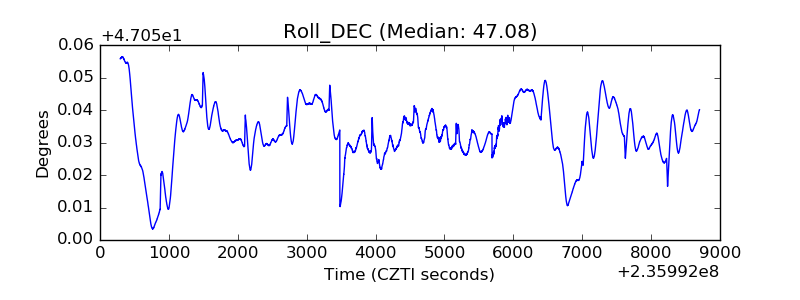 |
| _Roll_RA | 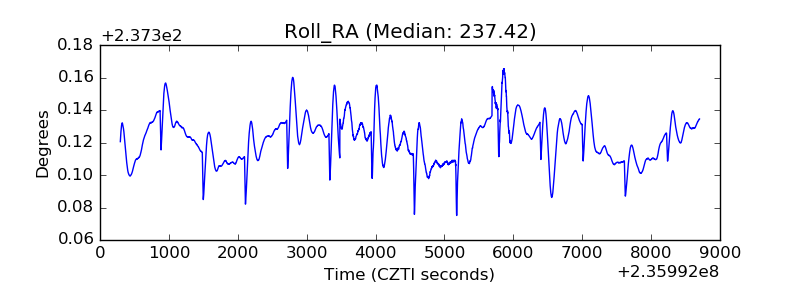 |
| Veto Counter | 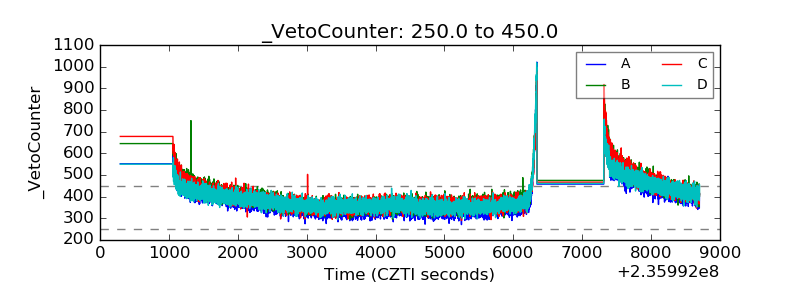 |