| Param | Original file | Final file |
|---|---|---|
| Filename | modeM0/AS1G07_044T09_9000001334_09405cztM0_level2.evt | modeM0/AS1G07_044T09_9000001334_09405cztM0_level2_quad_clean.evt |
| Size (bytes) | 490,325,760 | 97,009,920 |
| Size | 467.6 MB | 92.5 MB |
| Events in quadrant A | 3,760,810 | 618,775 |
| Events in quadrant B | 3,448,077 | 621,878 |
| Events in quadrant C | 3,738,336 | 613,108 |
| Events in quadrant D | 3,434,742 | 604,545 |
| Mode M0 | |||
|---|---|---|---|
| Quadrant | BADHDUFLAG | Total packets | Discarded packets |
| A | 0 | 15537 | 6 |
| B | 0 | 14901 | 2 |
| C | 0 | 15559 | 5 |
| D | 0 | 14921 | 2 |
| Mode M9 | |||
|---|---|---|---|
| Quadrant | BADHDUFLAG | Total packets | Discarded packets |
| A | 0 | 22 | 0 |
| B | 0 | 22 | 0 |
| C | 0 | 22 | 0 |
| D | 0 | 22 | 0 |
| Mode SS | |||
|---|---|---|---|
| Quadrant | BADHDUFLAG | Total packets | Discarded packets |
| A | 0 | 140 | 0 |
| B | 0 | 140 | 0 |
| C | 0 | 140 | 0 |
| D | 0 | 140 | 0 |
| Quadrant | Total seconds | Saturated seconds | Saturation percentage |
|---|---|---|---|
| A | 6887 | 162 | 2.352258% |
| B | 6888 | 146 | 2.119628% |
| C | 6887 | 168 | 2.439379% |
| D | 6888 | 149 | 2.163182% |
Noise dominated data is calculated using 1-second bins in cleaned event files. If a bin has >2000 counts, and if more than 50% of those come from <1% of pixels, then it is considered to be noise-dominated and hence unusable.
| Quadrant | # 1 sec bins | Bins with >0 counts | Bins with >2000 counts | High rate bins dominated by noise | Noise dominated (total time) | Noise dominated (detector-on time) | Marked lightcurve |
|---|---|---|---|---|---|---|---|
| A | 8973 | 6890 | 5 | 5 | 0.06% | 0.07% | 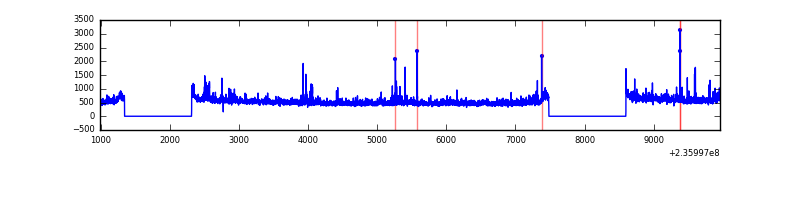 |
| B | 8973 | 6890 | 0 | 0 | 0.00% | 0.00% | 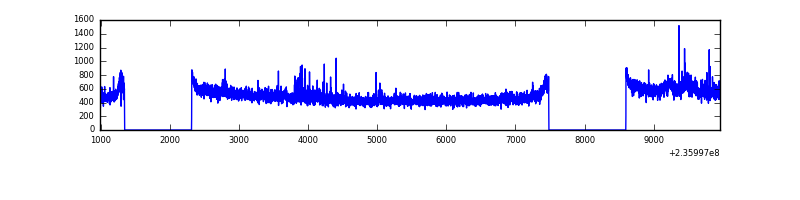 |
| C | 8973 | 6890 | 38 | 38 | 0.42% | 0.55% | 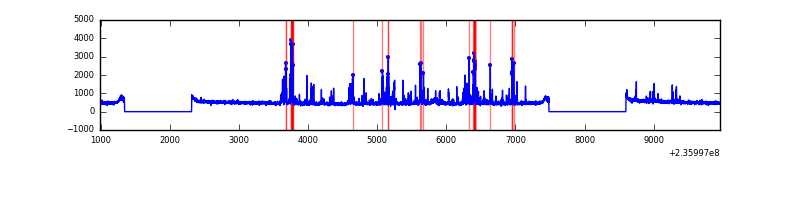 |
| D | 8973 | 6890 | 9 | 9 | 0.10% | 0.13% | 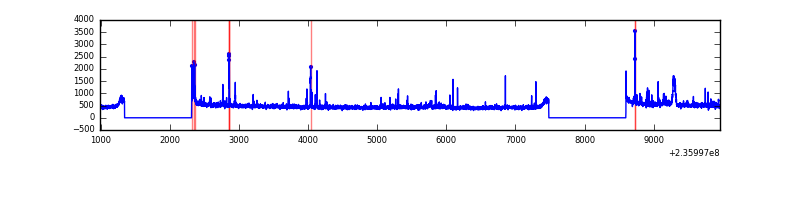 |
Top three noisy pixels from each quadrant. If the there are fewer than three noisy pixels in the level2.evt file, extra rows are filled as -1
| Pixel properties | Quadrant properties | ||||||
|---|---|---|---|---|---|---|---|
| Quadrant | DetID | PixID | Counts | Sigma | Mean | Median | Sigma |
| A | 8 | 5 | 353815 | 2017.45 | 858 | 837 | 175.0 |
| A | 5 | 16 | 43603 | 244.43 | 858 | 837 | 175.0 |
| A | 1 | 162 | 19171 | 104.79 | 858 | 837 | 175.0 |
| B | 0 | 214 | 49633 | 299.59 | 854 | 832 | 162.9 |
| B | 0 | 219 | 45127 | 271.92 | 854 | 832 | 162.9 |
| B | 0 | 187 | 31425 | 187.81 | 854 | 832 | 162.9 |
| C | 4 | 254 | 491763 | 2580.16 | 831 | 835 | 190.3 |
| C | 13 | 61 | 6308 | 28.76 | 831 | 835 | 190.3 |
| C | 5 | 96 | 2797 | 10.31 | 831 | 835 | 190.3 |
| D | 1 | 52 | 128903 | 638.0 | 833 | 812 | 200.8 |
| D | 8 | 195 | 58312 | 286.4 | 833 | 812 | 200.8 |
| D | 7 | 71 | 29520 | 142.99 | 833 | 812 | 200.8 |
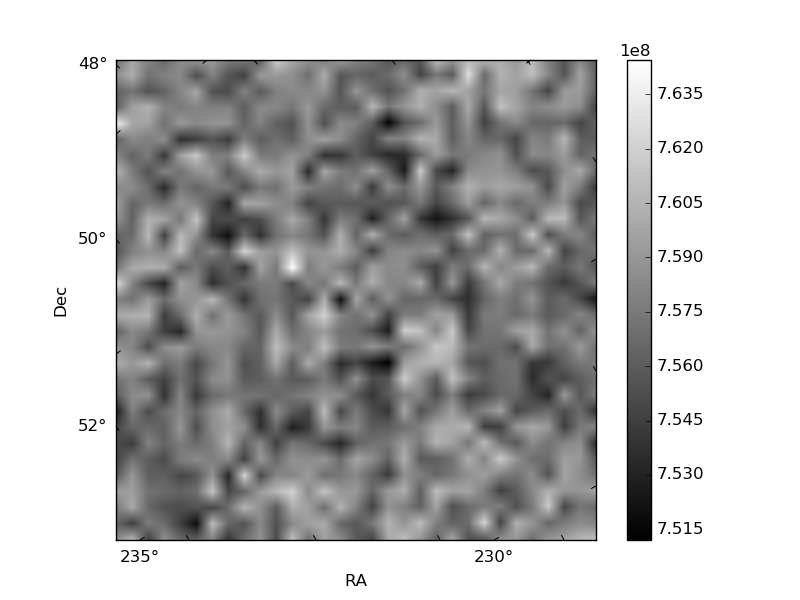
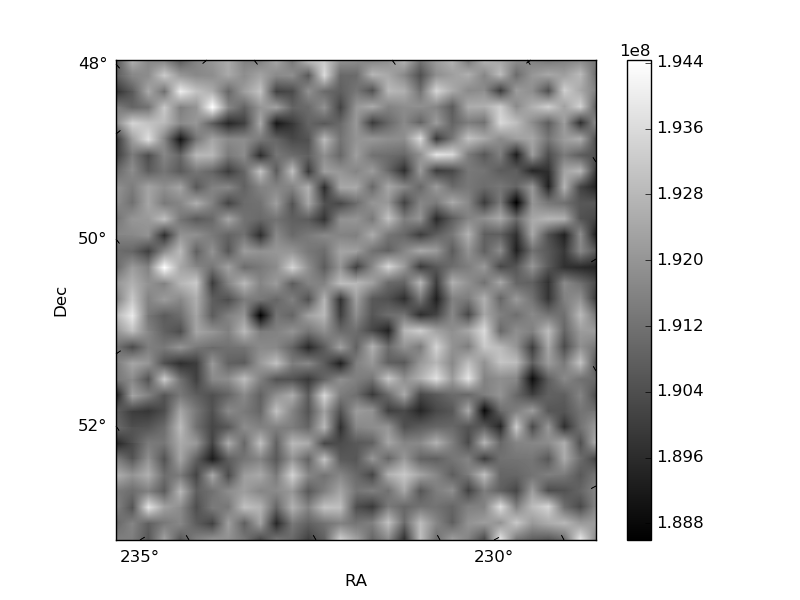
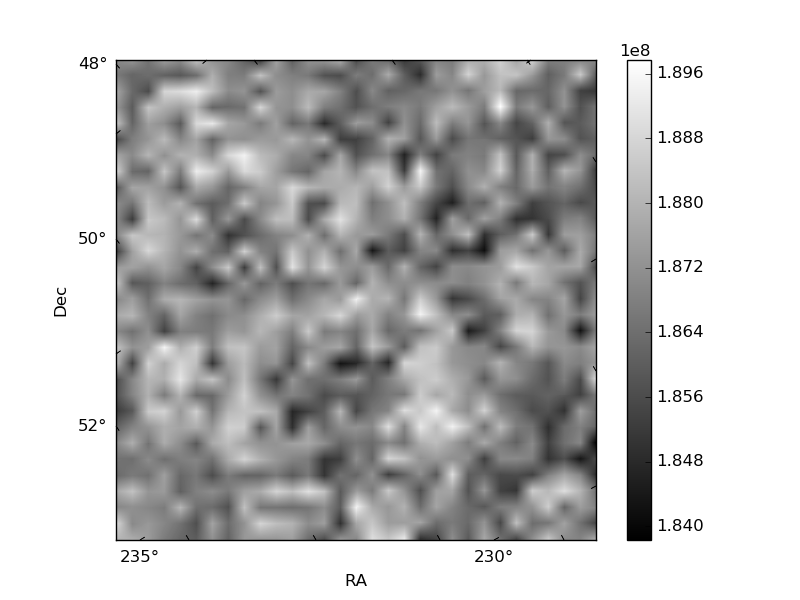
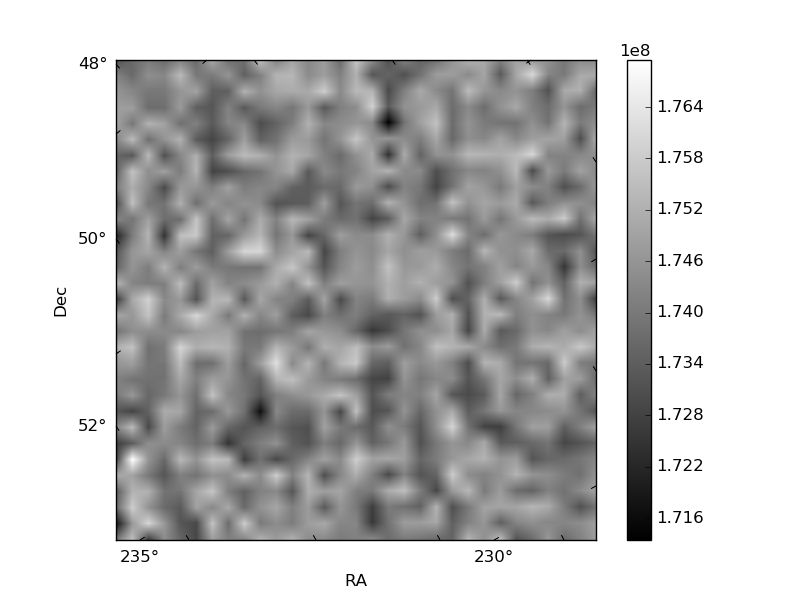
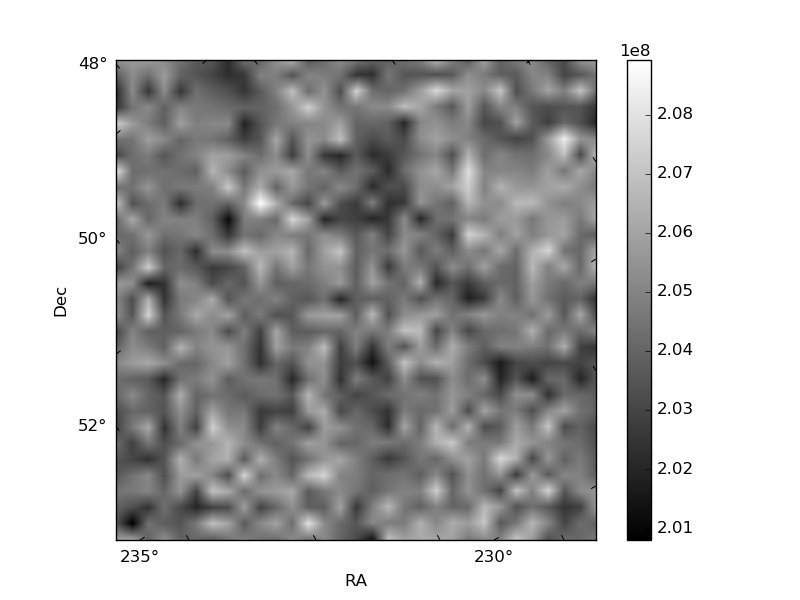
Histogram calculated using DETX and DETY for each event in the final _common_clean file
| Quadrant A | 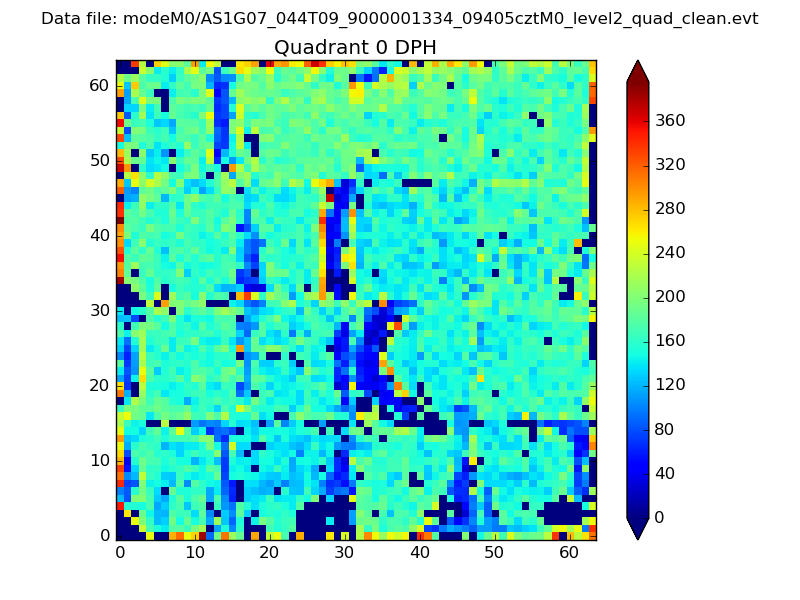 |
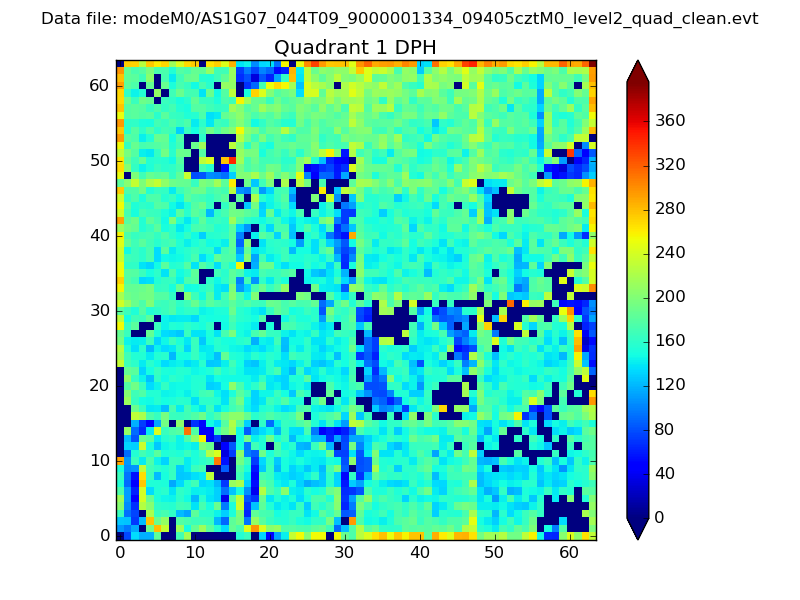 |
Quadrant B |
|---|---|---|---|
| Quadrant D | 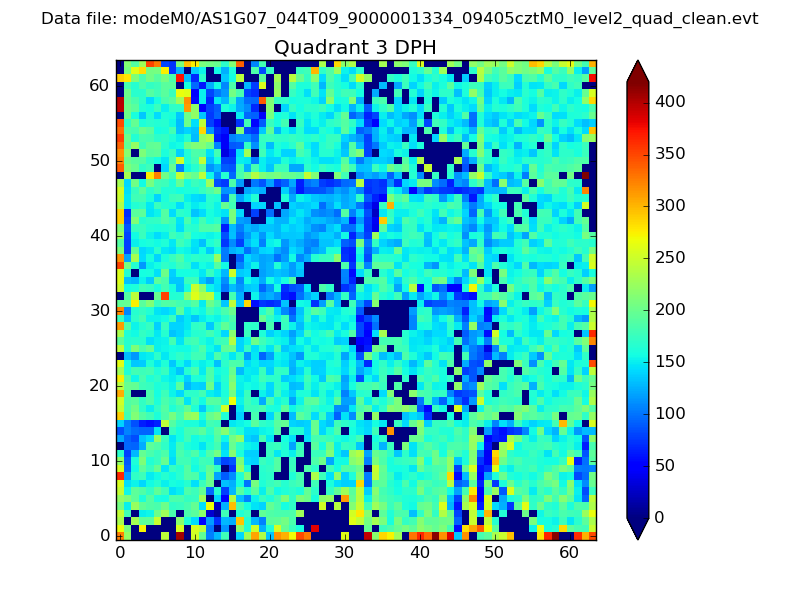 |
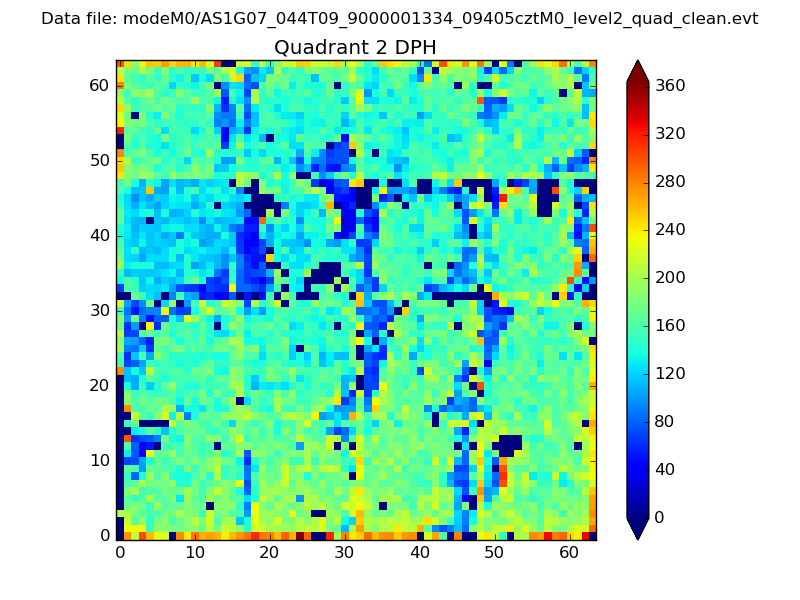 |
Quadrant C |
| Plot type | Count rate plots | Images |
|---|---|---|
| Comparison with Poisson distribution Blue bars denote a histogram of data divided into 1 sec bins. Red curve is a Poisson curve with rate = median count rate of data. |
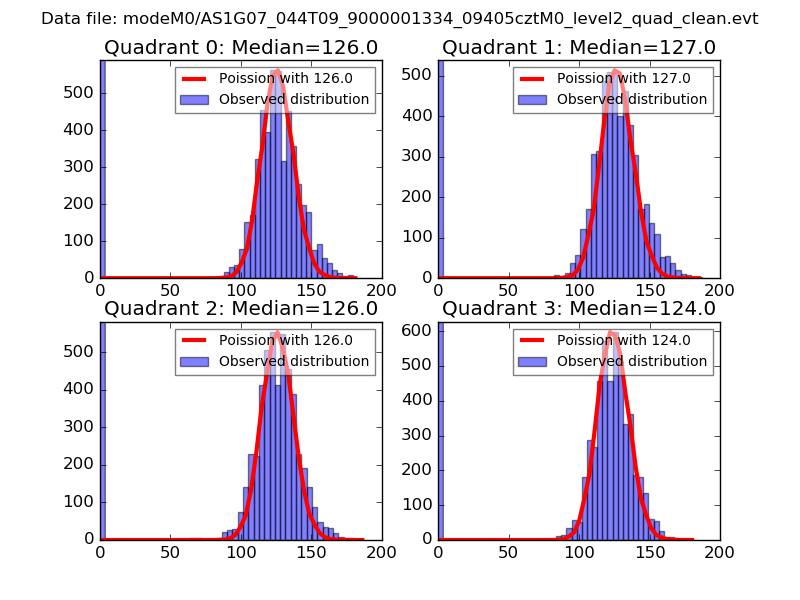 |
 |
| Quadrant-wise count rates Data is divided into 100 sec bins |
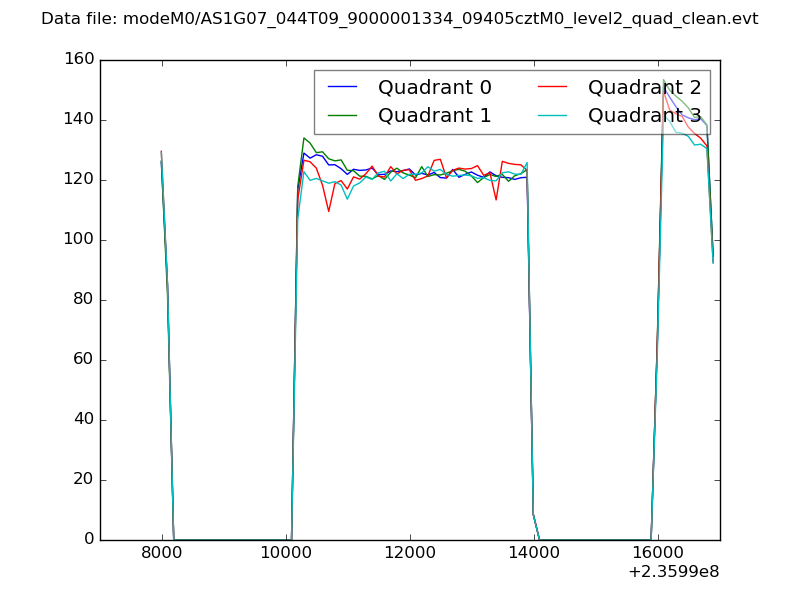 |
|
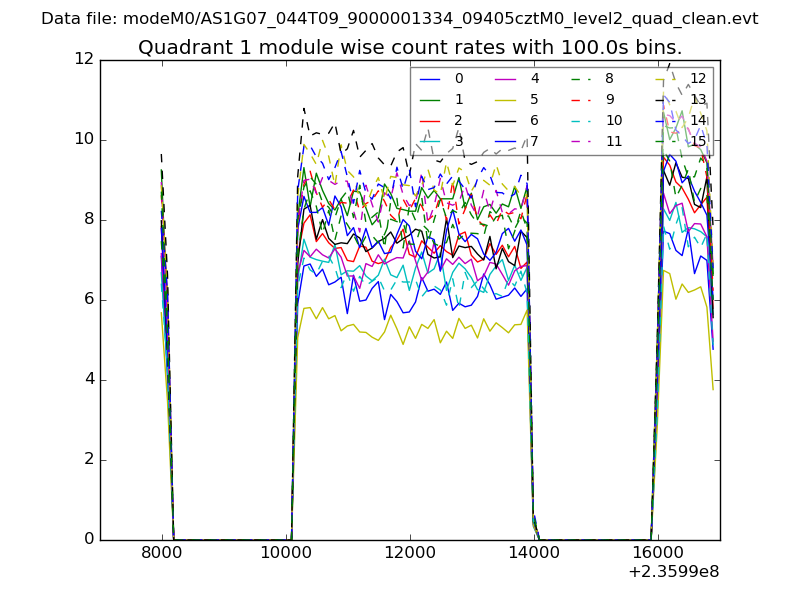
| Module-wise count rates for Quadrant A Data is divided into 100 sec bins |
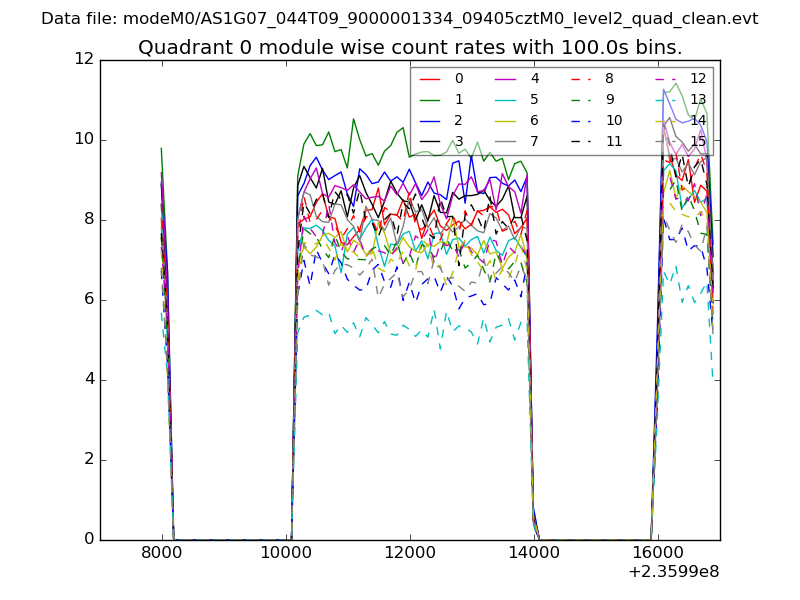 |
 |
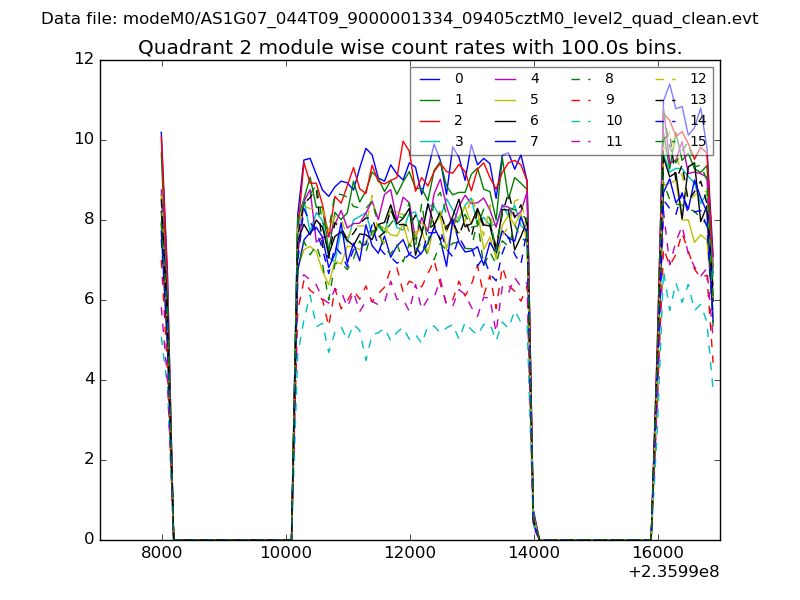
| Module-wise count rates for Quadrant B Data is divided into 100 sec bins |
 |
 |
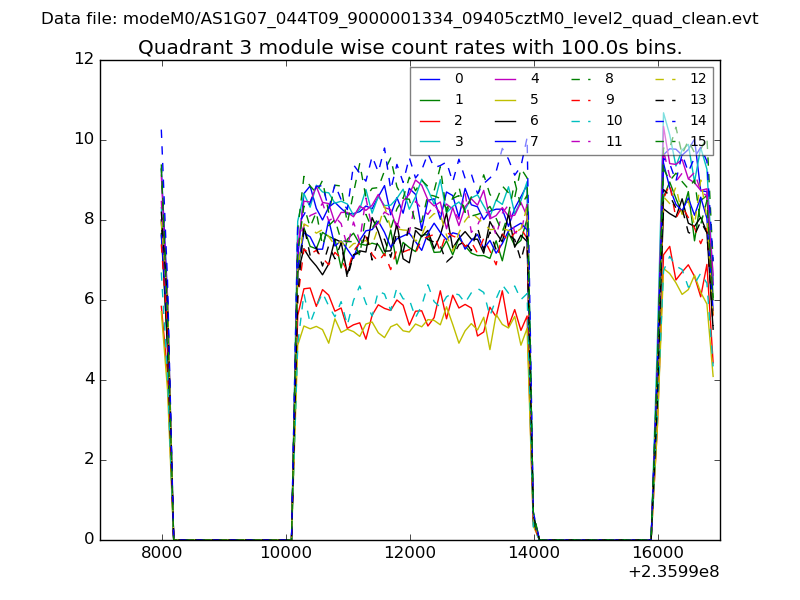
| Module-wise count rates for Quadrant C Data is divided into 100 sec bins |
 |
 |
| Module-wise count rates for Quadrant D Data is divided into 100 sec bins |
 |
 |
| Parameter | Plot |
|---|---|
| CZT HV Monitor | 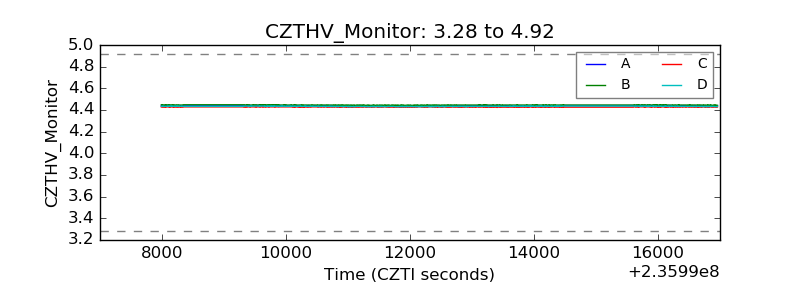 |
| D_VDD | 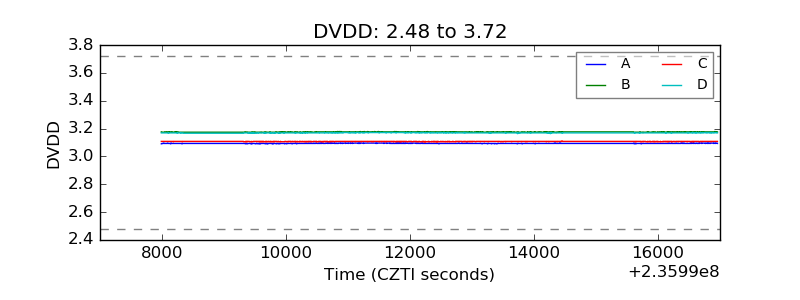 |
| Temperature 1 | 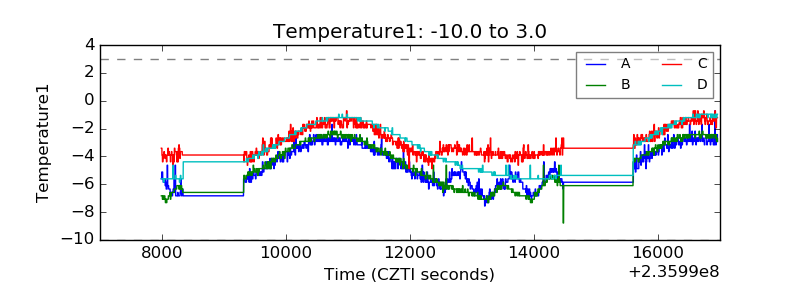 |
| Veto HV Monitor | 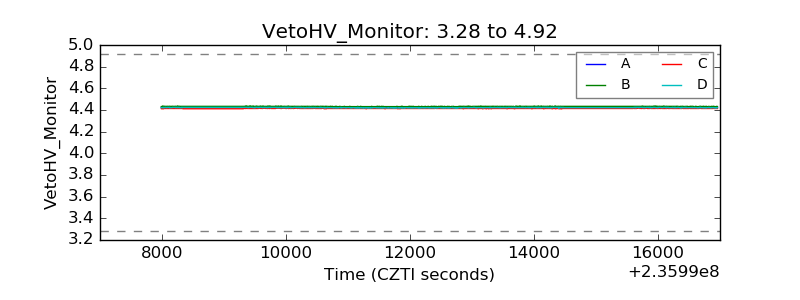 |
| Veto LLD | 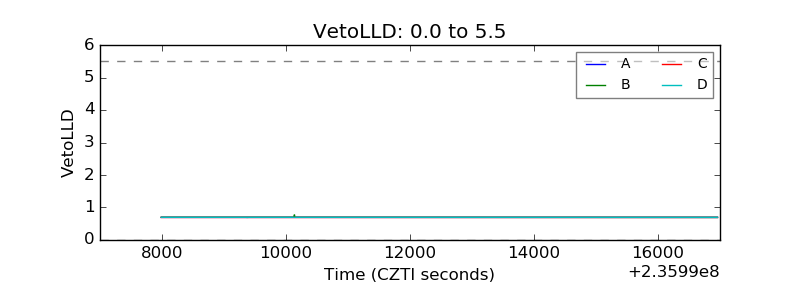 |
| Alpha Counter | 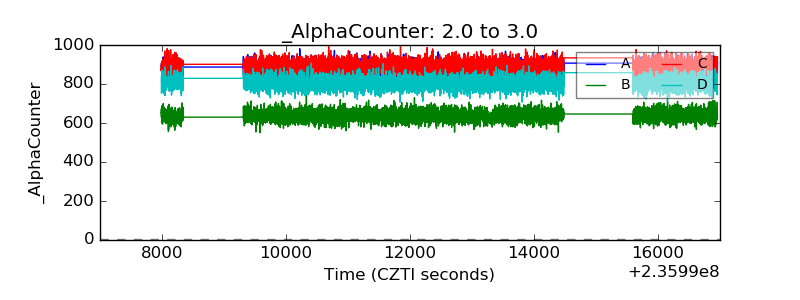 |
| _CPM_Rate | 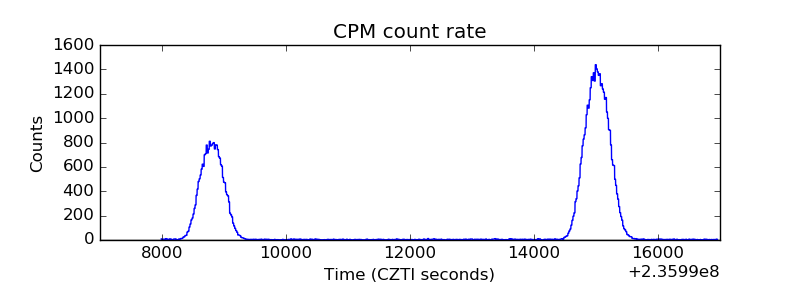 |
| CZT Counter | 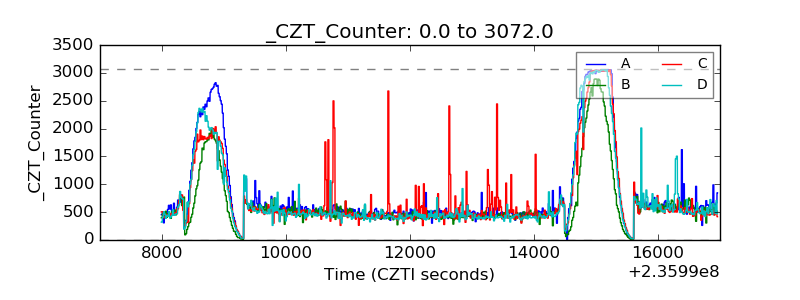 |
| +2.5 Volts monitor |  |
| +5 Volts monitor |  |
| _ROLL_ROT | 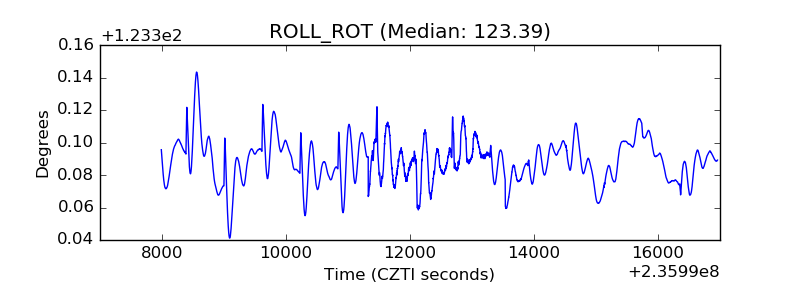 |
| _Roll_DEC | 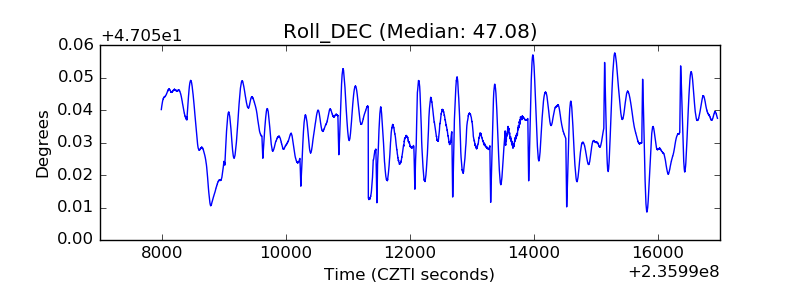 |
| _Roll_RA | 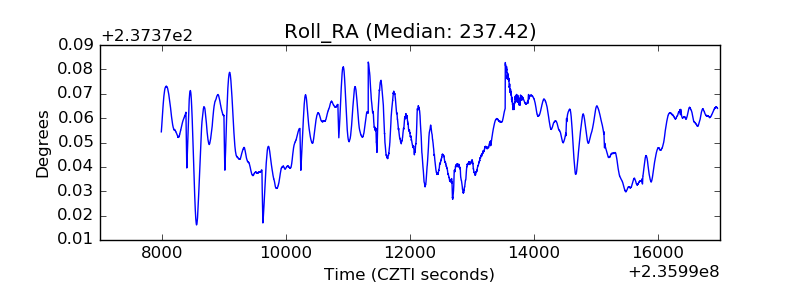 |
| Veto Counter | 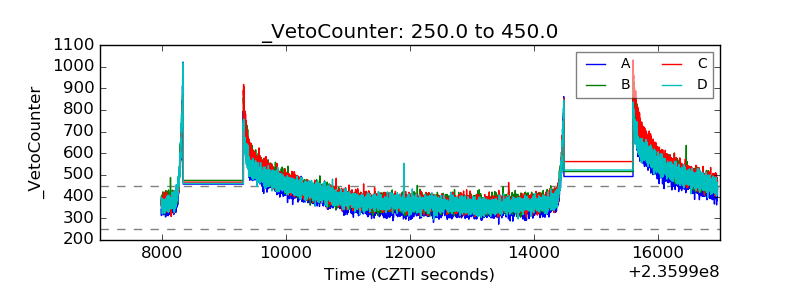 |