| Param | Original file | Final file |
|---|---|---|
| Filename | modeM0/AS1G07_044T09_9000001334_09406cztM0_level2.evt | modeM0/AS1G07_044T09_9000001334_09406cztM0_level2_quad_clean.evt |
| Size (bytes) | 449,256,960 | 105,664,320 |
| Size | 428.4 MB | 100.8 MB |
| Events in quadrant A | 3,540,151 | 694,052 |
| Events in quadrant B | 3,202,306 | 700,082 |
| Events in quadrant C | 3,039,117 | 695,941 |
| Events in quadrant D | 3,399,198 | 673,622 |
| Mode M0 | |||
|---|---|---|---|
| Quadrant | BADHDUFLAG | Total packets | Discarded packets |
| A | 0 | 14680 | 3 |
| B | 0 | 13872 | 2 |
| C | 0 | 13175 | 2 |
| D | 0 | 14152 | 2 |
| Mode M9 | |||
|---|---|---|---|
| Quadrant | BADHDUFLAG | Total packets | Discarded packets |
| A | 0 | 12 | 0 |
| B | 0 | 12 | 0 |
| C | 0 | 12 | 0 |
| D | 0 | 12 | 0 |
| Mode SS | |||
|---|---|---|---|
| Quadrant | BADHDUFLAG | Total packets | Discarded packets |
| A | 0 | 128 | 0 |
| B | 0 | 128 | 0 |
| C | 0 | 128 | 0 |
| D | 0 | 128 | 0 |
| Quadrant | Total seconds | Saturated seconds | Saturation percentage |
|---|---|---|---|
| A | 6251 | 65 | 1.039834% |
| B | 6251 | 44 | 0.703887% |
| C | 6251 | 37 | 0.591905% |
| D | 6251 | 76 | 1.215805% |
Noise dominated data is calculated using 1-second bins in cleaned event files. If a bin has >2000 counts, and if more than 50% of those come from <1% of pixels, then it is considered to be noise-dominated and hence unusable.
| Quadrant | # 1 sec bins | Bins with >0 counts | Bins with >2000 counts | High rate bins dominated by noise | Noise dominated (total time) | Noise dominated (detector-on time) | Marked lightcurve |
|---|---|---|---|---|---|---|---|
| A | 7506 | 6252 | 11 | 11 | 0.15% | 0.18% |  |
| B | 7506 | 6252 | 0 | 0 | 0.00% | 0.00% | 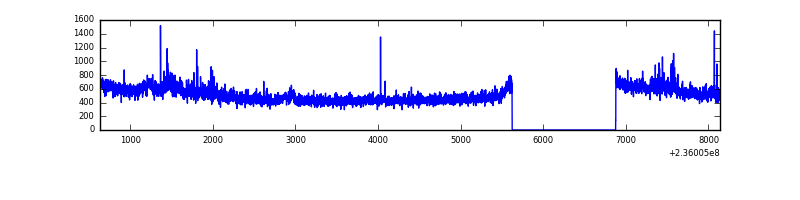 |
| C | 7506 | 6252 | 0 | 0 | 0.00% | 0.00% | 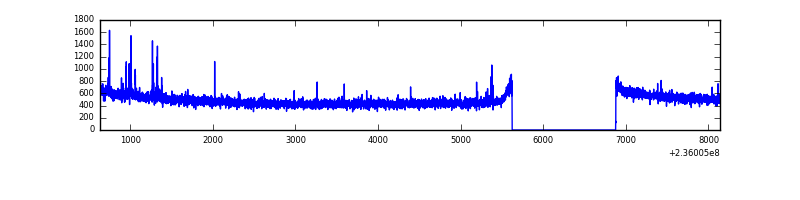 |
| D | 7506 | 6252 | 27 | 27 | 0.36% | 0.43% |  |
Top three noisy pixels from each quadrant. If the there are fewer than three noisy pixels in the level2.evt file, extra rows are filled as -1
| Pixel properties | Quadrant properties | ||||||
|---|---|---|---|---|---|---|---|
| Quadrant | DetID | PixID | Counts | Sigma | Mean | Median | Sigma |
| A | 8 | 5 | 427679 | 2698.65 | 786 | 771 | 158.2 |
| A | 5 | 16 | 48754 | 303.32 | 786 | 771 | 158.2 |
| A | 13 | 251 | 17905 | 108.31 | 786 | 771 | 158.2 |
| B | 0 | 214 | 67577 | 449.79 | 784 | 765 | 148.5 |
| B | 0 | 219 | 62577 | 416.13 | 784 | 765 | 148.5 |
| B | 0 | 187 | 33611 | 221.12 | 784 | 765 | 148.5 |
| C | 4 | 254 | 30850 | 171.75 | 769 | 773 | 175.1 |
| C | 13 | 61 | 5676 | 28.0 | 769 | 773 | 175.1 |
| C | 14 | 67 | 3137 | 13.5 | 769 | 773 | 175.1 |
| D | 1 | 52 | 139352 | 754.23 | 767 | 750 | 183.8 |
| D | 8 | 195 | 114591 | 619.48 | 767 | 750 | 183.8 |
| D | 12 | 227 | 97259 | 525.17 | 767 | 750 | 183.8 |
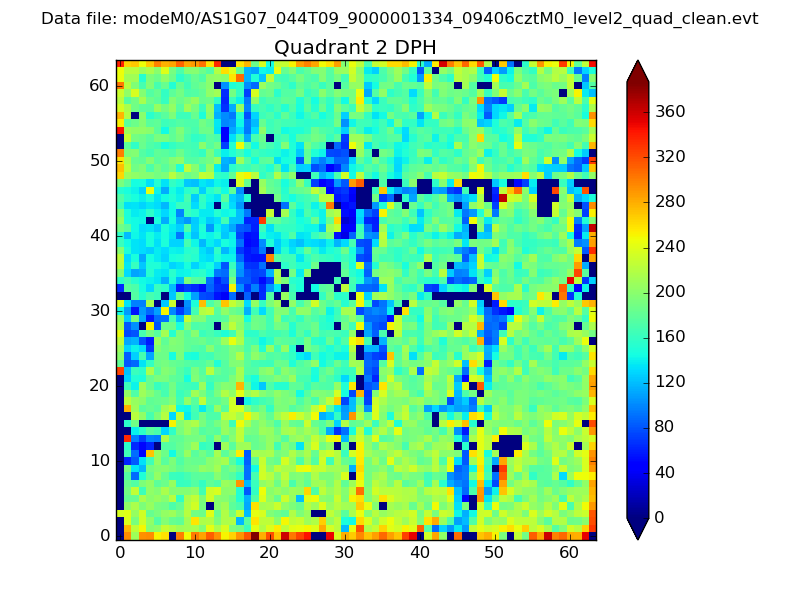
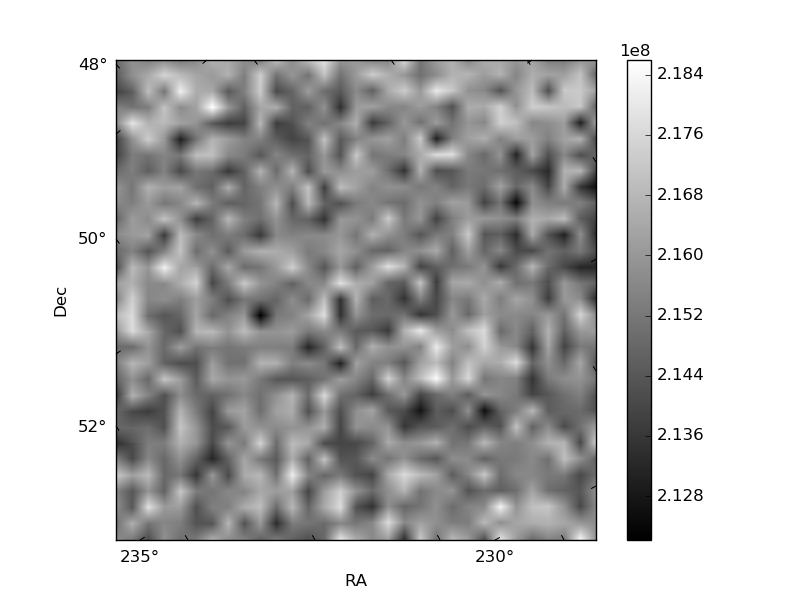
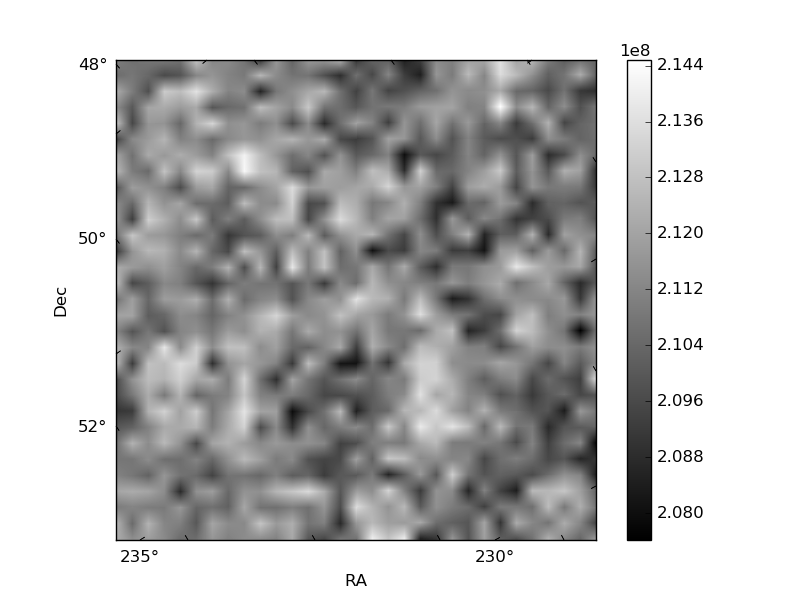
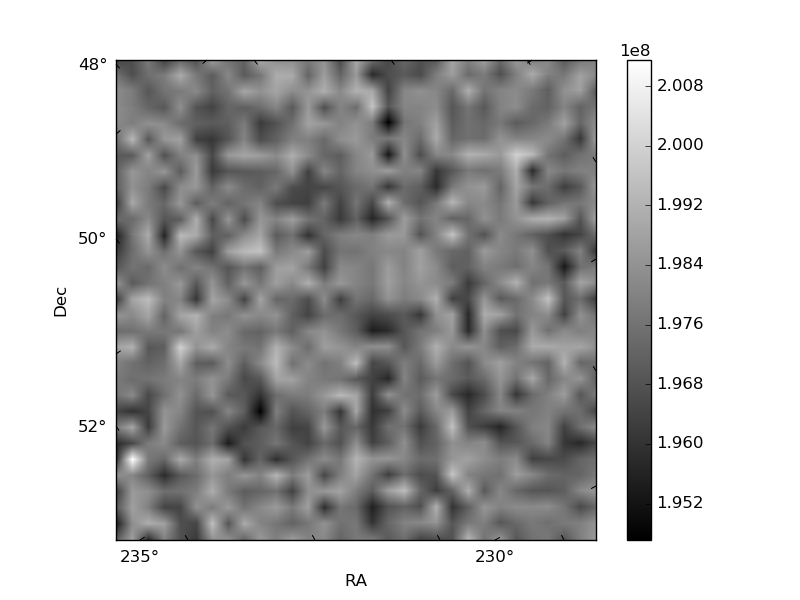
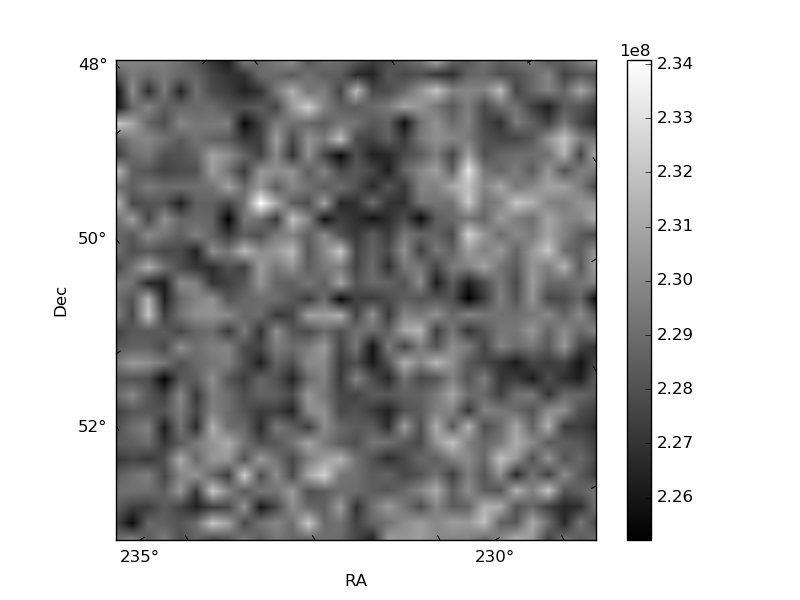
Histogram calculated using DETX and DETY for each event in the final _common_clean file
| Quadrant A | 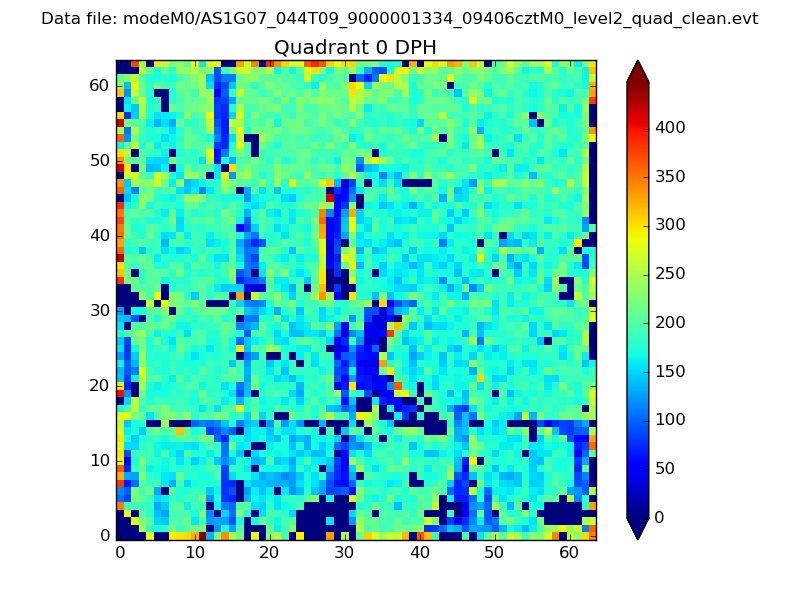 |
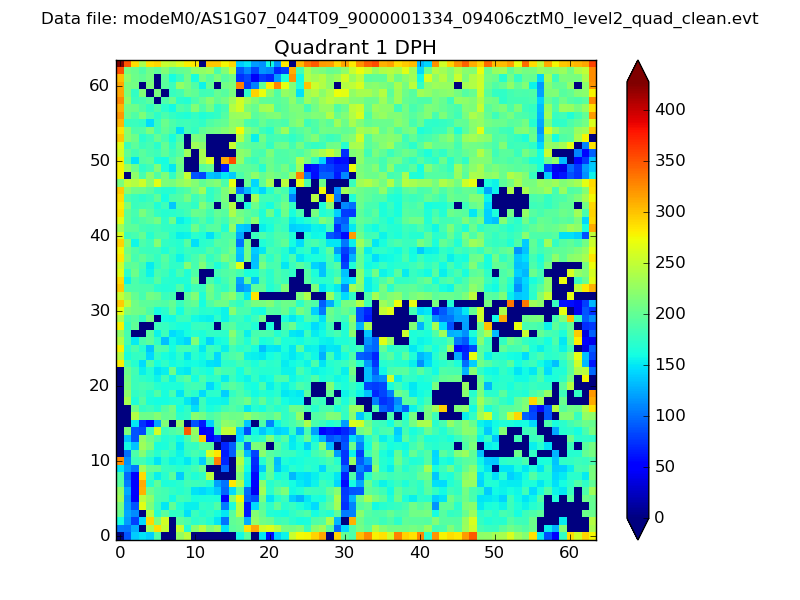 |
Quadrant B |
|---|---|---|---|
| Quadrant D | 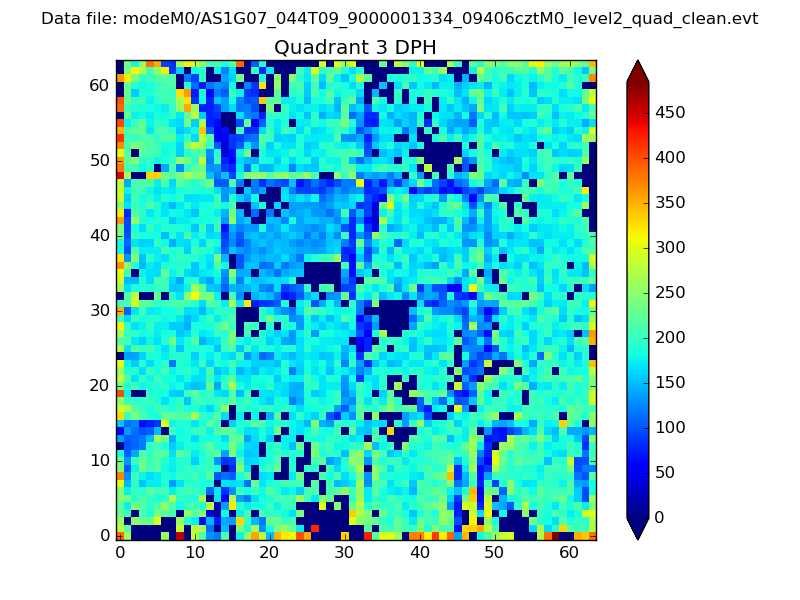 |
 |
Quadrant C |
| Plot type | Count rate plots | Images |
|---|---|---|
| Comparison with Poisson distribution Blue bars denote a histogram of data divided into 1 sec bins. Red curve is a Poisson curve with rate = median count rate of data. |
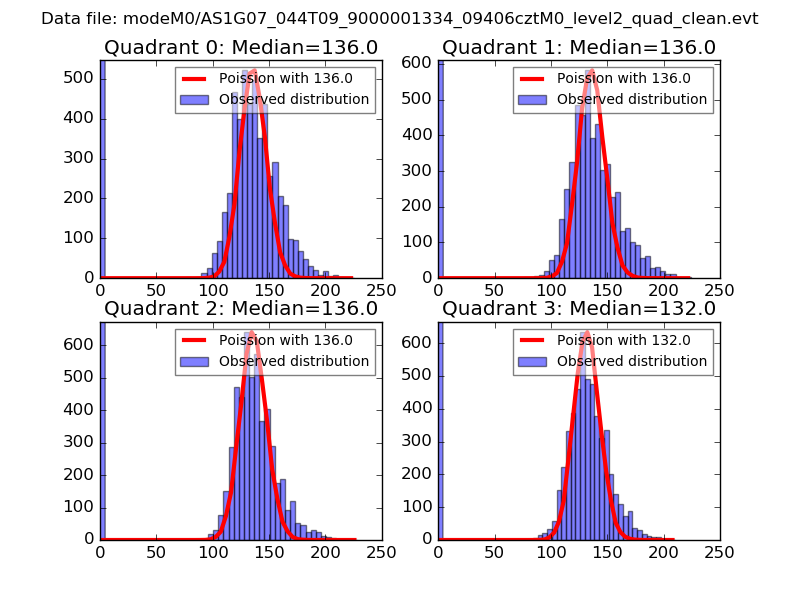 |
 |
| Quadrant-wise count rates Data is divided into 100 sec bins |
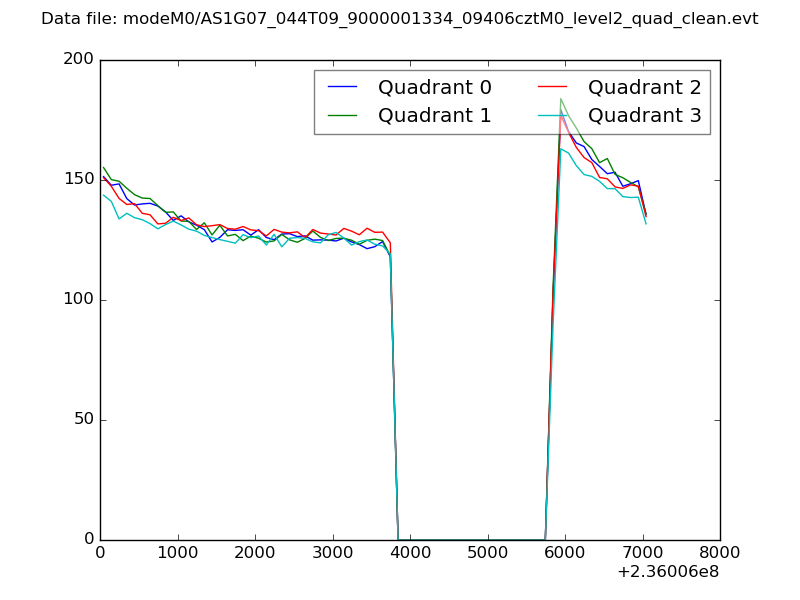 |
|
| Module-wise count rates for Quadrant A Data is divided into 100 sec bins |
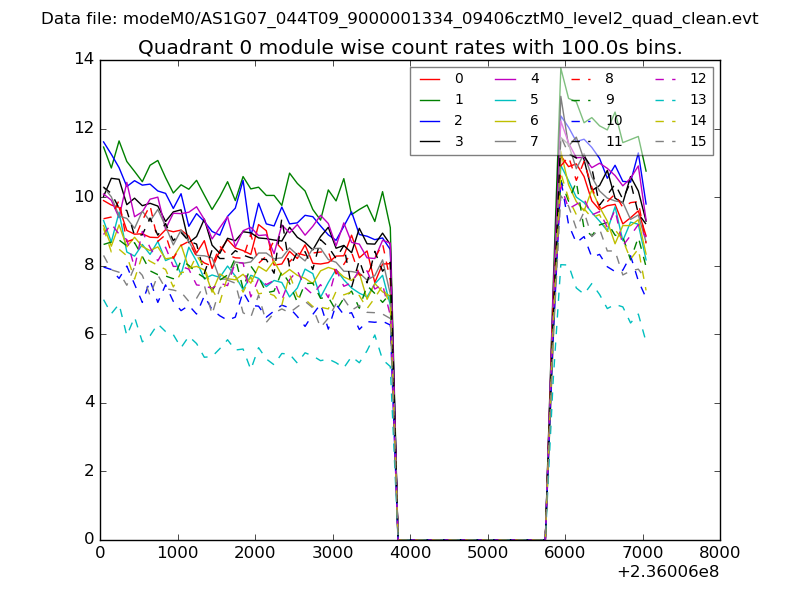 |
 |
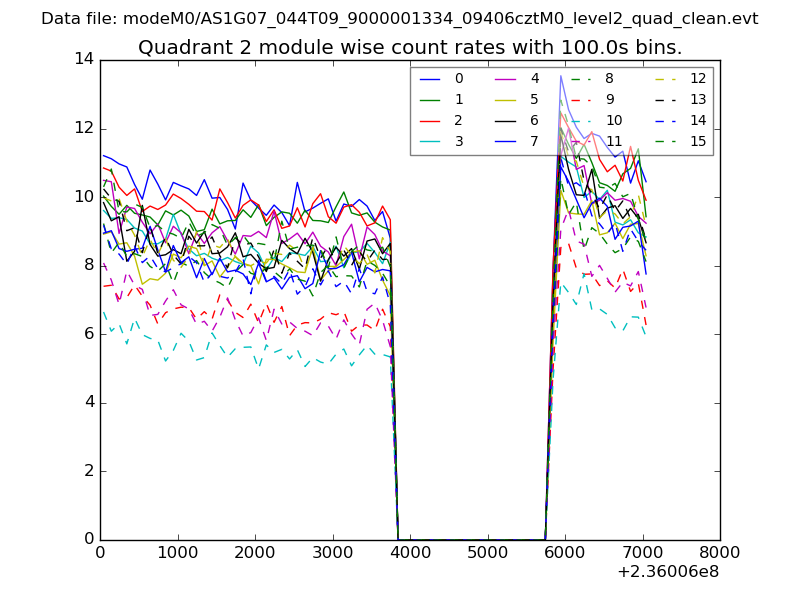
| Module-wise count rates for Quadrant B Data is divided into 100 sec bins |
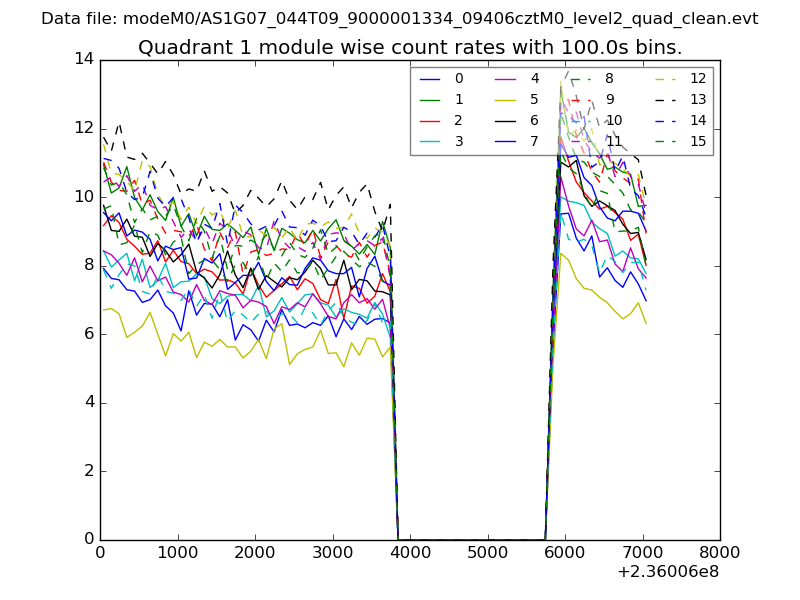 |
 |
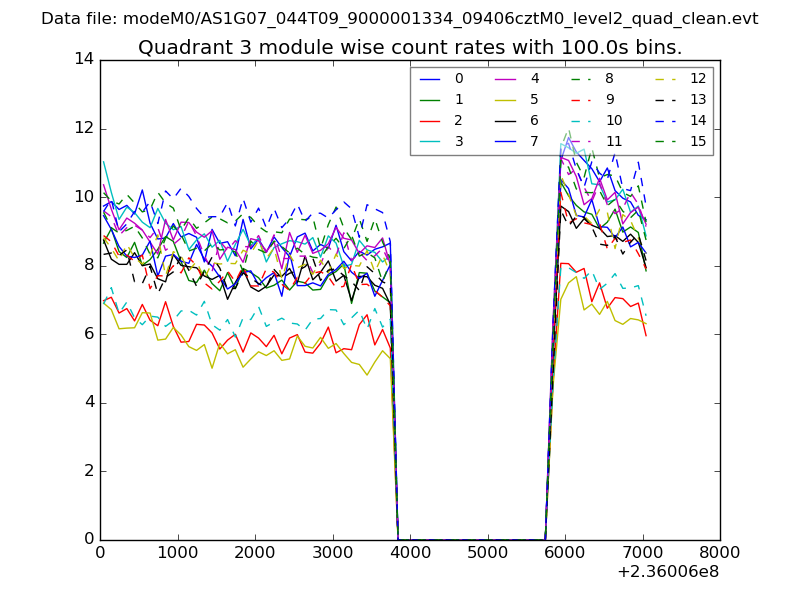
| Module-wise count rates for Quadrant C Data is divided into 100 sec bins |
 |
 |
| Module-wise count rates for Quadrant D Data is divided into 100 sec bins |
 |
 |
| Parameter | Plot |
|---|---|
| CZT HV Monitor | 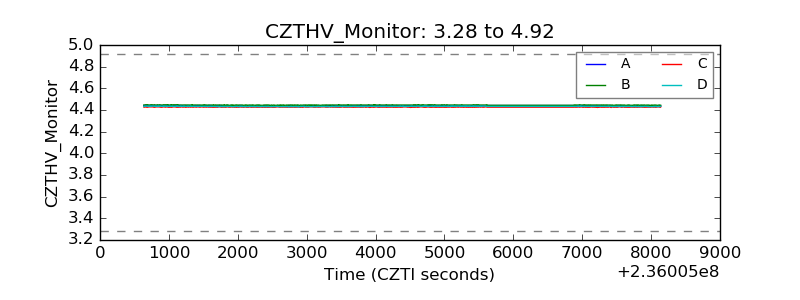 |
| D_VDD | 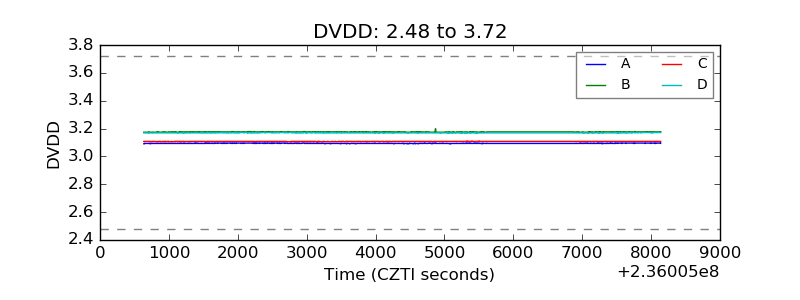 |
| Temperature 1 | 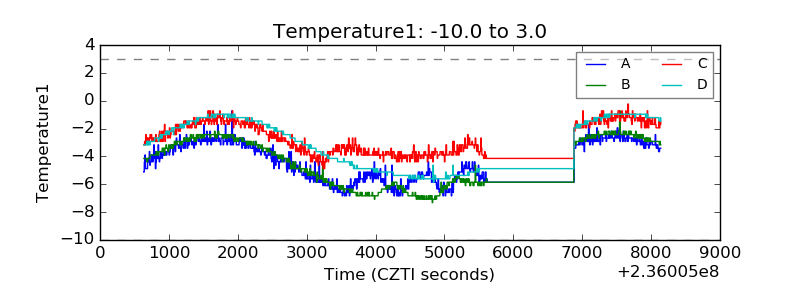 |
| Veto HV Monitor | 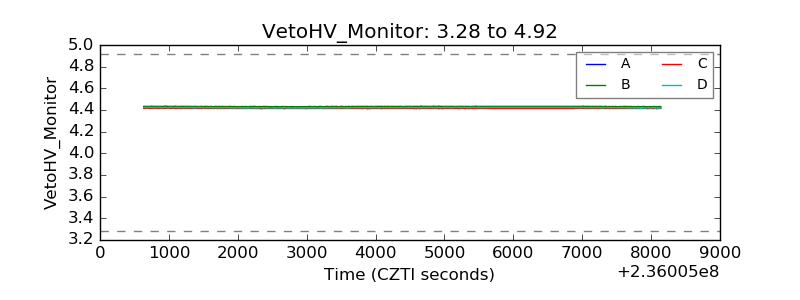 |
| Veto LLD |  |
| Alpha Counter | 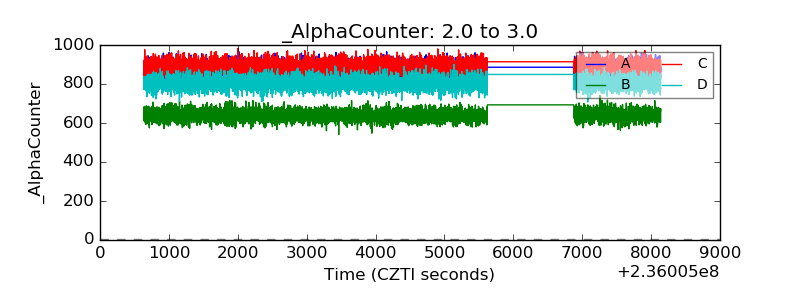 |
| _CPM_Rate | 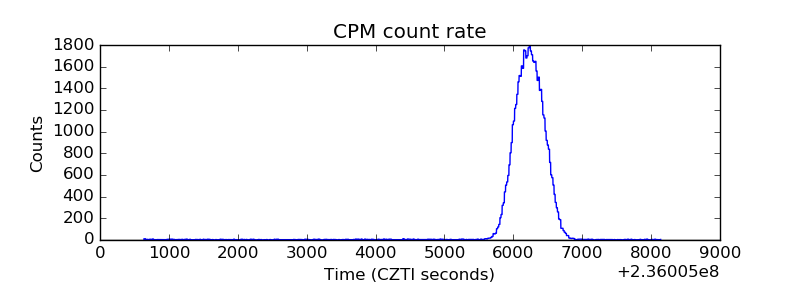 |
| CZT Counter | 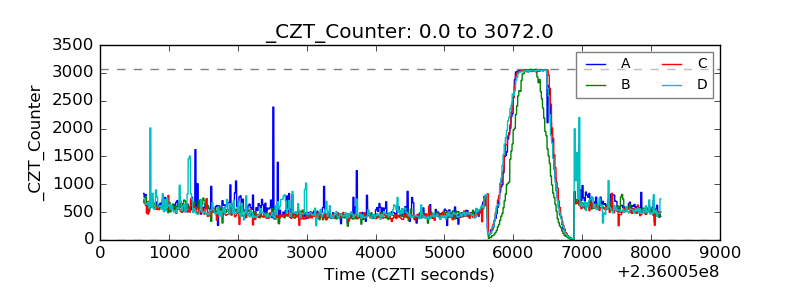 |
| +2.5 Volts monitor |  |
| +5 Volts monitor |  |
| _ROLL_ROT | 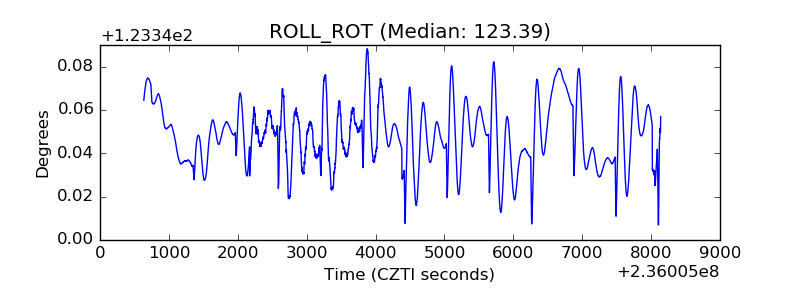 |
| _Roll_DEC | 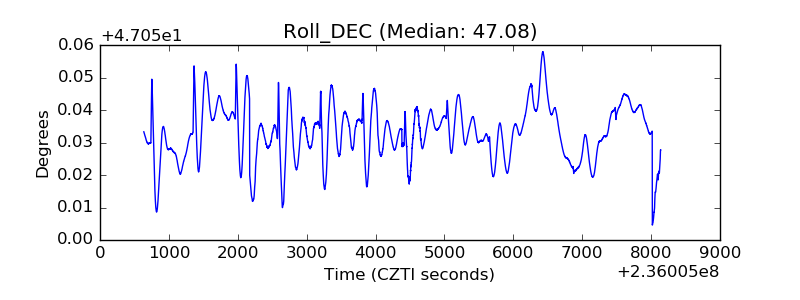 |
| _Roll_RA | 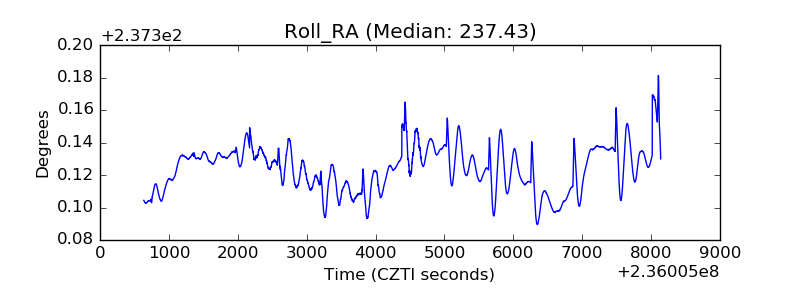 |
| Veto Counter | 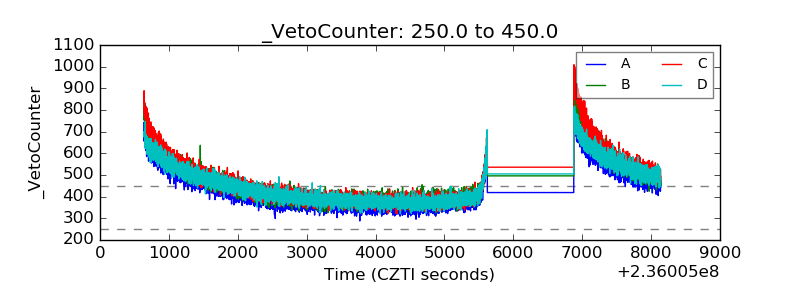 |