| Param | Original file | Final file |
|---|---|---|
| Filename | modeM0/AS1G07_044T09_9000001334_09407cztM0_level2.evt | modeM0/AS1G07_044T09_9000001334_09407cztM0_level2_quad_clean.evt |
| Size (bytes) | 452,203,200 | 109,889,280 |
| Size | 431.3 MB | 104.8 MB |
| Events in quadrant A | 3,799,410 | 723,282 |
| Events in quadrant B | 3,137,190 | 734,008 |
| Events in quadrant C | 3,125,847 | 732,410 |
| Events in quadrant D | 3,213,927 | 708,110 |
| Mode M0 | |||
|---|---|---|---|
| Quadrant | BADHDUFLAG | Total packets | Discarded packets |
| A | 0 | 15400 | 3 |
| B | 0 | 13491 | 2 |
| C | 0 | 13290 | 2 |
| D | 0 | 13652 | 2 |
| Mode M9 | |||
|---|---|---|---|
| Quadrant | BADHDUFLAG | Total packets | Discarded packets |
| A | 0 | 22 | 0 |
| B | 0 | 22 | 0 |
| C | 0 | 22 | 0 |
| D | 0 | 23 | 0 |
| Mode SS | |||
|---|---|---|---|
| Quadrant | BADHDUFLAG | Total packets | Discarded packets |
| A | 0 | 126 | 0 |
| B | 0 | 126 | 0 |
| C | 0 | 126 | 0 |
| D | 0 | 126 | 0 |
| Quadrant | Total seconds | Saturated seconds | Saturation percentage |
|---|---|---|---|
| A | 6163 | 75 | 1.216940% |
| B | 6163 | 52 | 0.843745% |
| C | 6163 | 79 | 1.281843% |
| D | 6163 | 76 | 1.233166% |
Noise dominated data is calculated using 1-second bins in cleaned event files. If a bin has >2000 counts, and if more than 50% of those come from <1% of pixels, then it is considered to be noise-dominated and hence unusable.
| Quadrant | # 1 sec bins | Bins with >0 counts | Bins with >2000 counts | High rate bins dominated by noise | Noise dominated (total time) | Noise dominated (detector-on time) | Marked lightcurve |
|---|---|---|---|---|---|---|---|
| A | 7468 | 6164 | 9 | 9 | 0.12% | 0.15% | 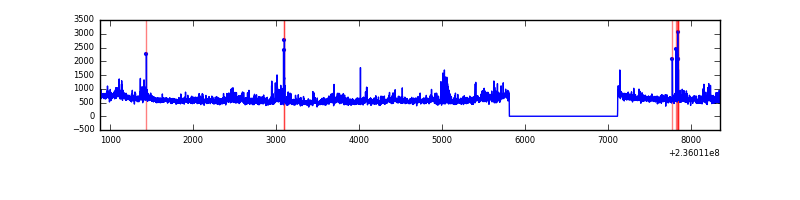 |
| B | 7468 | 6164 | 1 | 1 | 0.01% | 0.02% | 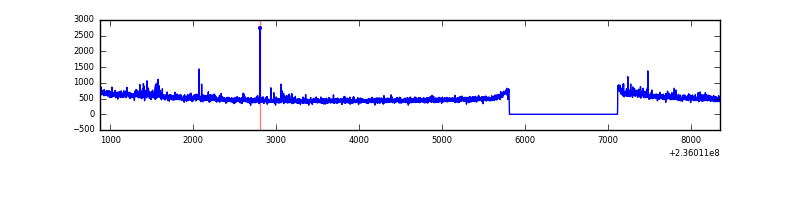 |
| C | 7468 | 6164 | 5 | 5 | 0.07% | 0.08% | 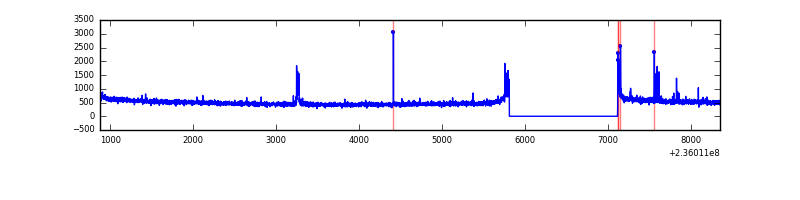 |
| D | 7468 | 6164 | 28 | 28 | 0.37% | 0.45% | 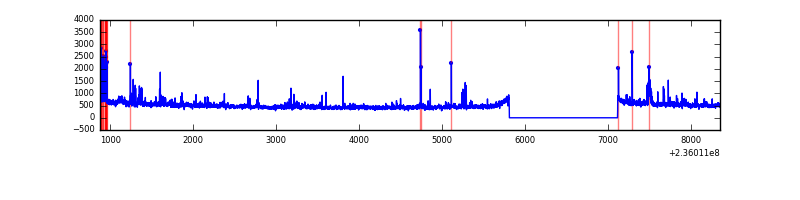 |
Top three noisy pixels from each quadrant. If the there are fewer than three noisy pixels in the level2.evt file, extra rows are filled as -1
| Pixel properties | Quadrant properties | ||||||
|---|---|---|---|---|---|---|---|
| Quadrant | DetID | PixID | Counts | Sigma | Mean | Median | Sigma |
| A | 8 | 5 | 690958 | 4397.32 | 783 | 769 | 157.0 |
| A | 5 | 16 | 40501 | 253.14 | 783 | 769 | 157.0 |
| A | 13 | 251 | 18750 | 114.56 | 783 | 769 | 157.0 |
| B | 0 | 214 | 61602 | 420.22 | 781 | 763 | 144.8 |
| B | 0 | 219 | 29920 | 201.39 | 781 | 763 | 144.8 |
| B | 12 | 111 | 14988 | 98.25 | 781 | 763 | 144.8 |
| C | 4 | 254 | 76258 | 428.41 | 773 | 778 | 176.2 |
| C | 10 | 22 | 32450 | 179.76 | 773 | 778 | 176.2 |
| C | 13 | 61 | 5678 | 27.81 | 773 | 778 | 176.2 |
| D | 12 | 227 | 101245 | 534.96 | 770 | 754 | 187.8 |
| D | 7 | 55 | 33793 | 175.88 | 770 | 754 | 187.8 |
| D | 8 | 195 | 29704 | 154.11 | 770 | 754 | 187.8 |
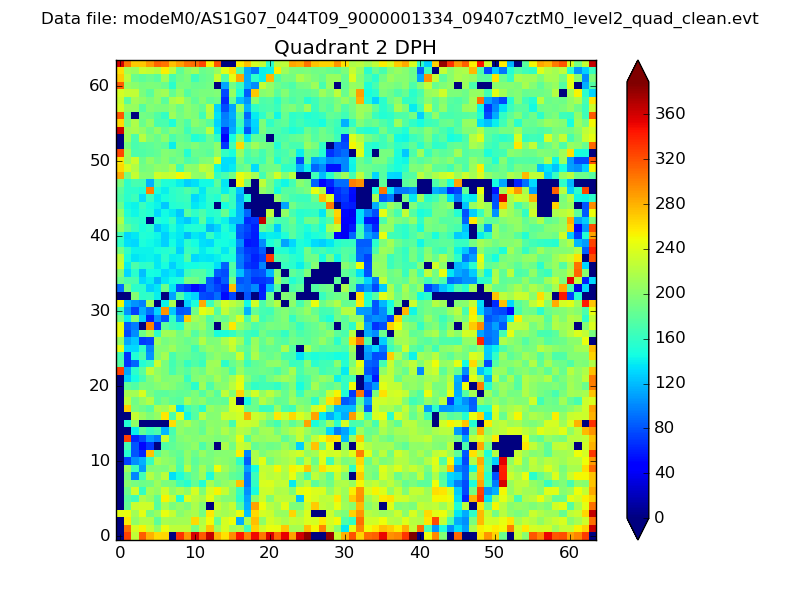
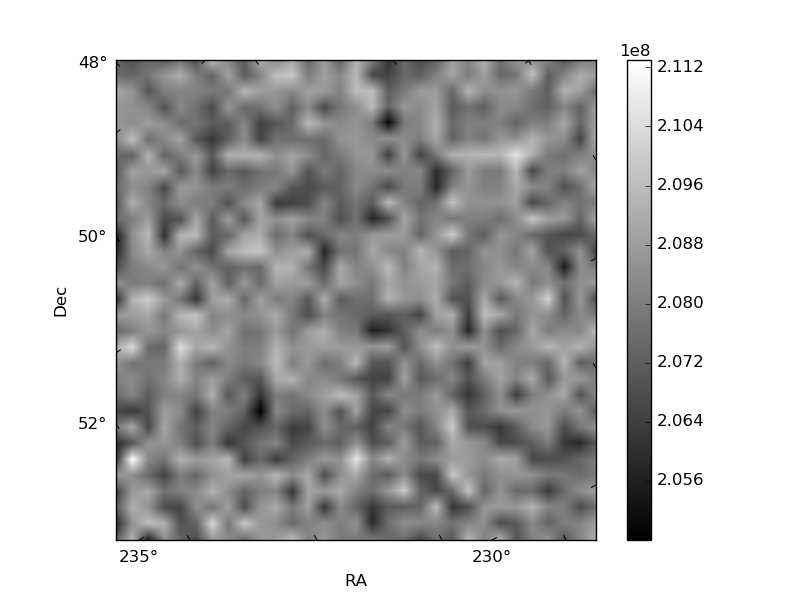
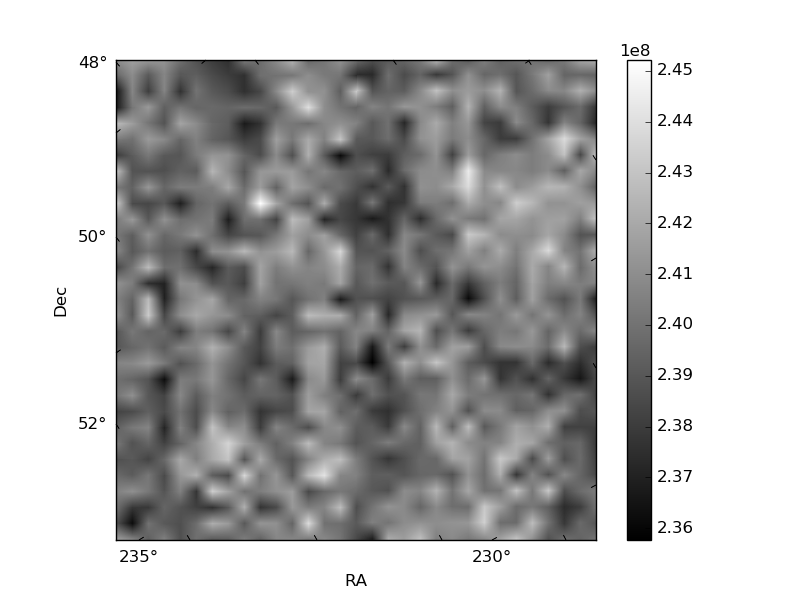
Histogram calculated using DETX and DETY for each event in the final _common_clean file
| Quadrant A | 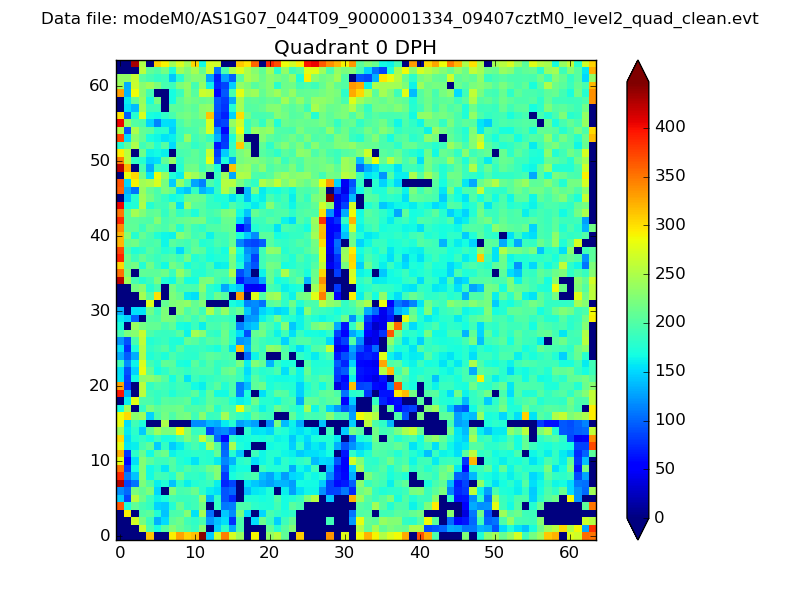 |
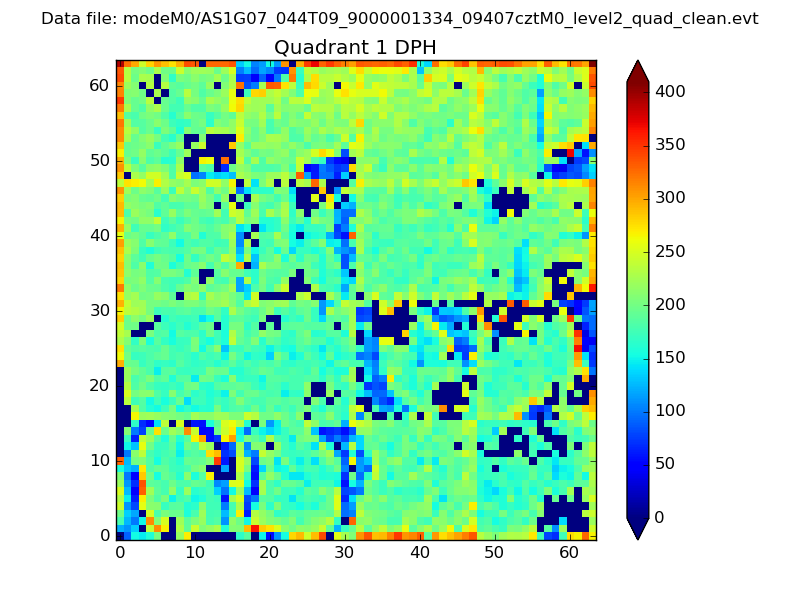 |
Quadrant B |
|---|---|---|---|
| Quadrant D | 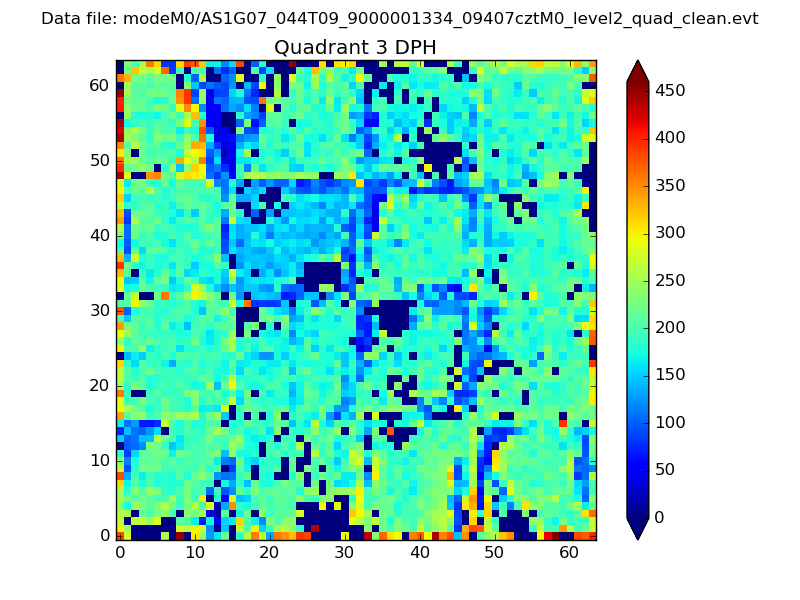 |
 |
Quadrant C |
| Plot type | Count rate plots | Images |
|---|---|---|
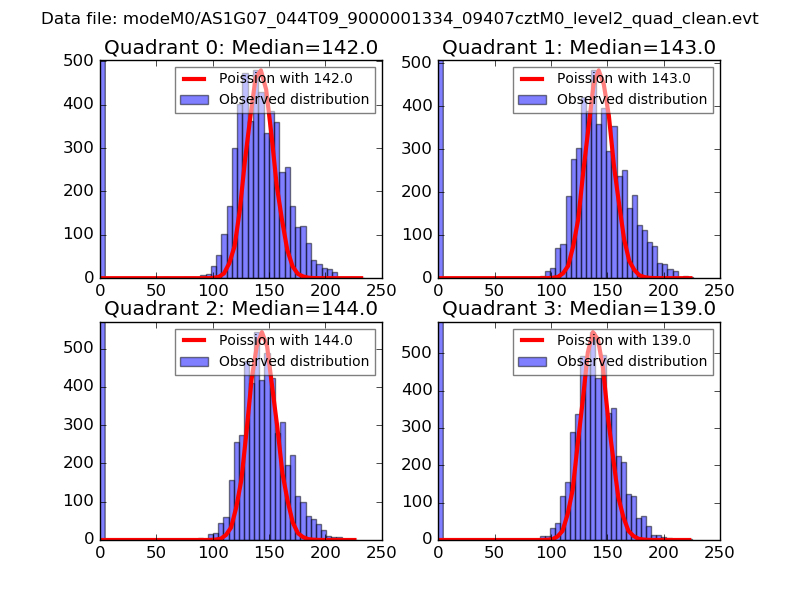
| Comparison with Poisson distribution Blue bars denote a histogram of data divided into 1 sec bins. Red curve is a Poisson curve with rate = median count rate of data. |
 |
 |
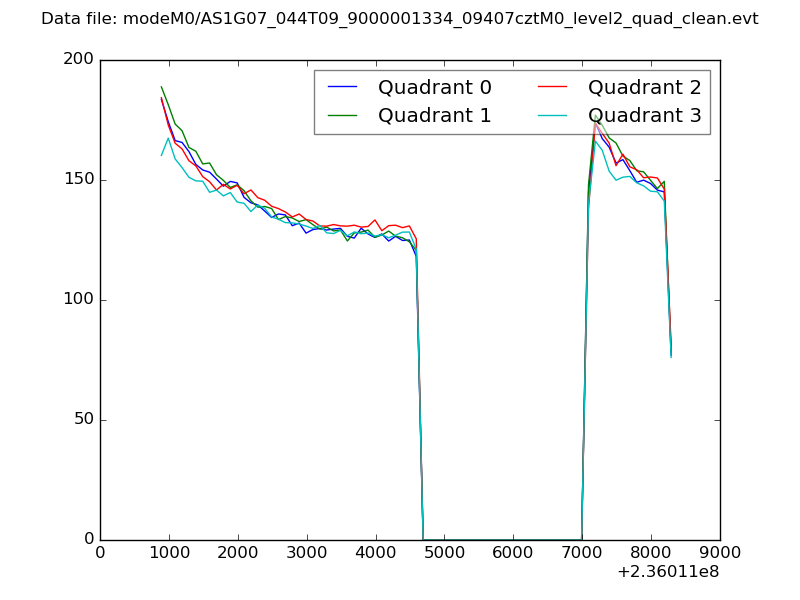
| Quadrant-wise count rates Data is divided into 100 sec bins |
 |
|
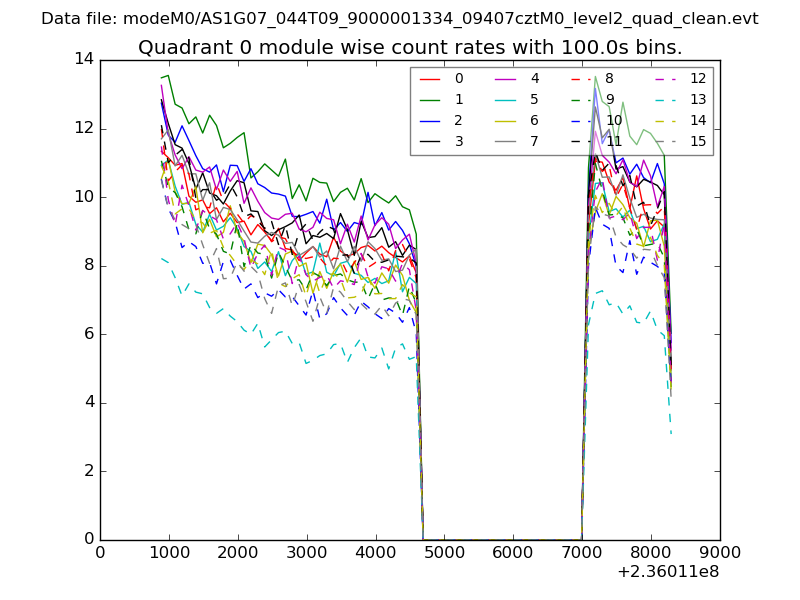
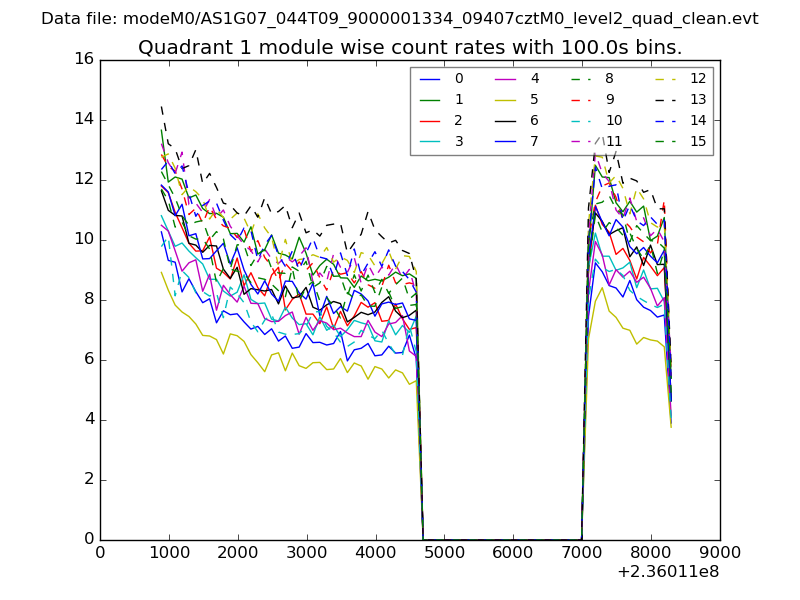
| Module-wise count rates for Quadrant A Data is divided into 100 sec bins |
 |
 |
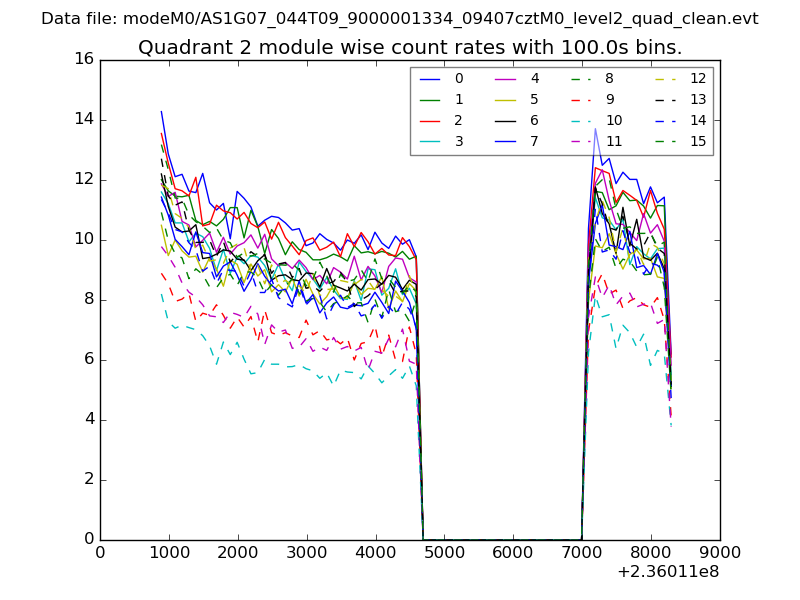
| Module-wise count rates for Quadrant B Data is divided into 100 sec bins |
 |
 |
| Module-wise count rates for Quadrant C Data is divided into 100 sec bins |
 |
 |
| Module-wise count rates for Quadrant D Data is divided into 100 sec bins |
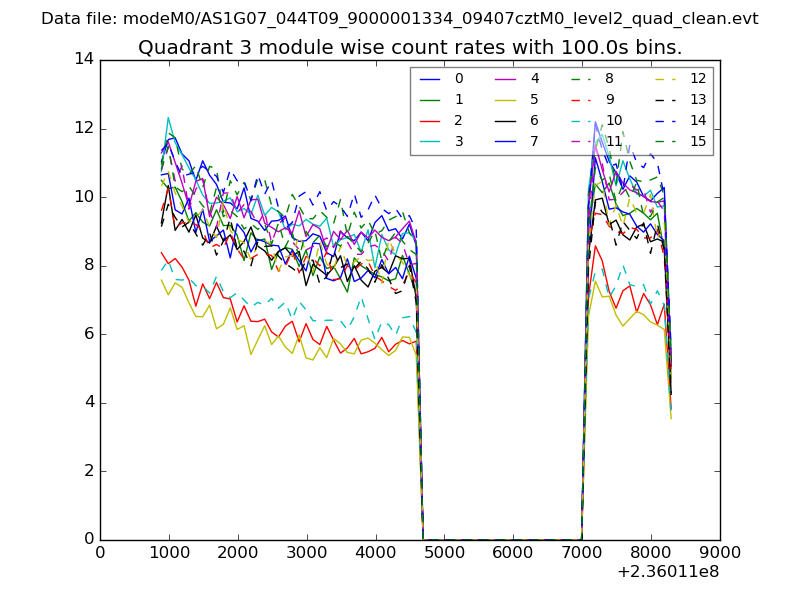 |
 |
| Parameter | Plot |
|---|---|
| CZT HV Monitor | 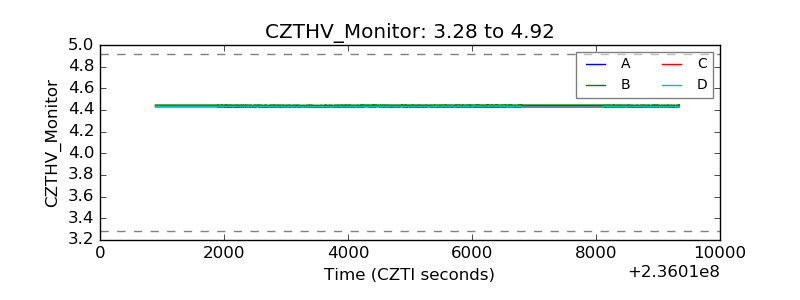 |
| D_VDD | 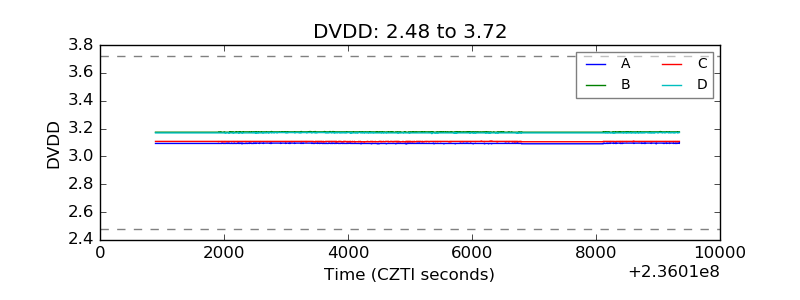 |
| Temperature 1 | 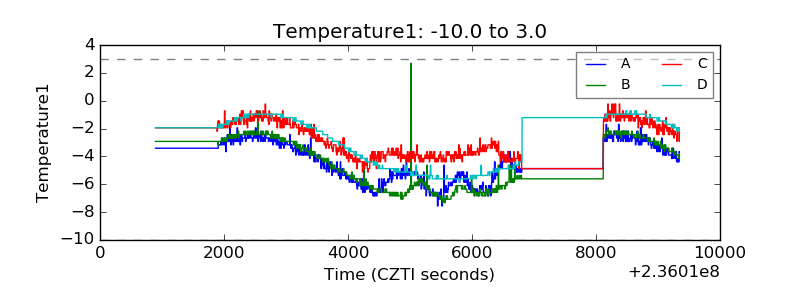 |
| Veto HV Monitor | 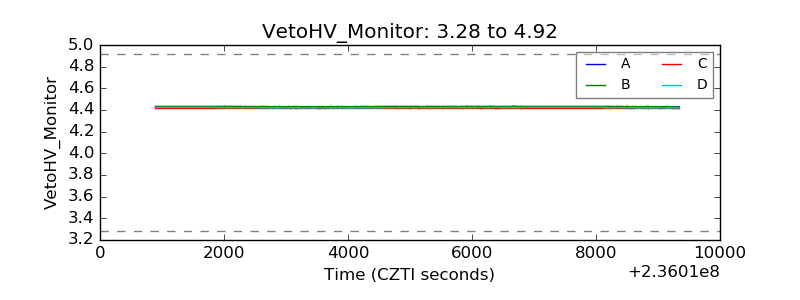 |
| Veto LLD | 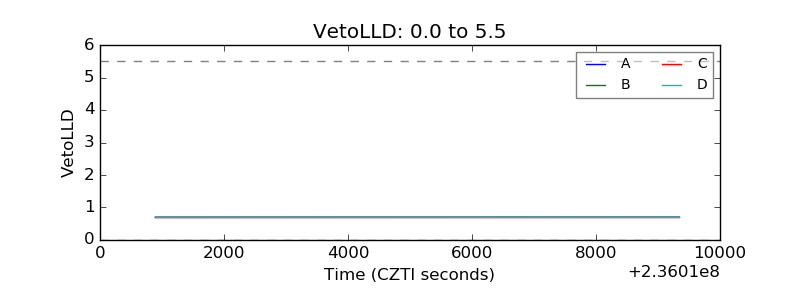 |
| Alpha Counter | 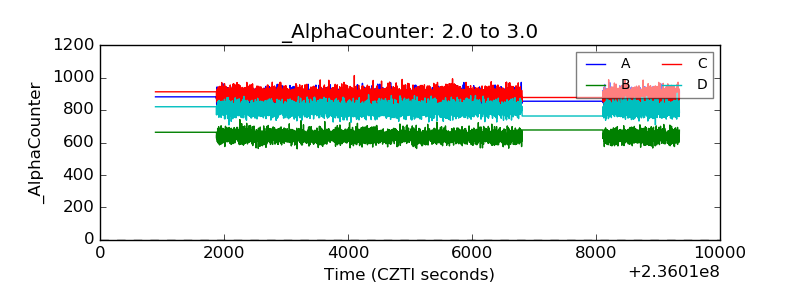 |
| _CPM_Rate | 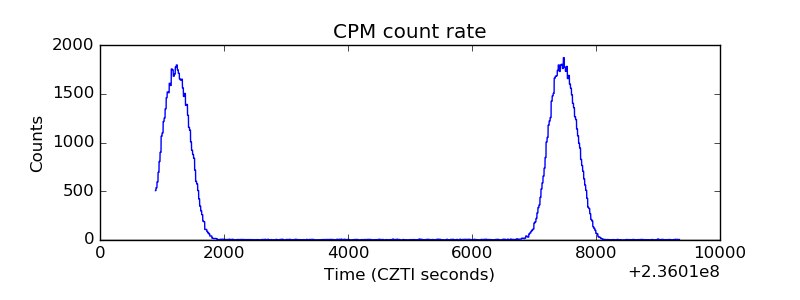 |
| CZT Counter | 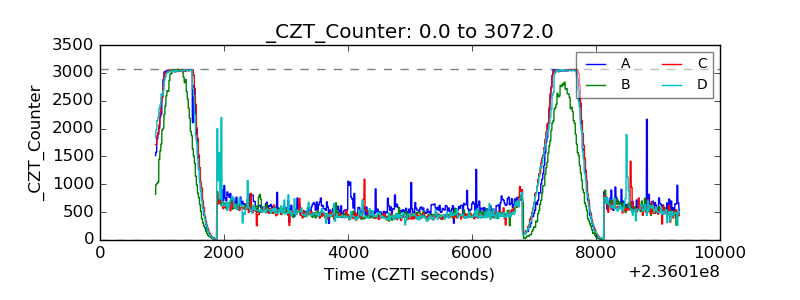 |
| +2.5 Volts monitor |  |
| +5 Volts monitor |  |
| _ROLL_ROT | 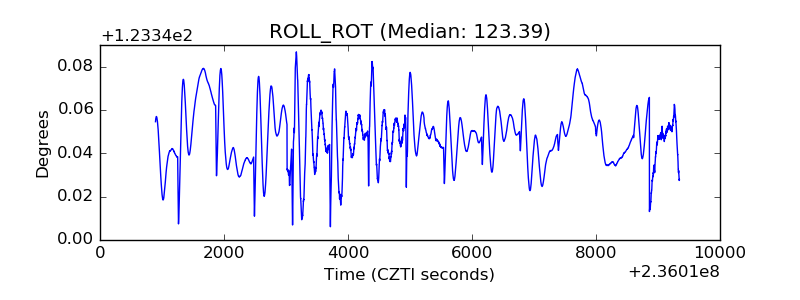 |
| _Roll_DEC | 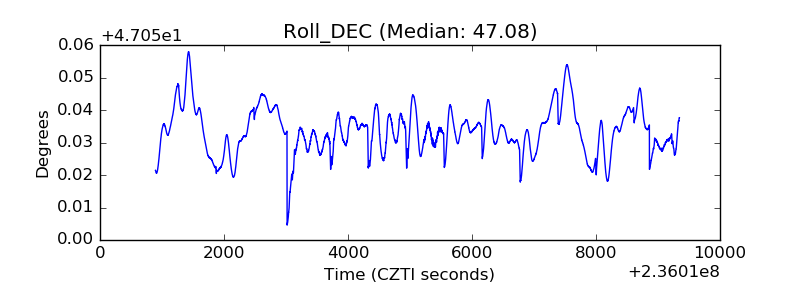 |
| _Roll_RA | 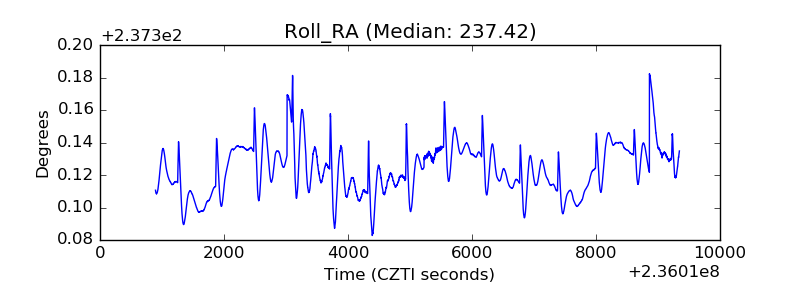 |
| Veto Counter | 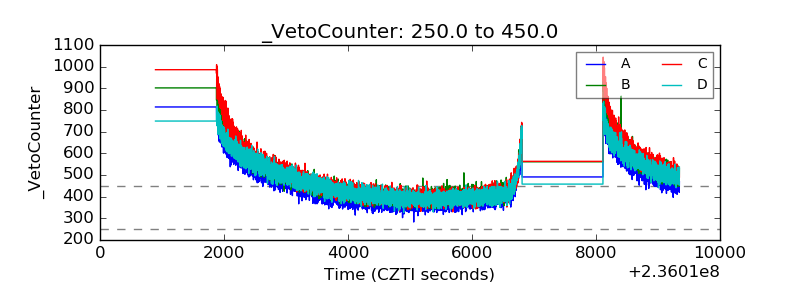 |