| Param | Original file | Final file |
|---|---|---|
| Filename | modeM0/AS1G07_044T09_9000001334_09409cztM0_level2.evt | modeM0/AS1G07_044T09_9000001334_09409cztM0_level2_quad_clean.evt |
| Size (bytes) | 699,220,800 | 142,015,680 |
| Size | 666.8 MB | 135.4 MB |
| Events in quadrant A | 6,046,854 | 886,008 |
| Events in quadrant B | 4,868,835 | 901,955 |
| Events in quadrant C | 4,768,505 | 918,430 |
| Events in quadrant D | 4,799,311 | 887,231 |
| Mode M0 | |||
|---|---|---|---|
| Quadrant | BADHDUFLAG | Total packets | Discarded packets |
| A | 0 | 24700 | 3 |
| B | 0 | 21279 | 2 |
| C | 0 | 21087 | 2 |
| D | 0 | 21466 | 2 |
| Mode M9 | |||
|---|---|---|---|
| Quadrant | BADHDUFLAG | Total packets | Discarded packets |
| A | 0 | 25 | 0 |
| B | 0 | 25 | 0 |
| C | 0 | 25 | 0 |
| D | 0 | 25 | 0 |
| Mode SS | |||
|---|---|---|---|
| Quadrant | BADHDUFLAG | Total packets | Discarded packets |
| A | 0 | 208 | 0 |
| B | 0 | 208 | 0 |
| C | 0 | 208 | 0 |
| D | 0 | 208 | 0 |
| Quadrant | Total seconds | Saturated seconds | Saturation percentage |
|---|---|---|---|
| A | 10215 | 204 | 1.997063% |
| B | 10215 | 107 | 1.047479% |
| C | 10215 | 107 | 1.047479% |
| D | 10215 | 97 | 0.949584% |
Noise dominated data is calculated using 1-second bins in cleaned event files. If a bin has >2000 counts, and if more than 50% of those come from <1% of pixels, then it is considered to be noise-dominated and hence unusable.
| Quadrant | # 1 sec bins | Bins with >0 counts | Bins with >2000 counts | High rate bins dominated by noise | Noise dominated (total time) | Noise dominated (detector-on time) | Marked lightcurve |
|---|---|---|---|---|---|---|---|
| A | 12755 | 10217 | 66 | 66 | 0.52% | 0.65% | 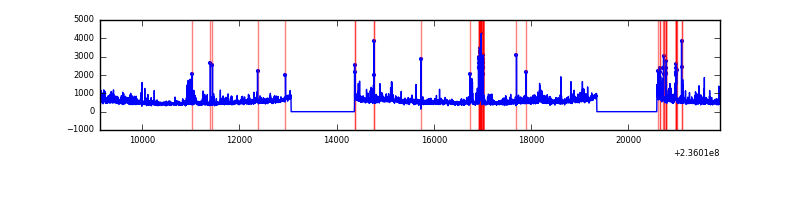 |
| B | 12755 | 10217 | 0 | 0 | 0.00% | 0.00% | 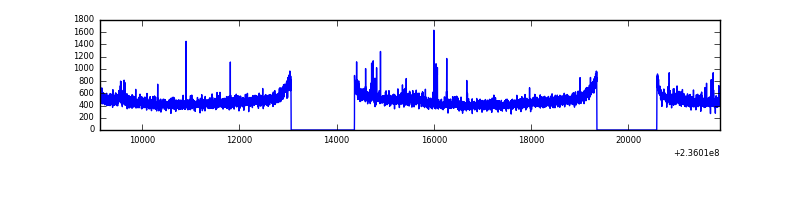 |
| C | 12755 | 10217 | 0 | 0 | 0.00% | 0.00% | 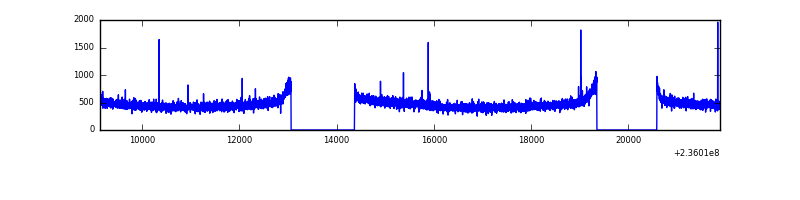 |
| D | 12755 | 10217 | 4 | 4 | 0.03% | 0.04% | 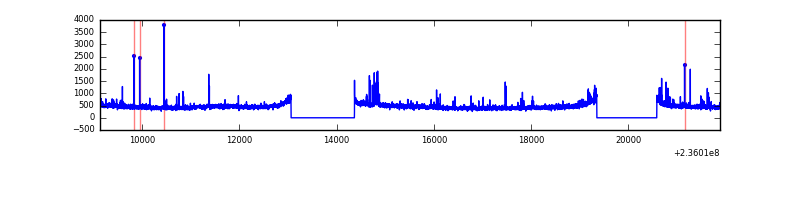 |
Top three noisy pixels from each quadrant. If the there are fewer than three noisy pixels in the level2.evt file, extra rows are filled as -1
| Pixel properties | Quadrant properties | ||||||
|---|---|---|---|---|---|---|---|
| Quadrant | DetID | PixID | Counts | Sigma | Mean | Median | Sigma |
| A | 8 | 5 | 1000933 | 4110.97 | 1212 | 1186 | 243.2 |
| A | 5 | 16 | 202873 | 829.34 | 1212 | 1186 | 243.2 |
| A | 4 | 2 | 51173 | 205.55 | 1212 | 1186 | 243.2 |
| B | 0 | 219 | 53944 | 229.27 | 1226 | 1192 | 230.1 |
| B | 0 | 214 | 26116 | 108.32 | 1226 | 1192 | 230.1 |
| B | 12 | 111 | 24669 | 102.04 | 1226 | 1192 | 230.1 |
| C | 4 | 254 | 12026 | 39.22 | 1214 | 1221 | 275.5 |
| C | 10 | 22 | 11415 | 37.0 | 1214 | 1221 | 275.5 |
| C | 13 | 61 | 9011 | 28.27 | 1214 | 1221 | 275.5 |
| D | 1 | 52 | 63399 | 214.79 | 1198 | 1172 | 289.7 |
| D | 7 | 55 | 54205 | 183.05 | 1198 | 1172 | 289.7 |
| D | 2 | 234 | 39805 | 133.35 | 1198 | 1172 | 289.7 |
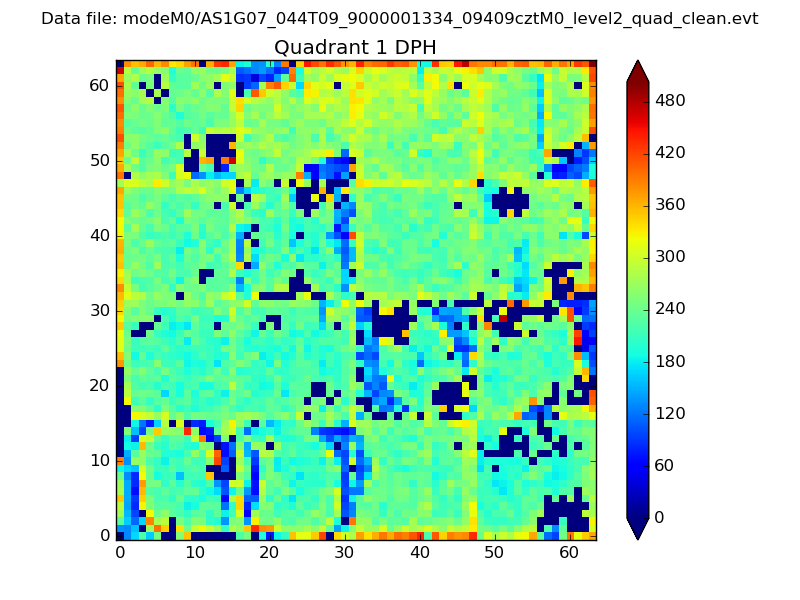
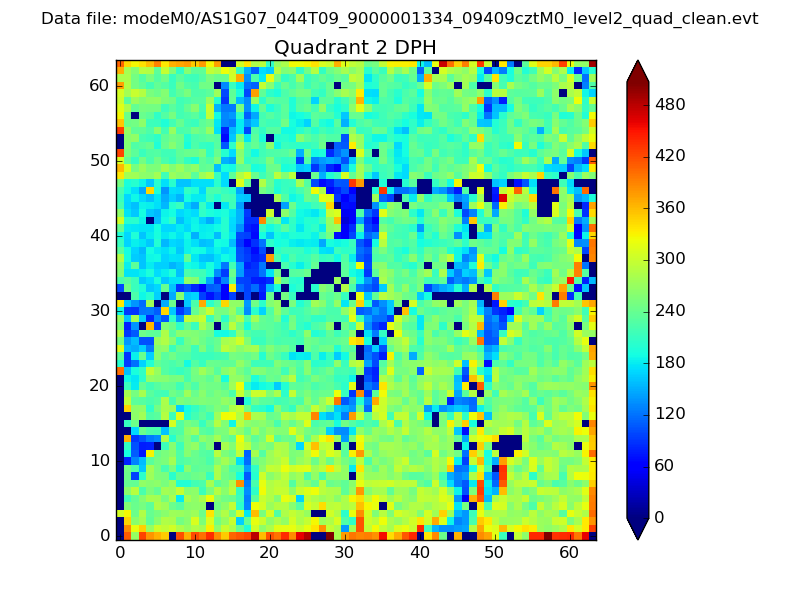
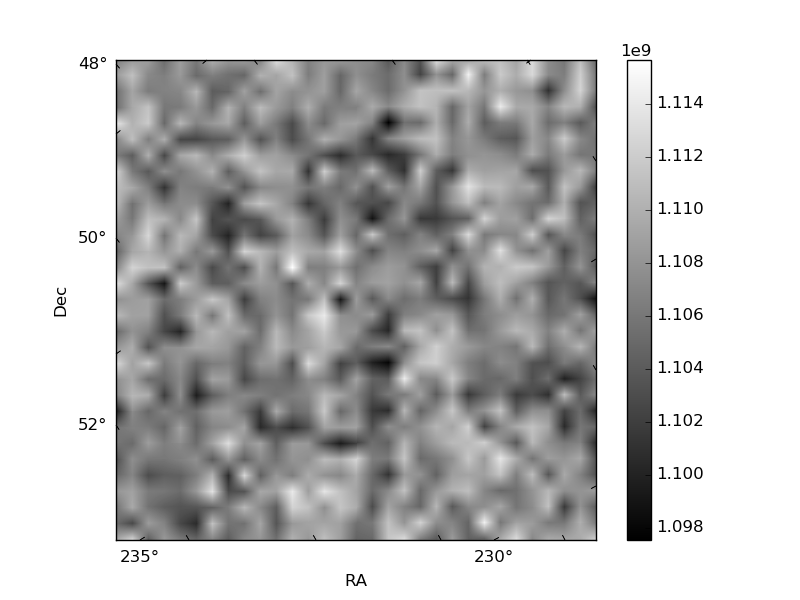
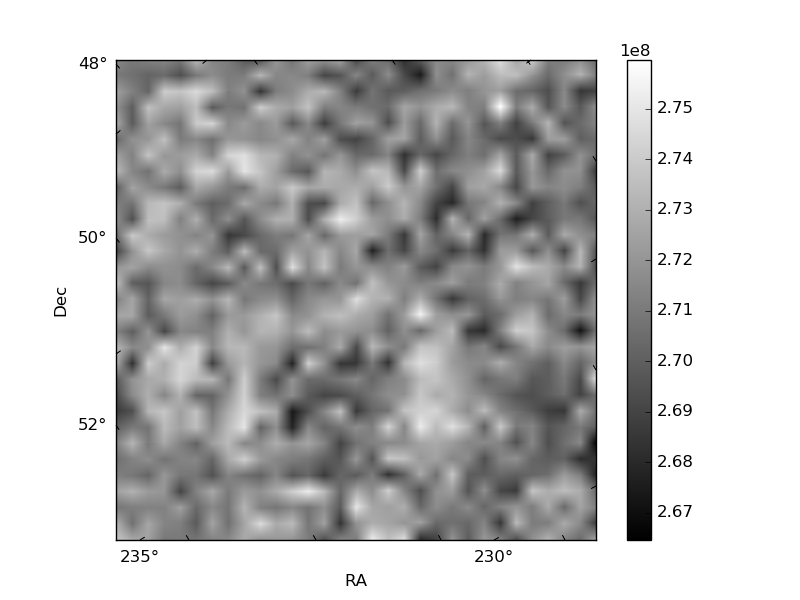
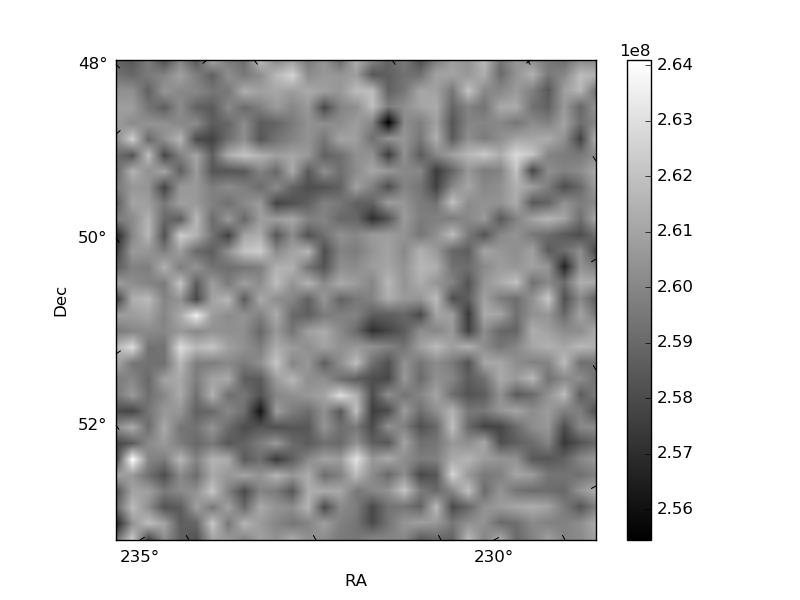
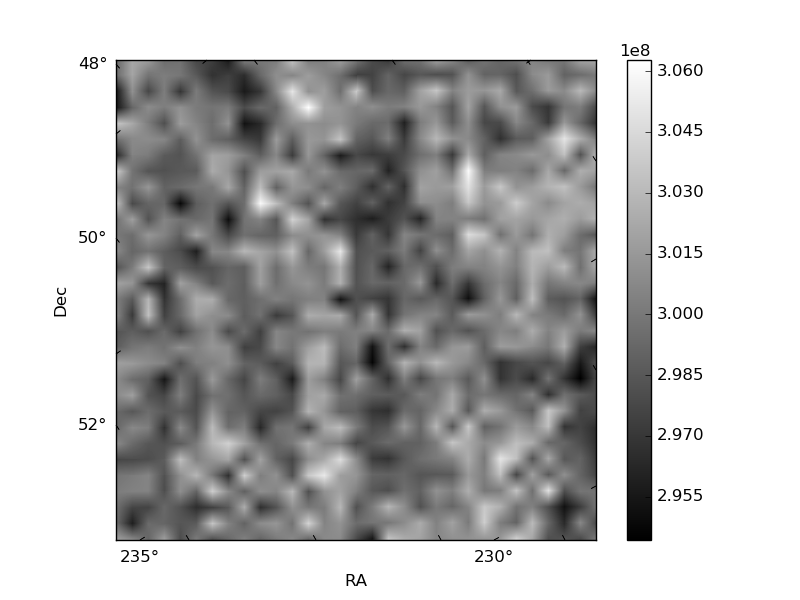
Histogram calculated using DETX and DETY for each event in the final _common_clean file
| Quadrant A |  |
 |
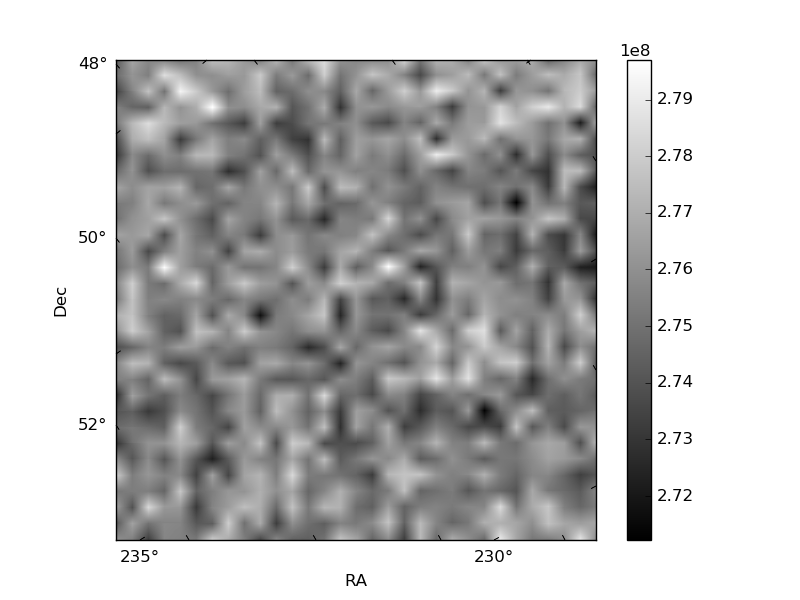
Quadrant B |
|---|---|---|---|
| Quadrant D | 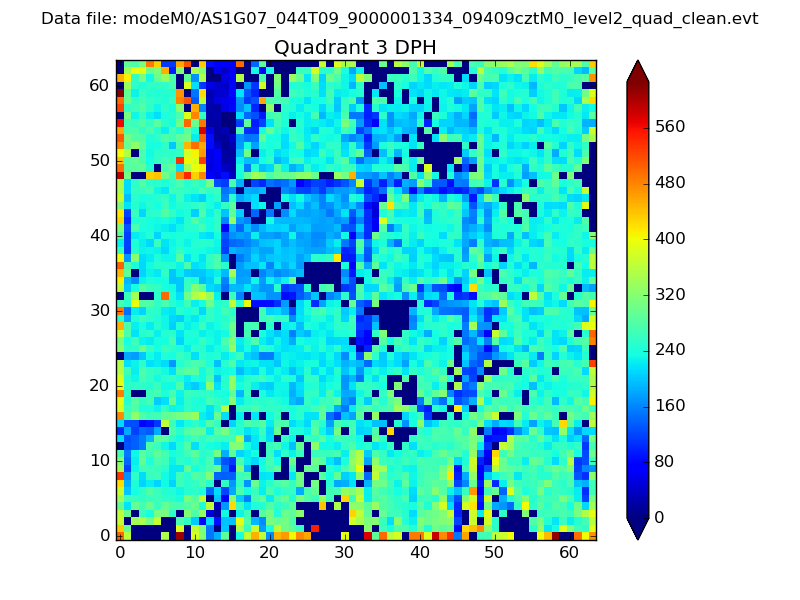 |
 |
Quadrant C |
| Plot type | Count rate plots | Images |
|---|---|---|
| Comparison with Poisson distribution Blue bars denote a histogram of data divided into 1 sec bins. Red curve is a Poisson curve with rate = median count rate of data. |
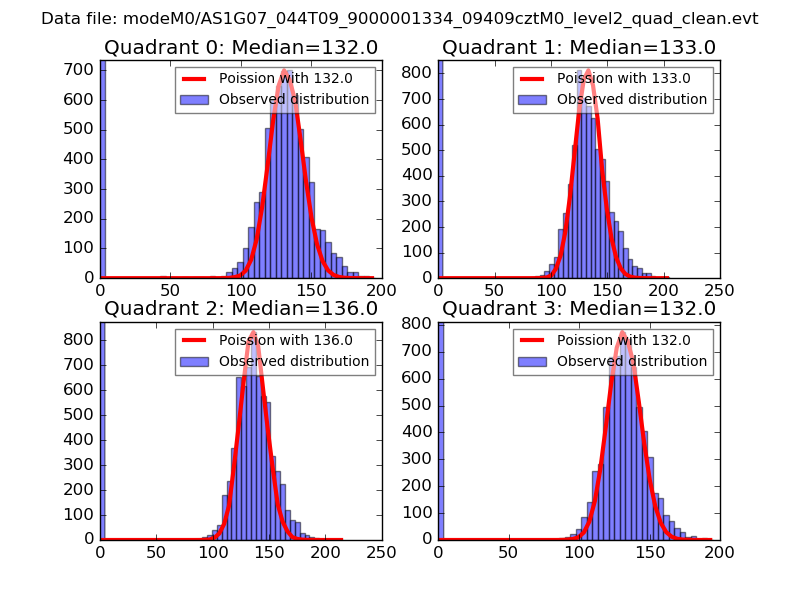 |
 |
| Quadrant-wise count rates Data is divided into 100 sec bins |
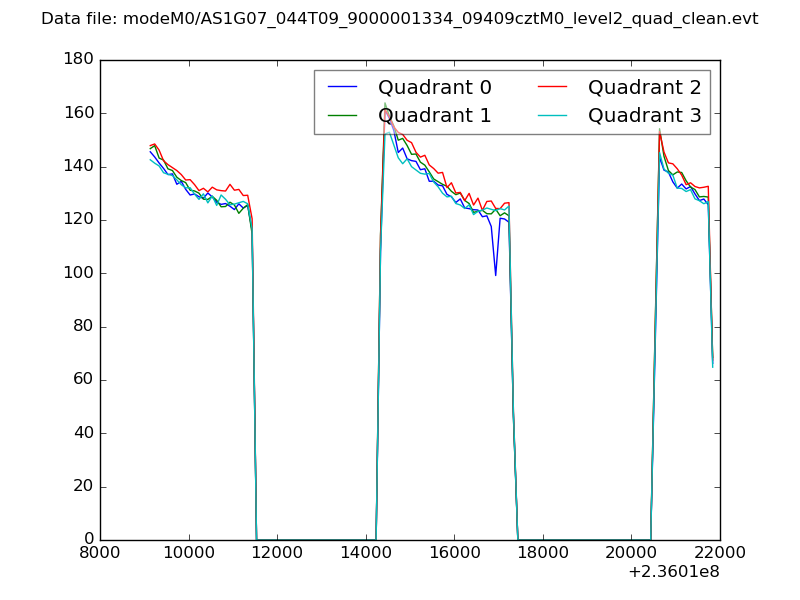 |
|
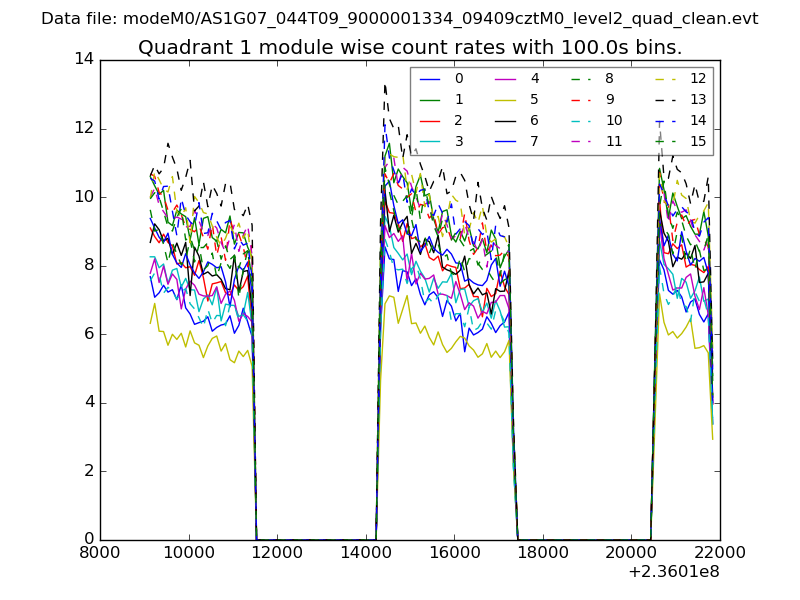
| Module-wise count rates for Quadrant A Data is divided into 100 sec bins |
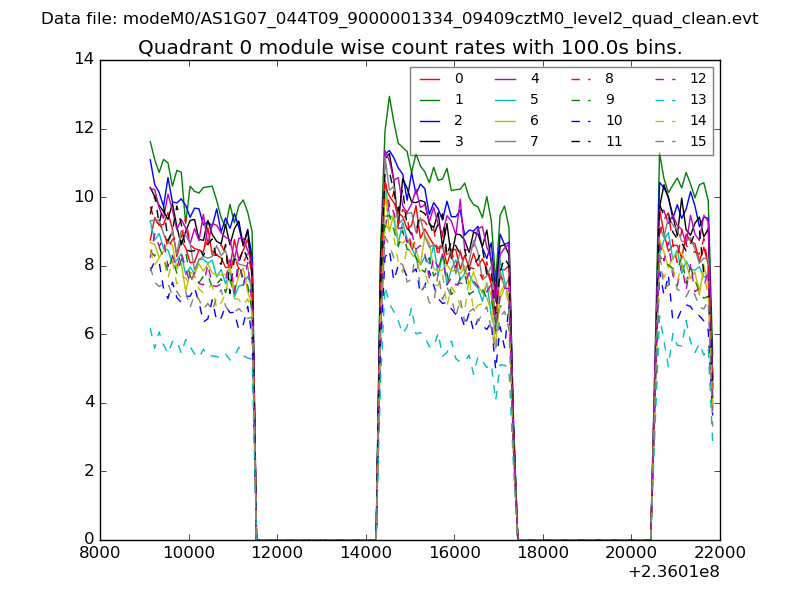 |
 |
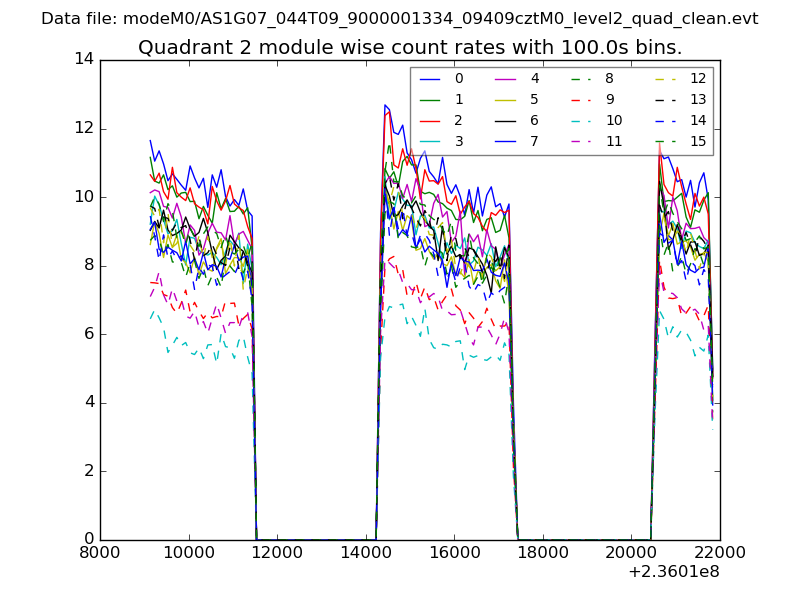
| Module-wise count rates for Quadrant B Data is divided into 100 sec bins |
 |
 |
| Module-wise count rates for Quadrant C Data is divided into 100 sec bins |
 |
 |
| Module-wise count rates for Quadrant D Data is divided into 100 sec bins |
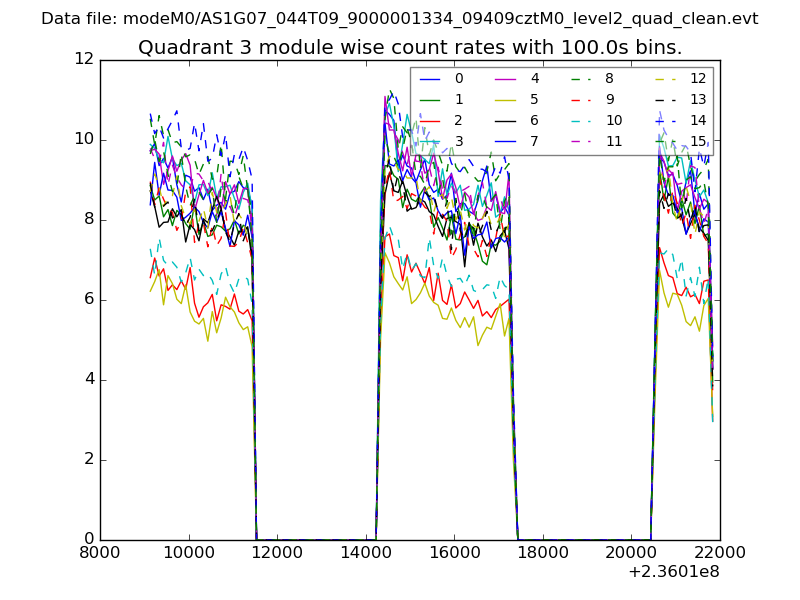 |
 |
| Parameter | Plot |
|---|---|
| CZT HV Monitor | 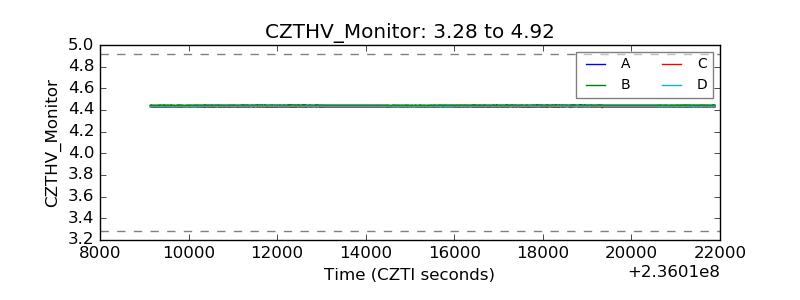 |
| D_VDD | 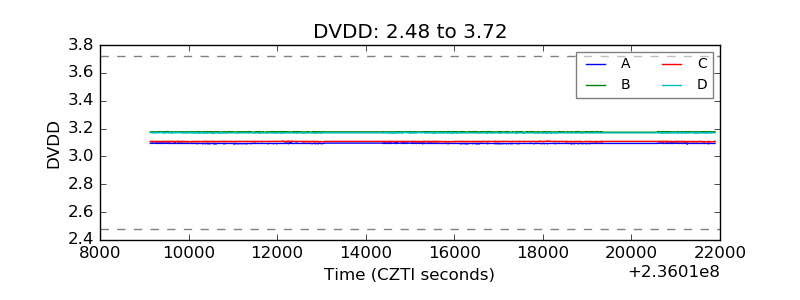 |
| Temperature 1 | 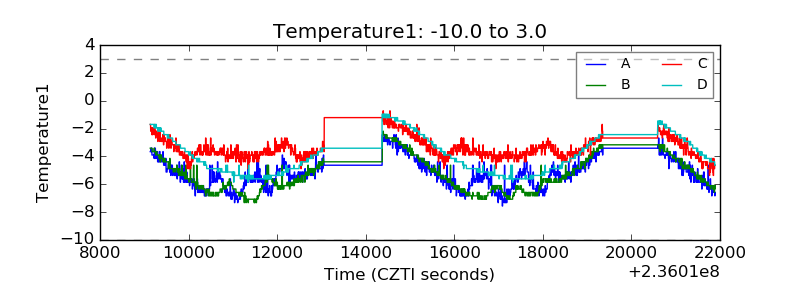 |
| Veto HV Monitor | 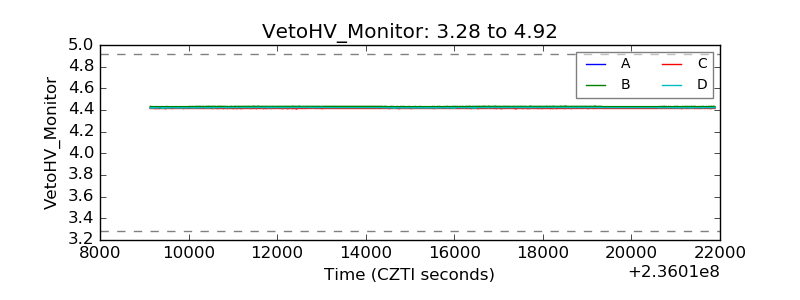 |
| Veto LLD | 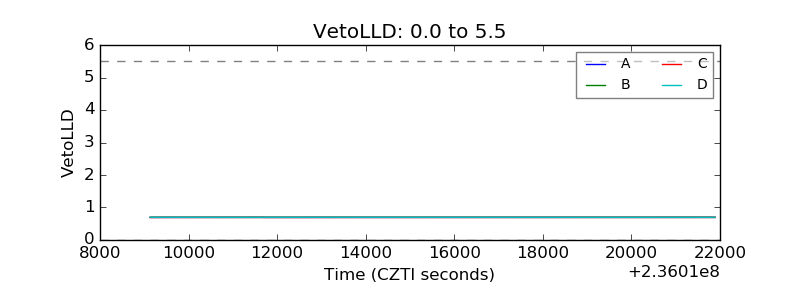 |
| Alpha Counter |  |
| _CPM_Rate | 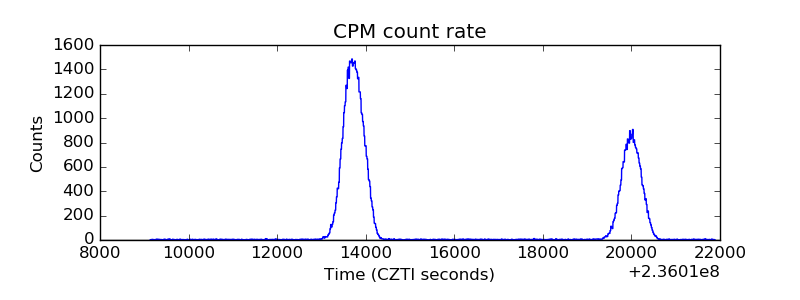 |
| CZT Counter | 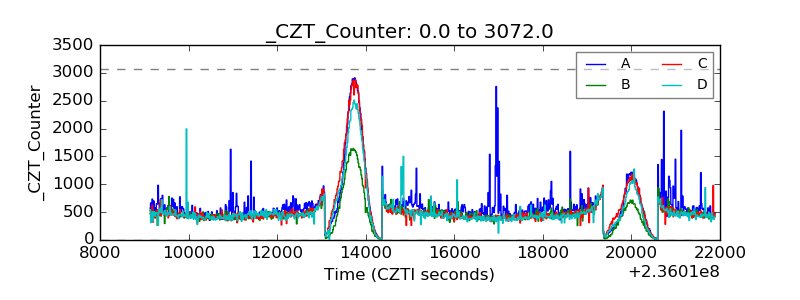 |
| +2.5 Volts monitor |  |
| +5 Volts monitor |  |
| _ROLL_ROT | 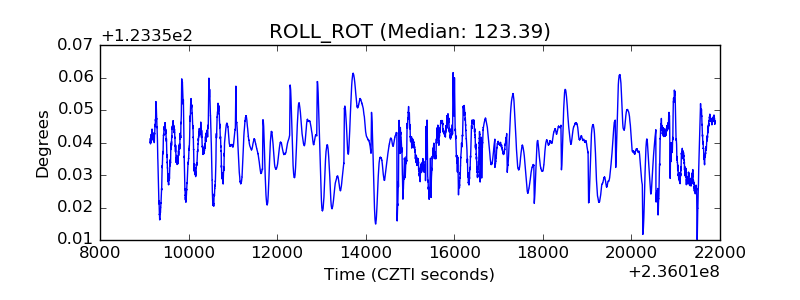 |
| _Roll_DEC | 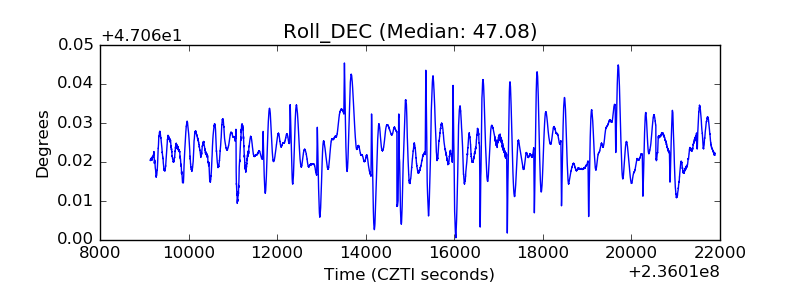 |
| _Roll_RA | 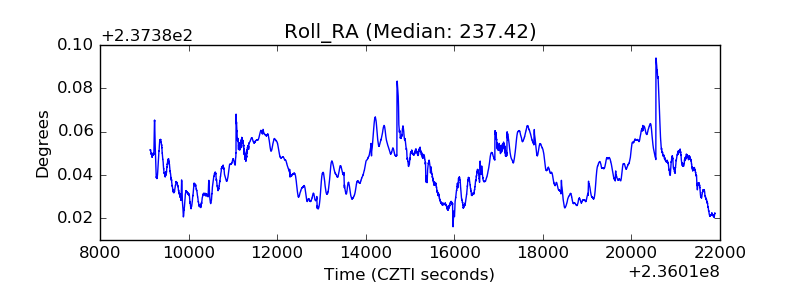 |
| Veto Counter | 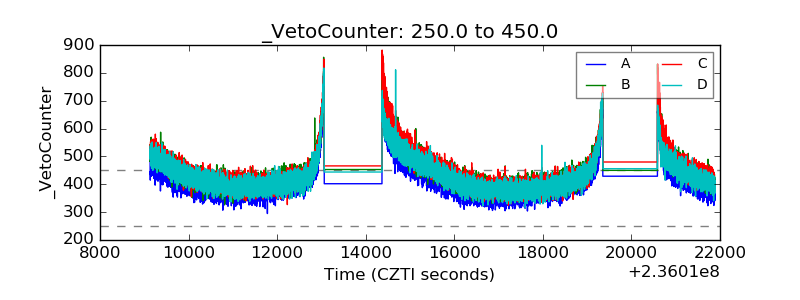 |