| Param | Original file | Final file |
|---|---|---|
| Filename | modeM0/AS1G07_044T09_9000001334_09410cztM0_level2.evt | modeM0/AS1G07_044T09_9000001334_09410cztM0_level2_quad_clean.evt |
| Size (bytes) | 457,652,160 | 92,580,480 |
| Size | 436.5 MB | 88.3 MB |
| Events in quadrant A | 4,234,548 | 577,415 |
| Events in quadrant B | 3,093,584 | 590,602 |
| Events in quadrant C | 3,058,094 | 594,382 |
| Events in quadrant D | 3,023,450 | 579,184 |
| Mode M0 | |||
|---|---|---|---|
| Quadrant | BADHDUFLAG | Total packets | Discarded packets |
| A | 0 | 17069 | 3 |
| B | 0 | 13774 | 2 |
| C | 0 | 13699 | 2 |
| D | 0 | 13838 | 2 |
| Mode M9 | |||
|---|---|---|---|
| Quadrant | BADHDUFLAG | Total packets | Discarded packets |
| A | 0 | 18 | 0 |
| B | 0 | 18 | 0 |
| C | 0 | 18 | 0 |
| D | 0 | 19 | 0 |
| Mode SS | |||
|---|---|---|---|
| Quadrant | BADHDUFLAG | Total packets | Discarded packets |
| A | 0 | 136 | 0 |
| B | 0 | 136 | 0 |
| C | 0 | 136 | 0 |
| D | 0 | 136 | 0 |
| Quadrant | Total seconds | Saturated seconds | Saturation percentage |
|---|---|---|---|
| A | 6622 | 180 | 2.718212% |
| B | 6622 | 37 | 0.558744% |
| C | 6622 | 42 | 0.634249% |
| D | 6622 | 14 | 0.211416% |
Noise dominated data is calculated using 1-second bins in cleaned event files. If a bin has >2000 counts, and if more than 50% of those come from <1% of pixels, then it is considered to be noise-dominated and hence unusable.
| Quadrant | # 1 sec bins | Bins with >0 counts | Bins with >2000 counts | High rate bins dominated by noise | Noise dominated (total time) | Noise dominated (detector-on time) | Marked lightcurve |
|---|---|---|---|---|---|---|---|
| A | 7617 | 6623 | 117 | 117 | 1.54% | 1.77% | 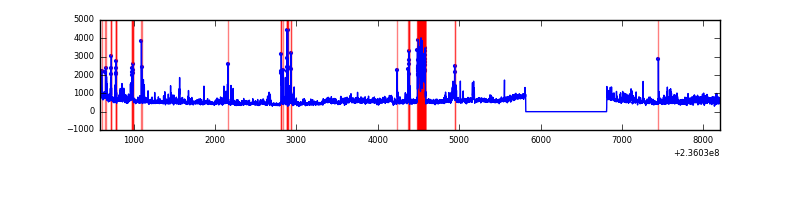 |
| B | 7617 | 6623 | 1 | 1 | 0.01% | 0.02% | 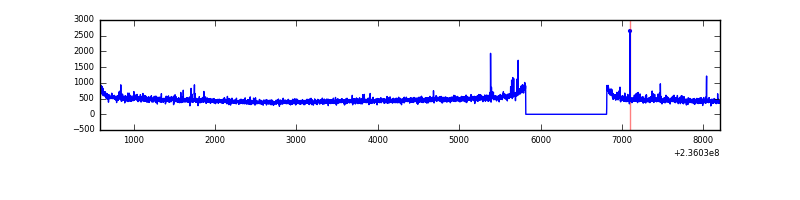 |
| C | 7617 | 6623 | 8 | 8 | 0.11% | 0.12% | 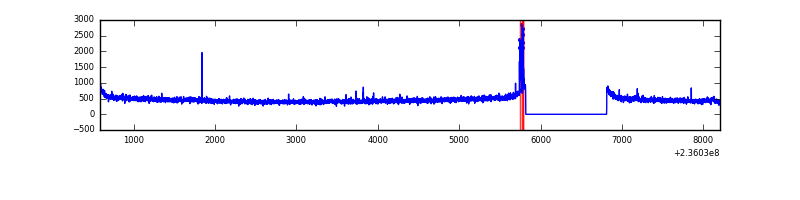 |
| D | 7617 | 6623 | 1 | 1 | 0.01% | 0.02% | 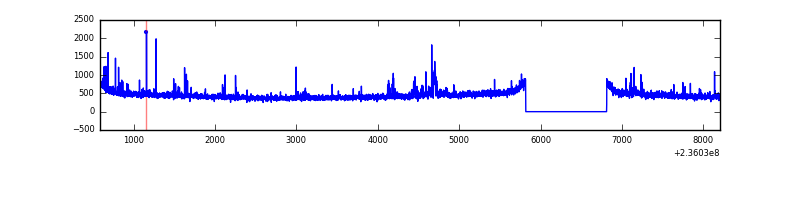 |
Top three noisy pixels from each quadrant. If the there are fewer than three noisy pixels in the level2.evt file, extra rows are filled as -1
| Pixel properties | Quadrant properties | ||||||
|---|---|---|---|---|---|---|---|
| Quadrant | DetID | PixID | Counts | Sigma | Mean | Median | Sigma |
| A | 8 | 5 | 907594 | 5892.81 | 762 | 744 | 153.9 |
| A | 4 | 2 | 335651 | 2176.26 | 762 | 744 | 153.9 |
| A | 1 | 162 | 20599 | 129.02 | 762 | 744 | 153.9 |
| B | 0 | 214 | 26514 | 175.75 | 776 | 755 | 146.6 |
| B | 12 | 111 | 16274 | 105.88 | 776 | 755 | 146.6 |
| B | 11 | 111 | 13312 | 85.67 | 776 | 755 | 146.6 |
| C | 4 | 254 | 55344 | 310.93 | 763 | 766 | 175.5 |
| C | 10 | 22 | 9894 | 52.0 | 763 | 766 | 175.5 |
| C | 8 | 128 | 8109 | 41.83 | 763 | 766 | 175.5 |
| D | 12 | 227 | 40352 | 220.39 | 754 | 738 | 179.7 |
| D | 2 | 136 | 31810 | 172.86 | 754 | 738 | 179.7 |
| D | 2 | 234 | 29446 | 159.71 | 754 | 738 | 179.7 |
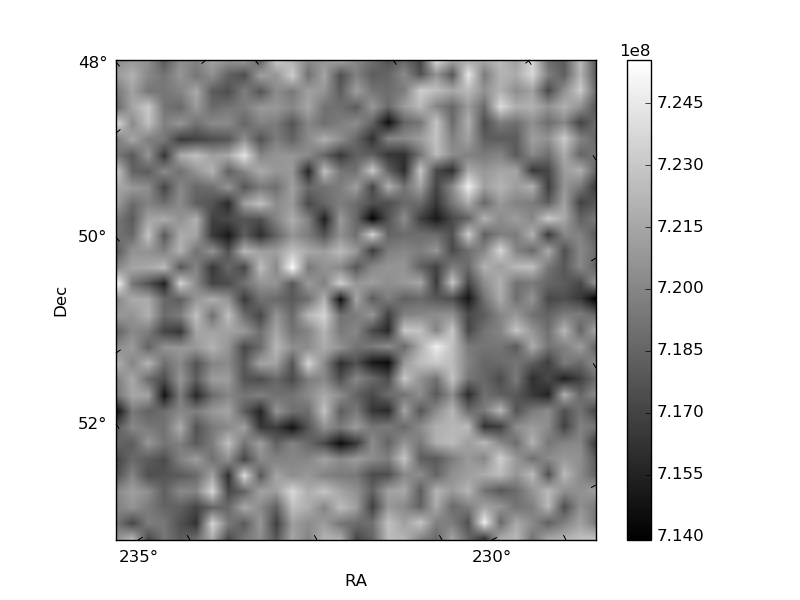
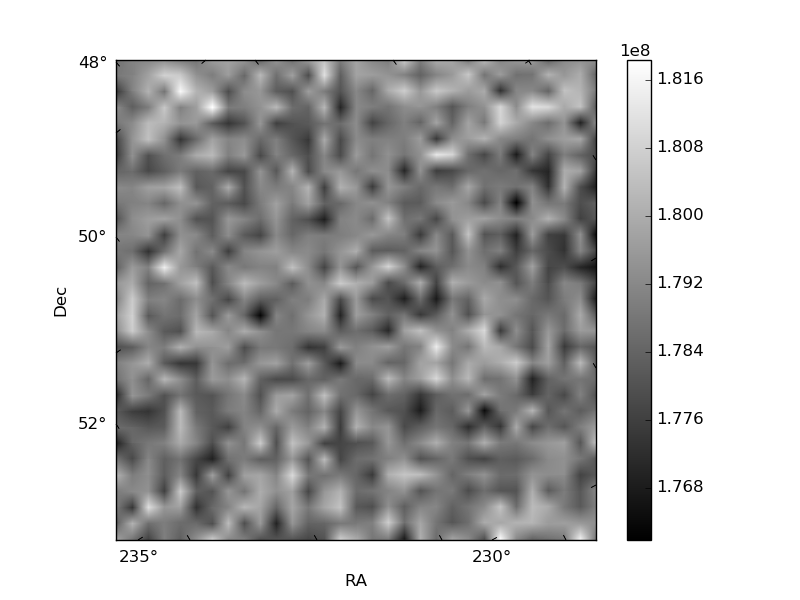
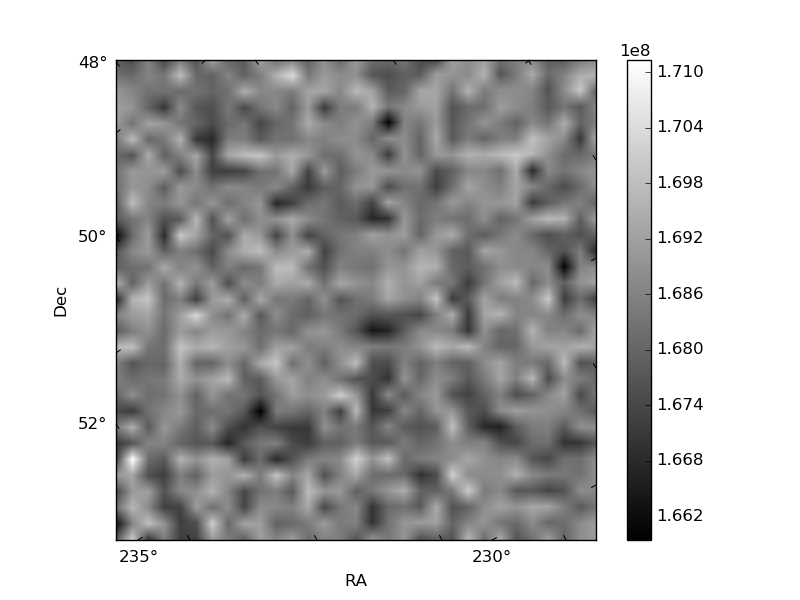
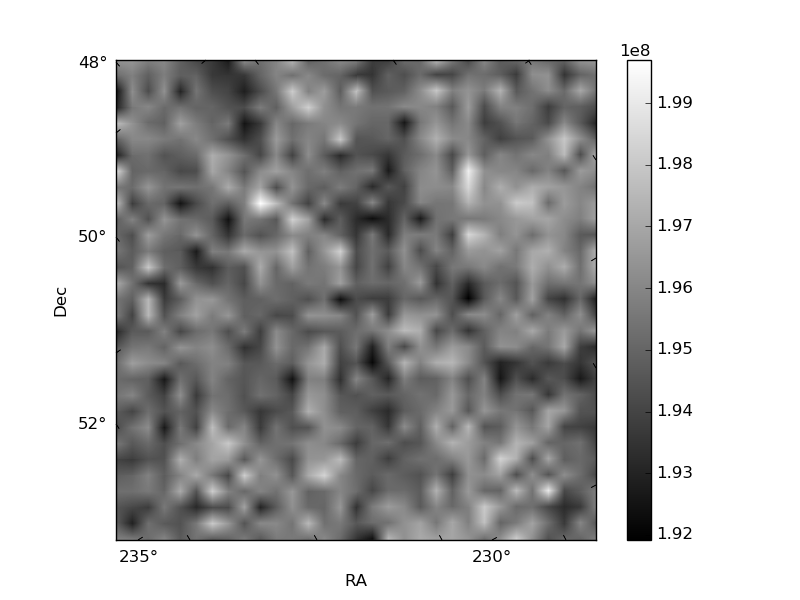
Histogram calculated using DETX and DETY for each event in the final _common_clean file
| Quadrant A | 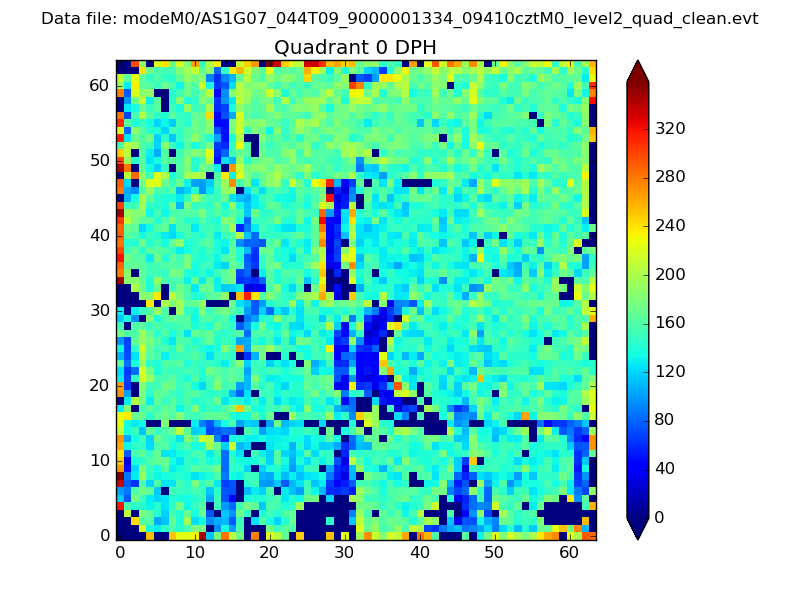 |
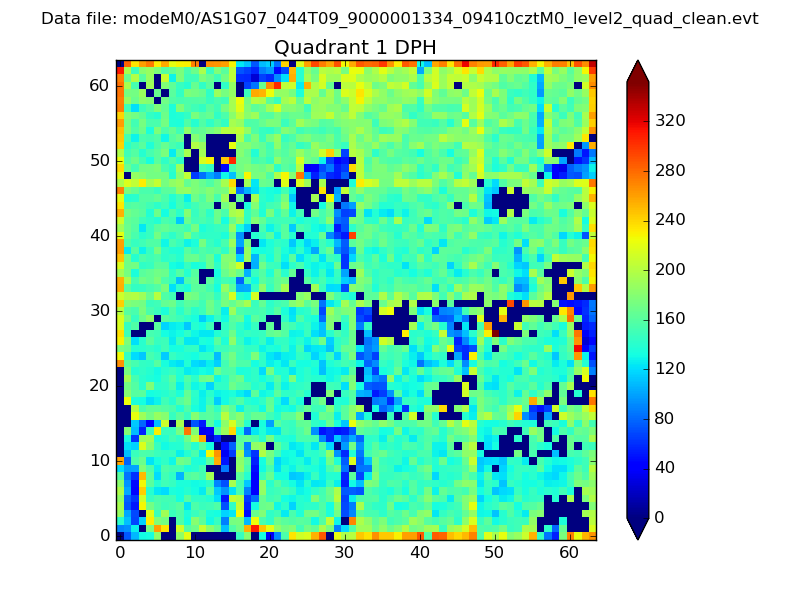 |
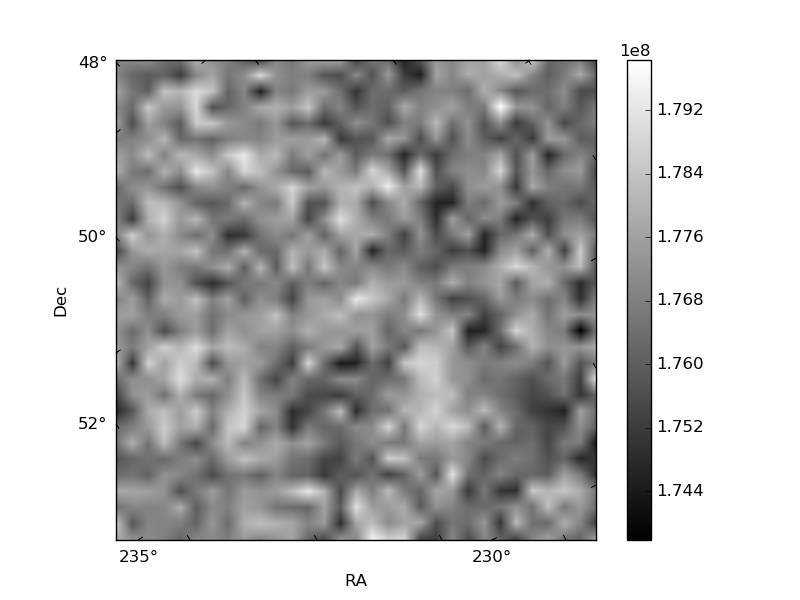
Quadrant B |
|---|---|---|---|
| Quadrant D | 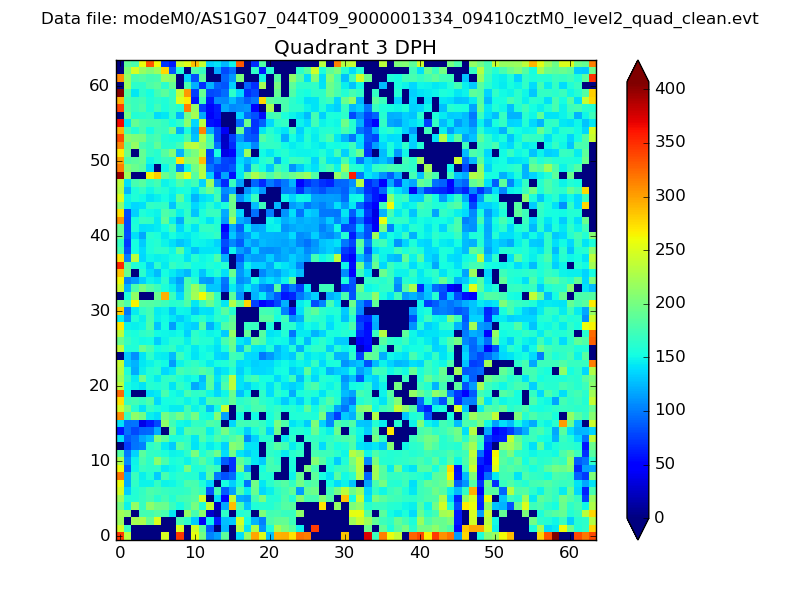 |
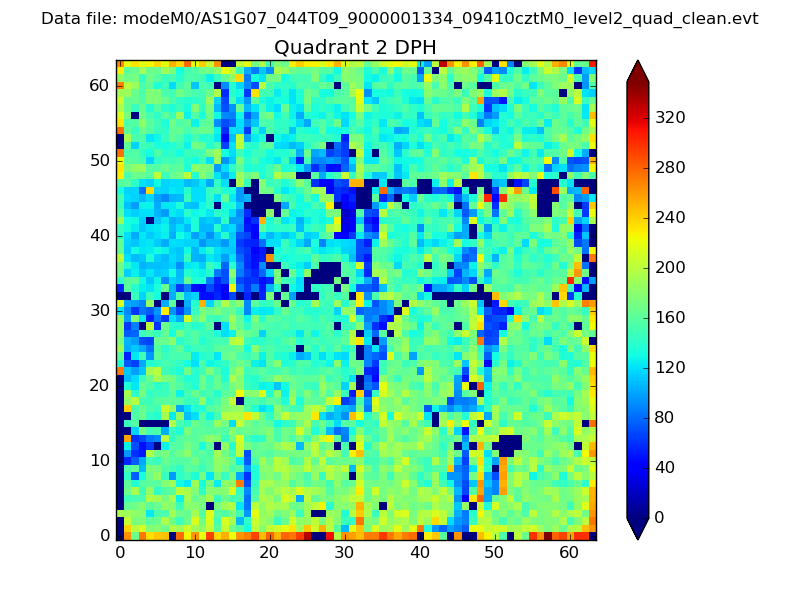 |
Quadrant C |
| Plot type | Count rate plots | Images |
|---|---|---|
| Comparison with Poisson distribution Blue bars denote a histogram of data divided into 1 sec bins. Red curve is a Poisson curve with rate = median count rate of data. |
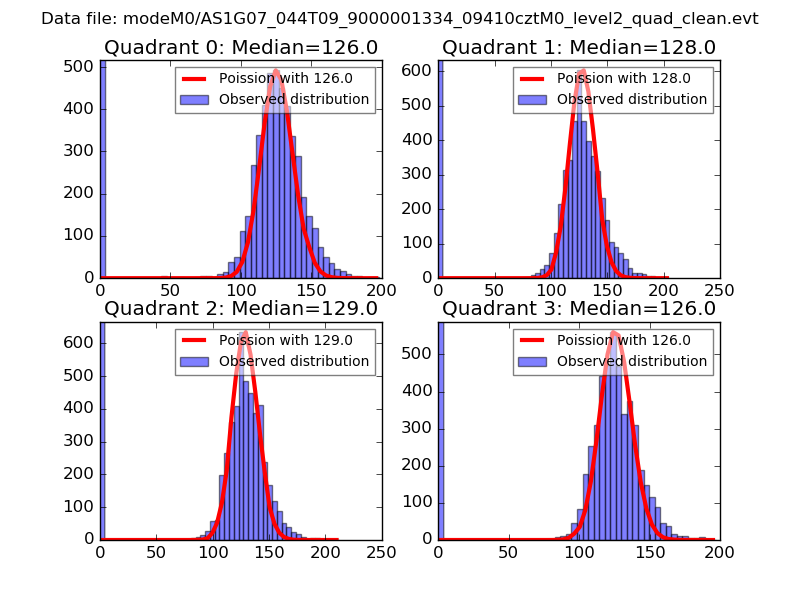 |
 |
| Quadrant-wise count rates Data is divided into 100 sec bins |
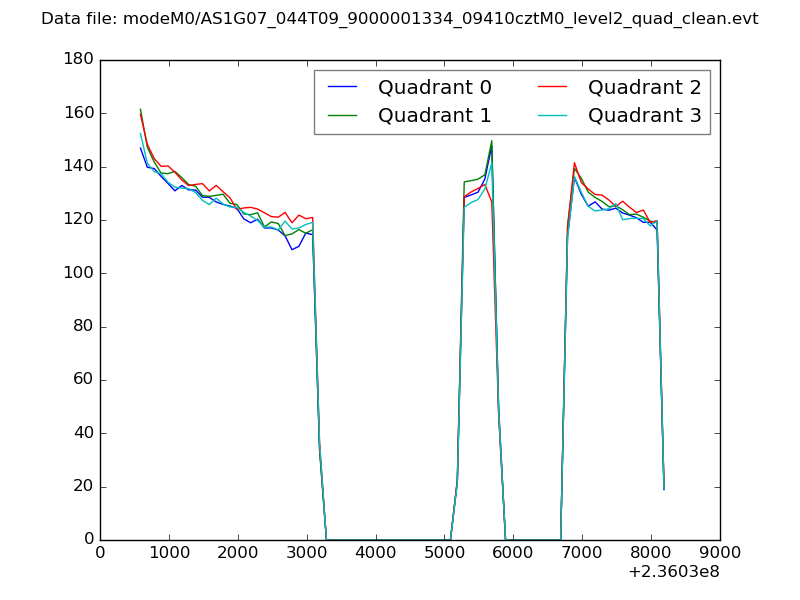 |
|
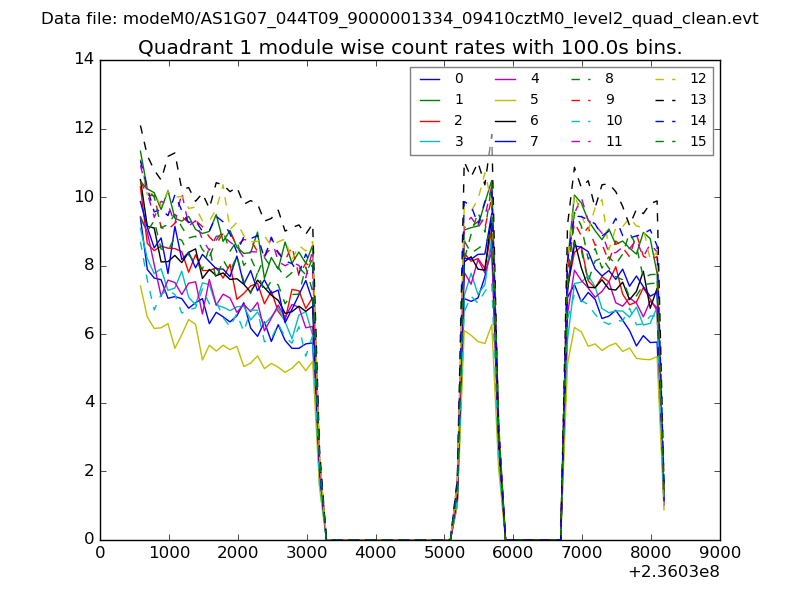
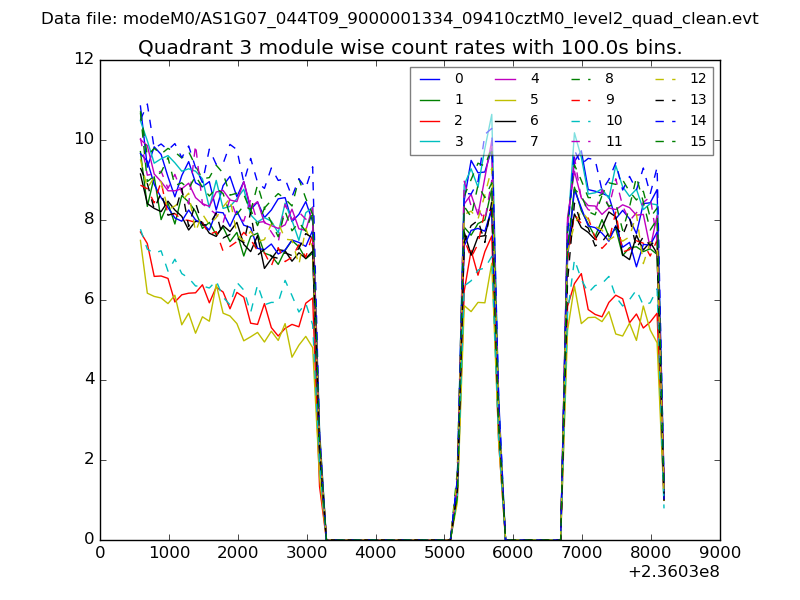
| Module-wise count rates for Quadrant A Data is divided into 100 sec bins |
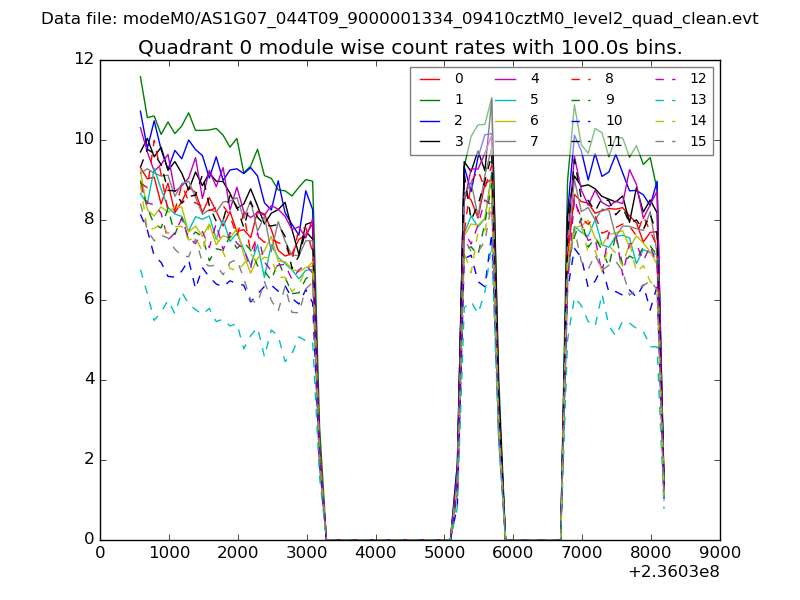 |
 |
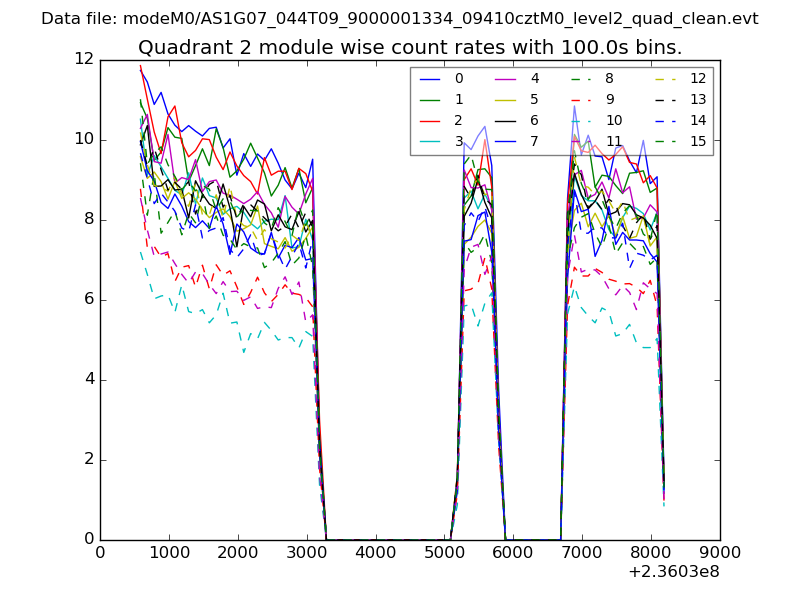
| Module-wise count rates for Quadrant B Data is divided into 100 sec bins |
 |
 |
| Module-wise count rates for Quadrant C Data is divided into 100 sec bins |
 |
 |
| Module-wise count rates for Quadrant D Data is divided into 100 sec bins |
 |
 |
| Parameter | Plot |
|---|---|
| CZT HV Monitor | 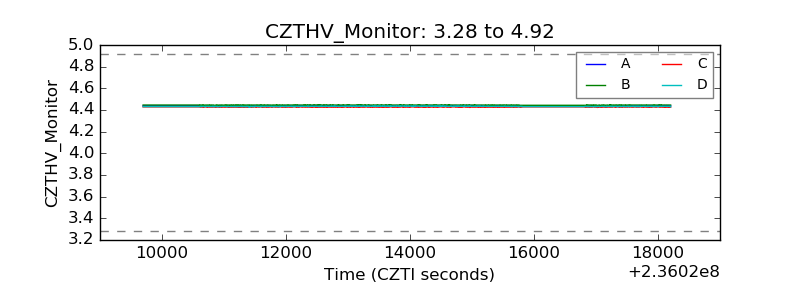 |
| D_VDD | 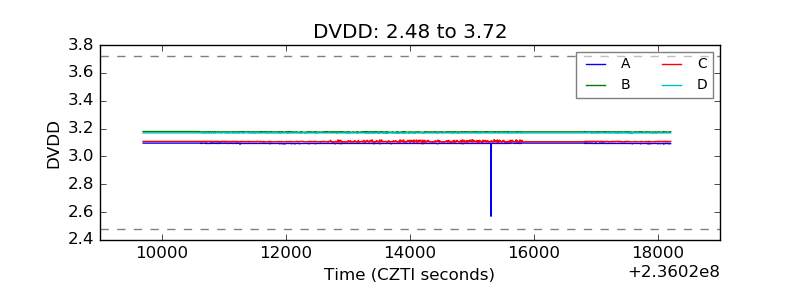 |
| Temperature 1 | 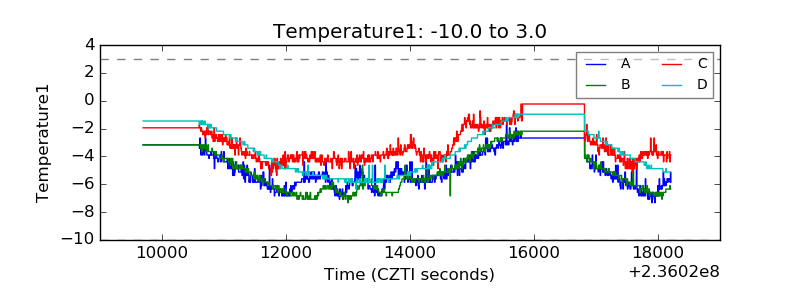 |
| Veto HV Monitor | 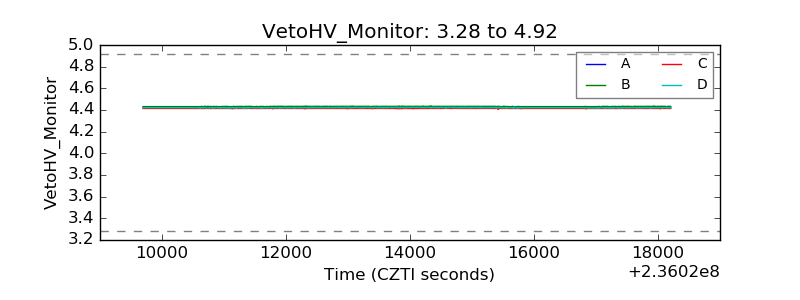 |
| Veto LLD | 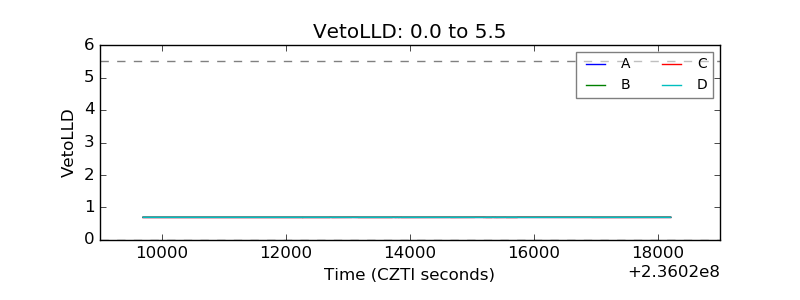 |
| Alpha Counter | 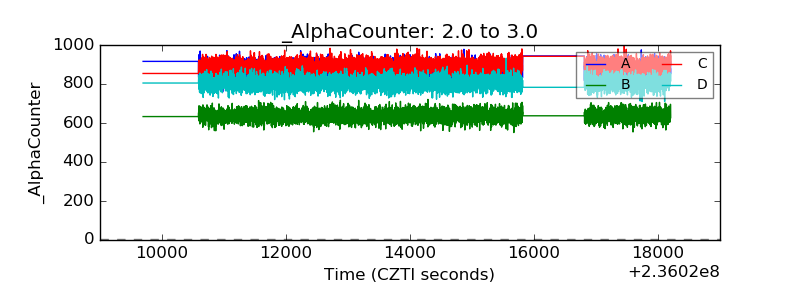 |
| _CPM_Rate | 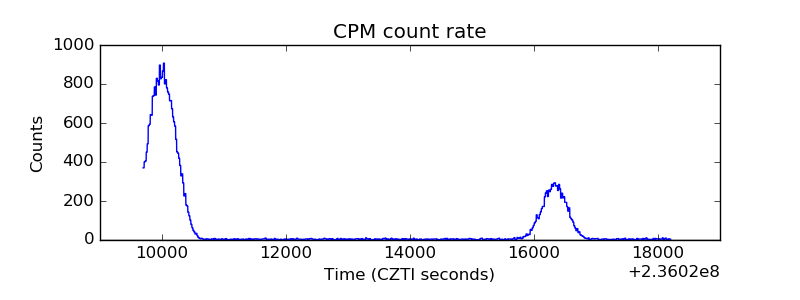 |
| CZT Counter | 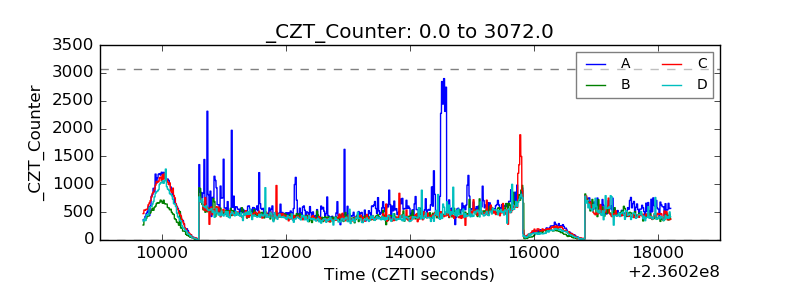 |
| +2.5 Volts monitor | 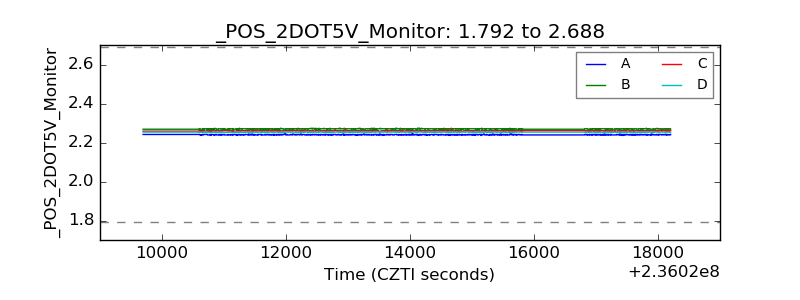 |
| +5 Volts monitor |  |
| _ROLL_ROT | 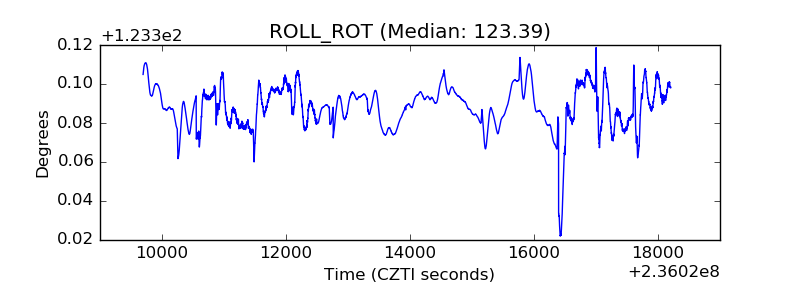 |
| _Roll_DEC | 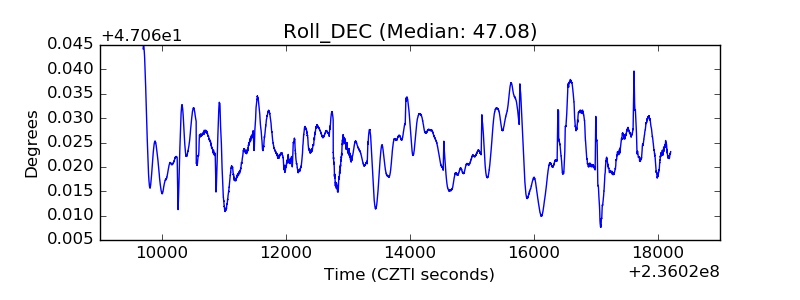 |
| _Roll_RA | 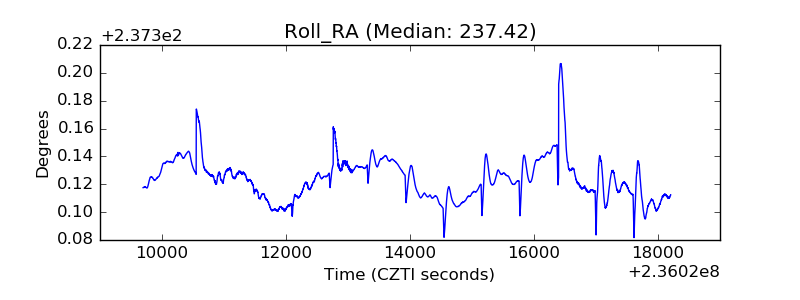 |
| Veto Counter | 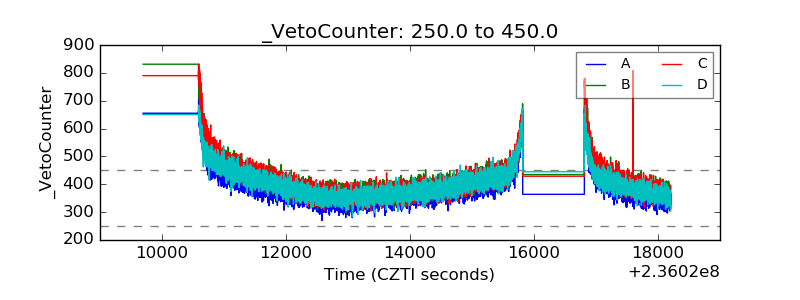 |