| Param | Original file | Final file |
|---|---|---|
| Filename | modeM0/AS1G07_044T09_9000001334_09412cztM0_level2.evt | modeM0/AS1G07_044T09_9000001334_09412cztM0_level2_quad_clean.evt |
| Size (bytes) | 424,218,240 | 86,961,600 |
| Size | 404.6 MB | 82.9 MB |
| Events in quadrant A | 3,595,480 | 542,554 |
| Events in quadrant B | 3,002,055 | 551,342 |
| Events in quadrant C | 2,925,191 | 552,010 |
| Events in quadrant D | 2,888,091 | 539,613 |
| Mode M0 | |||
|---|---|---|---|
| Quadrant | BADHDUFLAG | Total packets | Discarded packets |
| A | 0 | 14873 | 6 |
| B | 0 | 13368 | 2 |
| C | 0 | 13245 | 2 |
| D | 0 | 13277 | 4 |
| Mode M9 | |||
|---|---|---|---|
| Quadrant | BADHDUFLAG | Total packets | Discarded packets |
| A | 0 | 7 | 0 |
| B | 0 | 7 | 0 |
| C | 0 | 7 | 0 |
| D | 0 | 7 | 0 |
| Mode SS | |||
|---|---|---|---|
| Quadrant | BADHDUFLAG | Total packets | Discarded packets |
| A | 0 | 134 | 0 |
| B | 0 | 134 | 0 |
| C | 0 | 134 | 0 |
| D | 0 | 134 | 0 |
| Quadrant | Total seconds | Saturated seconds | Saturation percentage |
|---|---|---|---|
| A | 6413 | 81 | 1.263059% |
| B | 6415 | 65 | 1.013250% |
| C | 6415 | 23 | 0.358535% |
| D | 6414 | 30 | 0.467727% |
Noise dominated data is calculated using 1-second bins in cleaned event files. If a bin has >2000 counts, and if more than 50% of those come from <1% of pixels, then it is considered to be noise-dominated and hence unusable.
| Quadrant | # 1 sec bins | Bins with >0 counts | Bins with >2000 counts | High rate bins dominated by noise | Noise dominated (total time) | Noise dominated (detector-on time) | Marked lightcurve |
|---|---|---|---|---|---|---|---|
| A | 7065 | 6417 | 0 | 0 | 0.00% | 0.00% | 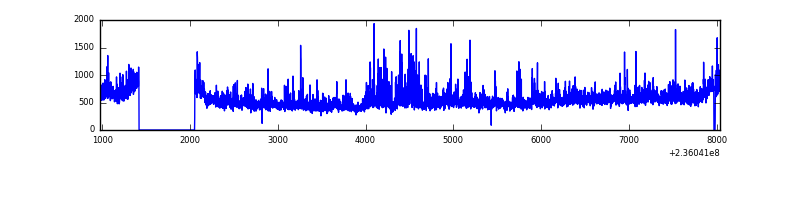 |
| B | 7065 | 6417 | 0 | 0 | 0.00% | 0.00% |  |
| C | 7065 | 6417 | 2 | 2 | 0.03% | 0.03% |  |
| D | 7065 | 6417 | 1 | 1 | 0.01% | 0.02% |  |
Top three noisy pixels from each quadrant. If the there are fewer than three noisy pixels in the level2.evt file, extra rows are filled as -1
| Pixel properties | Quadrant properties | ||||||
|---|---|---|---|---|---|---|---|
| Quadrant | DetID | PixID | Counts | Sigma | Mean | Median | Sigma |
| A | 8 | 5 | 518665 | 3353.21 | 752 | 733 | 154.5 |
| A | 1 | 162 | 89219 | 572.88 | 752 | 733 | 154.5 |
| A | 1 | 178 | 30179 | 190.64 | 752 | 733 | 154.5 |
| B | 0 | 214 | 37627 | 253.01 | 757 | 735 | 145.8 |
| B | 12 | 111 | 16218 | 106.19 | 757 | 735 | 145.8 |
| B | 11 | 111 | 13288 | 86.09 | 757 | 735 | 145.8 |
| C | 4 | 254 | 21250 | 118.62 | 742 | 745 | 172.9 |
| C | 10 | 22 | 8884 | 47.08 | 742 | 745 | 172.9 |
| C | 13 | 61 | 5436 | 27.14 | 742 | 745 | 172.9 |
| D | 2 | 234 | 31270 | 172.04 | 737 | 719 | 177.6 |
| D | 7 | 71 | 18886 | 102.3 | 737 | 719 | 177.6 |
| D | 2 | 14 | 15340 | 82.33 | 737 | 719 | 177.6 |
Histogram calculated using DETX and DETY for each event in the final _common_clean file
| Quadrant A | 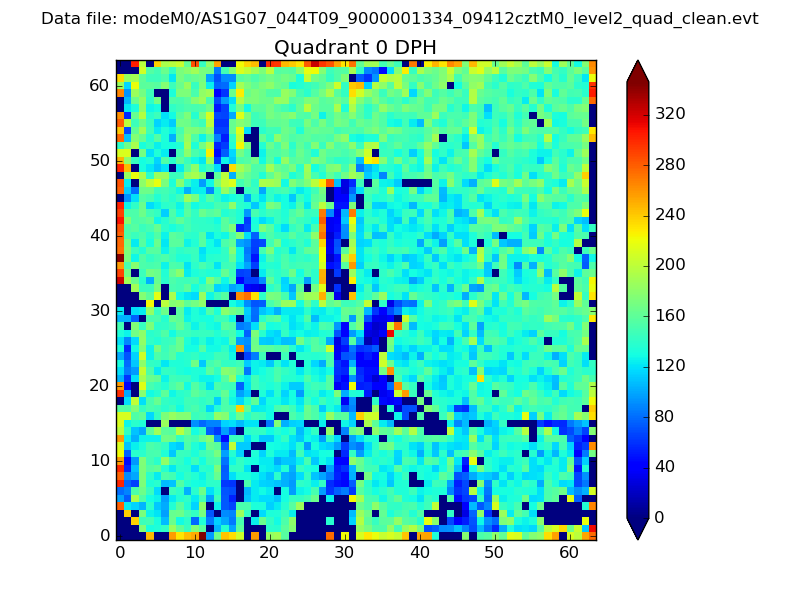 |
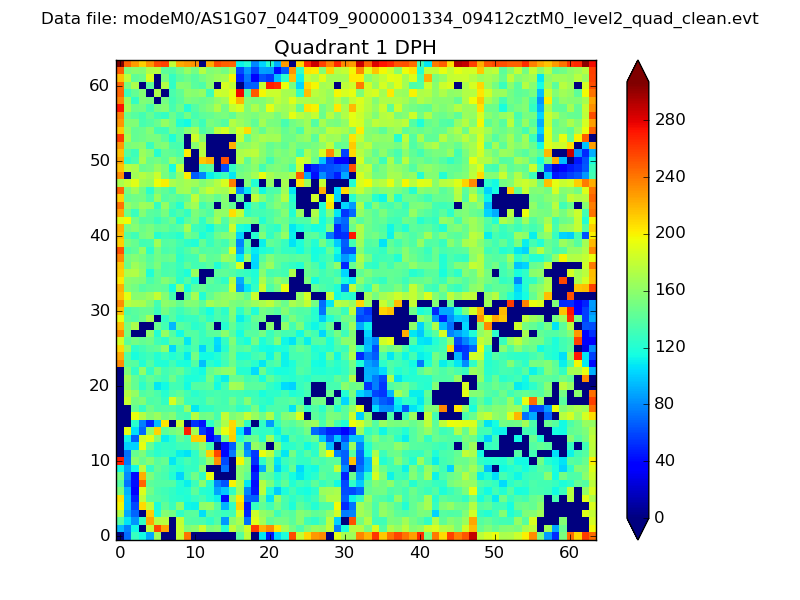 |
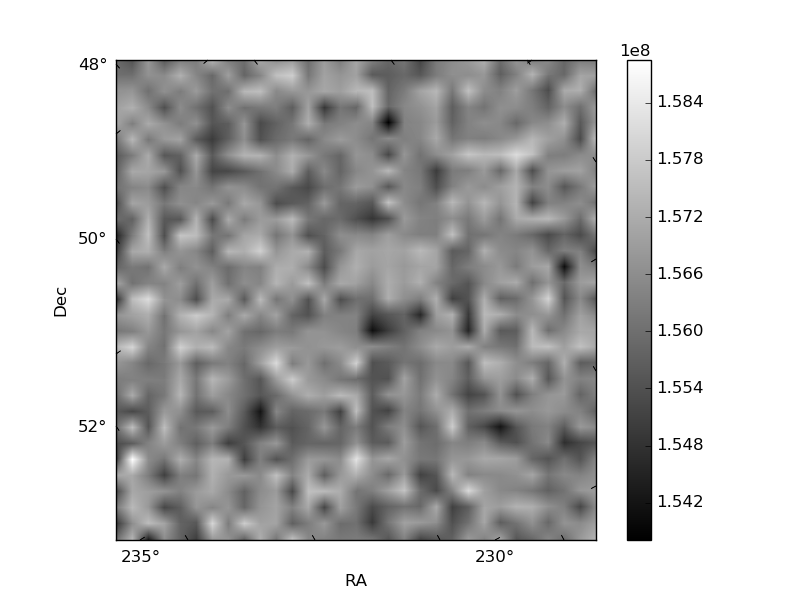
Quadrant B |
|---|---|---|---|
| Quadrant D | 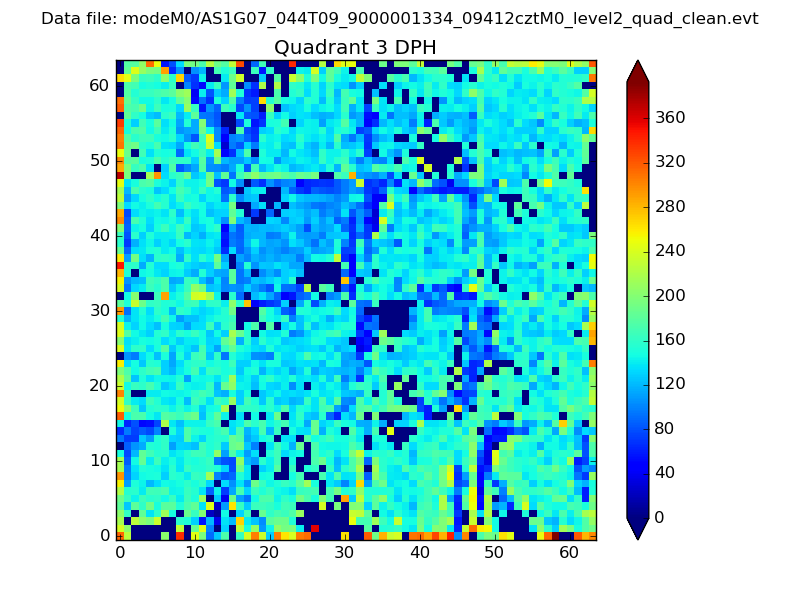 |
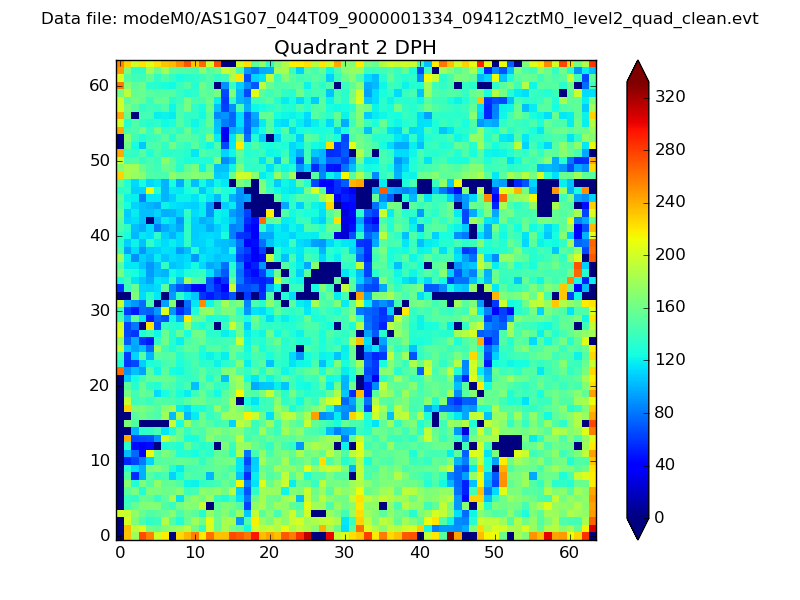 |
Quadrant C |
| Plot type | Count rate plots | Images |
|---|---|---|
| Comparison with Poisson distribution Blue bars denote a histogram of data divided into 1 sec bins. Red curve is a Poisson curve with rate = median count rate of data. |
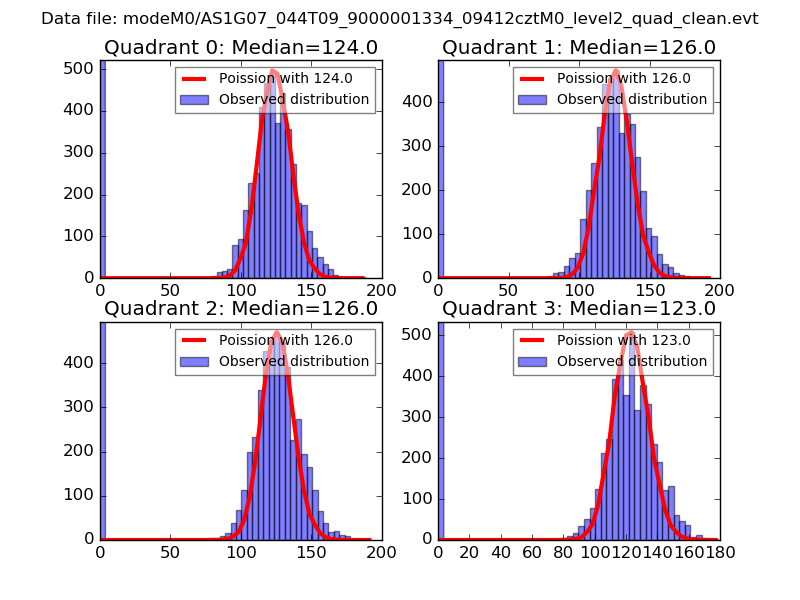 |
 |
| Quadrant-wise count rates Data is divided into 100 sec bins |
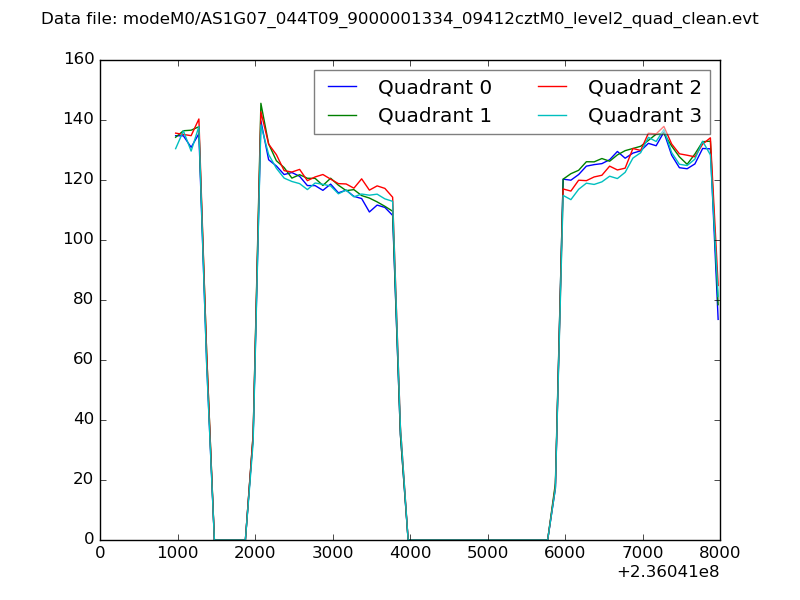 |
|
| Module-wise count rates for Quadrant A Data is divided into 100 sec bins |
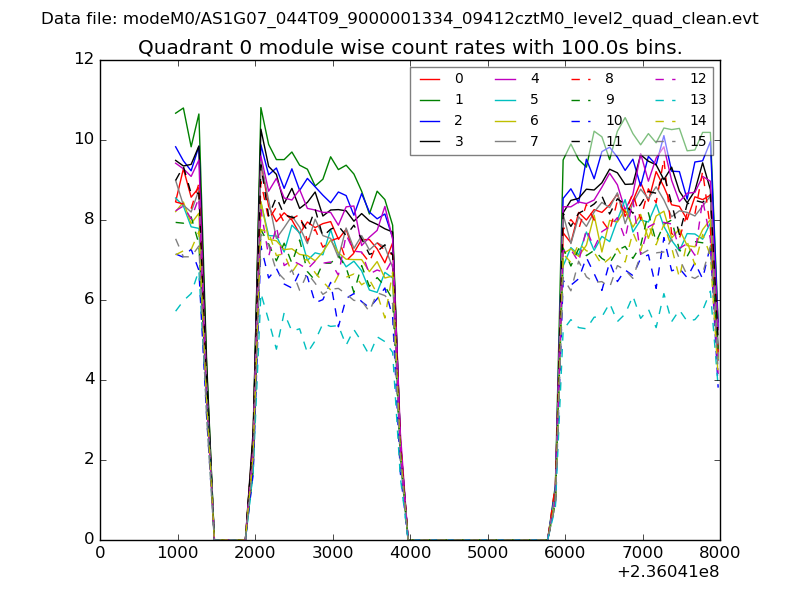 |
 |
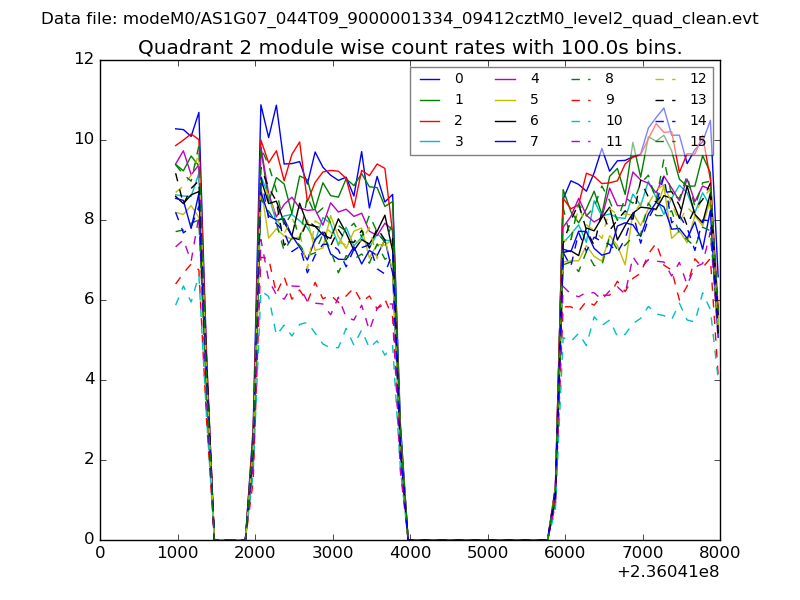
| Module-wise count rates for Quadrant B Data is divided into 100 sec bins |
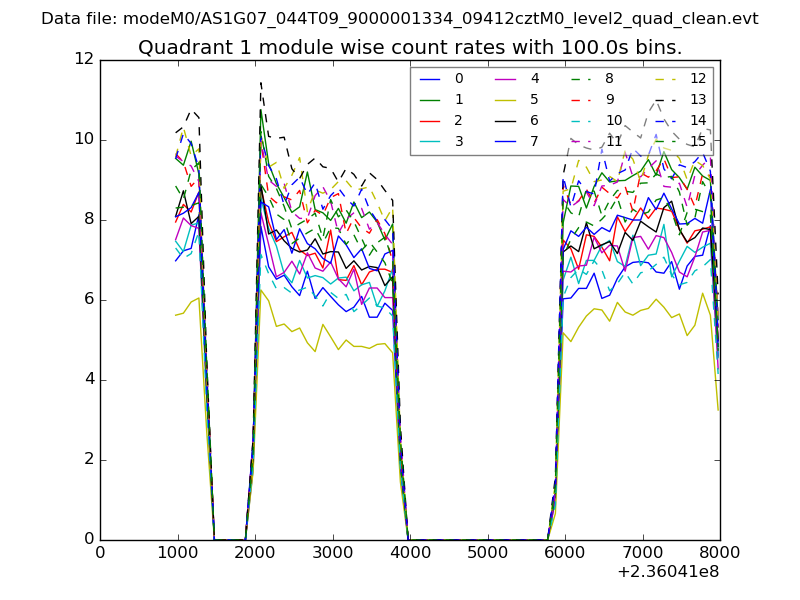 |
 |
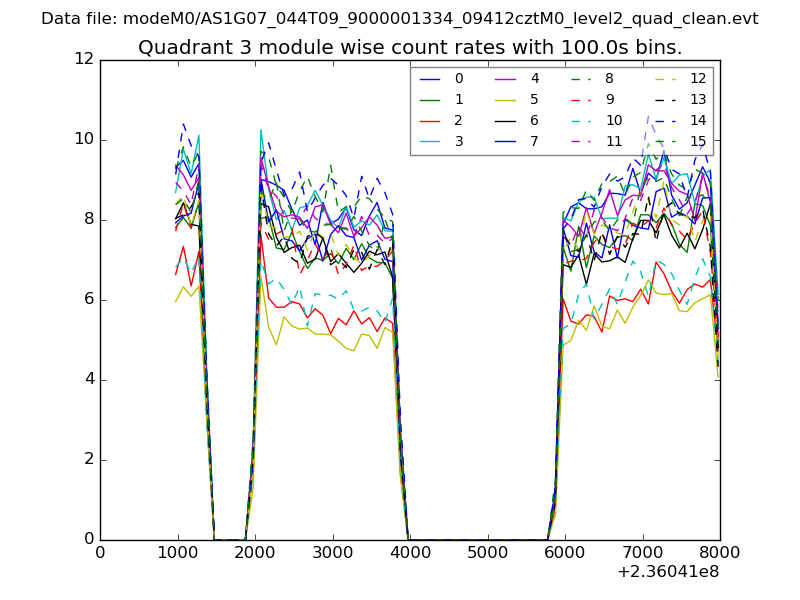
| Module-wise count rates for Quadrant C Data is divided into 100 sec bins |
 |
 |
| Module-wise count rates for Quadrant D Data is divided into 100 sec bins |
 |
 |
| Parameter | Plot |
|---|---|
| CZT HV Monitor |  |
| D_VDD | 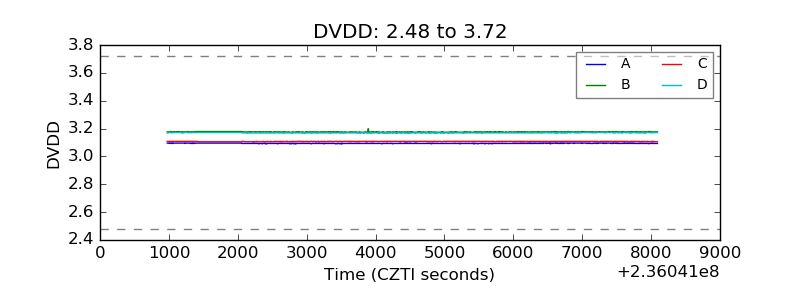 |
| Temperature 1 | 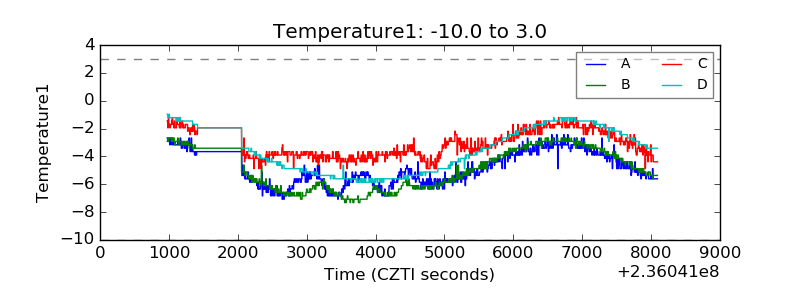 |
| Veto HV Monitor | 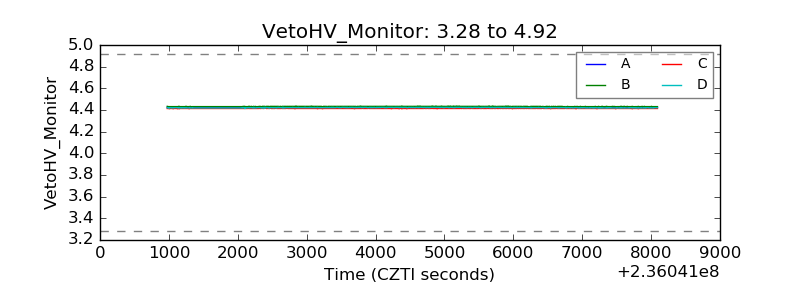 |
| Veto LLD | 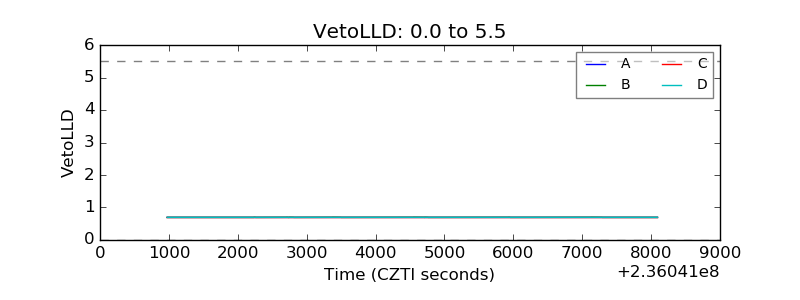 |
| Alpha Counter | 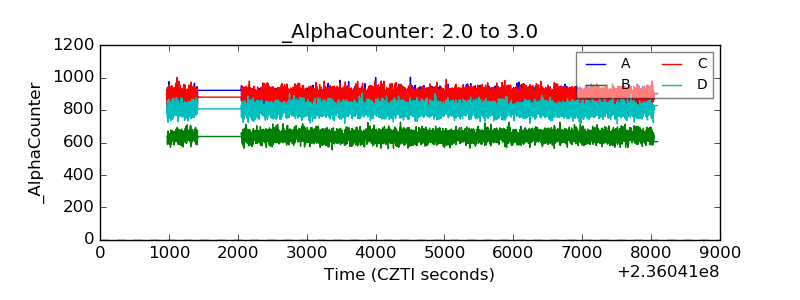 |
| _CPM_Rate | 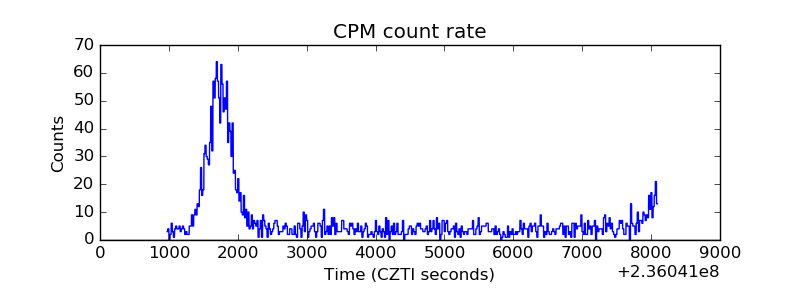 |
| CZT Counter | 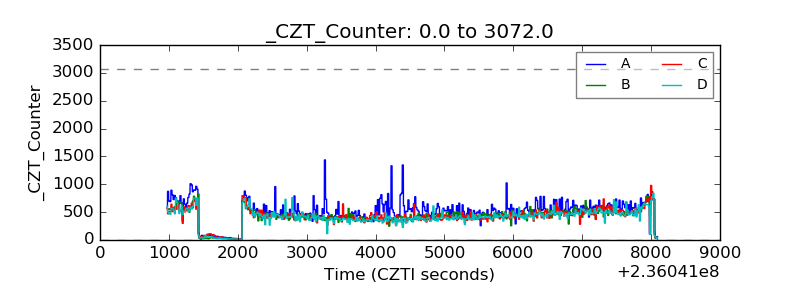 |
| +2.5 Volts monitor |  |
| +5 Volts monitor | 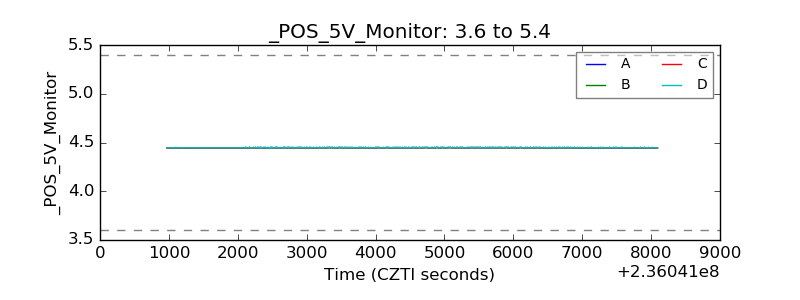 |
| _ROLL_ROT | 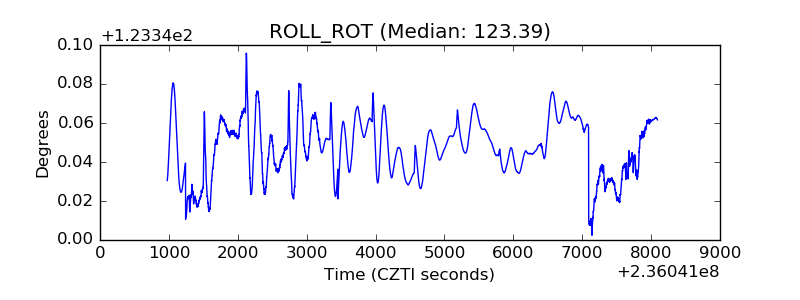 |
| _Roll_DEC | 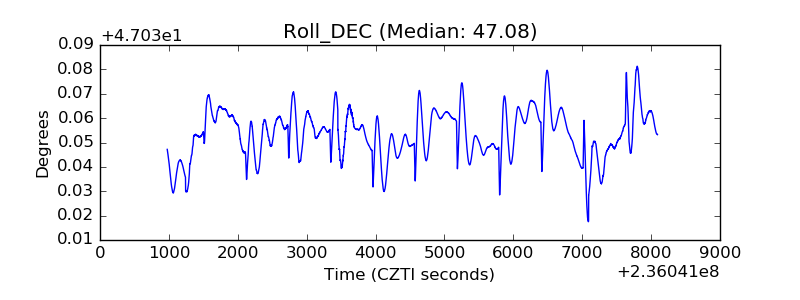 |
| _Roll_RA | 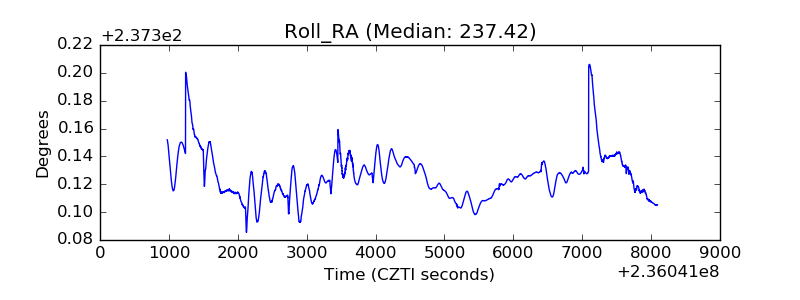 |
| Veto Counter | 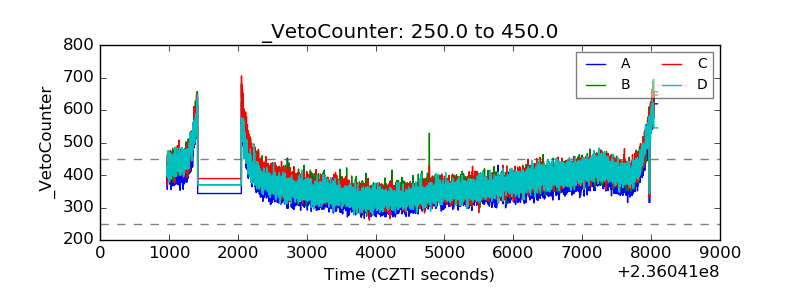 |