| Param | Original file | Final file |
|---|---|---|
| Filename | modeM0/AS1A02_178T01_9000001340cztM0_level2.fits | modeM0/AS1A02_178T01_9000001340cztM0_level2_quad_clean.evt |
| Size (bytes) | 790,467,840 | 725,391,360 |
| Size | 753.8 MB | 691.8 MB |
| Events in quadrant A | 5,005,631 | 4,474,171 |
| Events in quadrant B | 4,828,888 | 4,419,033 |
| Events in quadrant C | 3,924,494 | 3,226,533 |
| Events in quadrant D | 4,302,195 | 3,978,127 |
| Mode SS | |||
|---|---|---|---|
| Quadrant | BADHDUFLAG | Total packets | Discarded packets |
| A | 0 | 1884 | 0 |
| B | 0 | 1896 | 0 |
| C | 0 | 1894 | 0 |
| D | 0 | 1901 | 0 |
| Mode M0 | |||
|---|---|---|---|
| Quadrant | BADHDUFLAG | Total packets | Discarded packets |
| A | 0 | 199417 | 0 |
| B | 0 | 186765 | 0 |
| C | 0 | 195632 | 0 |
| D | 0 | 191763 | 0 |
| Mode M9 | |||
|---|---|---|---|
| Quadrant | BADHDUFLAG | Total packets | Discarded packets |
| A | 0 | 150 | 0 |
| B | 0 | 153 | 0 |
| C | 0 | 146 | 0 |
| D | 0 | 146 | 0 |
| Quadrant | Total seconds | Saturated seconds | Saturation percentage |
|---|---|---|---|
| A | 88580 | 1163 | 1.312937% |
| B | 88743 | 866 | 0.975852% |
| C | 74252 | 6441 | 8.674514% |
| D | 88665 | 759 | 0.856031% |
Noise dominated data is calculated using 1-second bins in cleaned event files. If a bin has >2000 counts, and if more than 50% of those come from <1% of pixels, then it is considered to be noise-dominated and hence unusable.
| Quadrant | # 1 sec bins | Bins with >0 counts | Bins with >2000 counts | High rate bins dominated by noise | Noise dominated (total time) | Noise dominated (detector-on time) | Marked lightcurve |
|---|---|---|---|---|---|---|---|
| A | 126811 | 93735 | 0 | 0 | 0.00% | 0.00% | 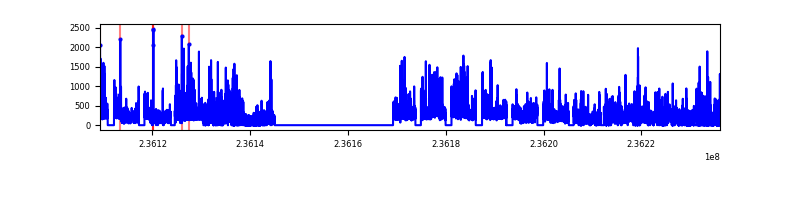 |
| B | 126811 | 93888 | 0 | 0 | 0.00% | 0.00% |  |
| C | 108262 | 76322 | 0 | 0 | 0.00% | 0.00% |  |
| D | 126811 | 93844 | 0 | 0 | 0.00% | 0.00% |  |
Top three noisy pixels from each quadrant. If the there are fewer than three noisy pixels in the level2.evt file, extra rows are filled as -1
| Pixel properties | Quadrant properties | ||||||
|---|---|---|---|---|---|---|---|
| Quadrant | DetID | PixID | Counts | Sigma | Mean | Median | Sigma |
| A | 0 | 29 | 4987 | 11.51 | 1304 | 1222 | 327.1 |
| A | 7 | 110 | 4229 | 9.19 | 1304 | 1222 | 327.1 |
| A | 0 | 30 | 3862 | 8.07 | 1304 | 1222 | 327.1 |
| B | 2 | 9 | 4120 | 11.56 | 1275 | 1214 | 251.3 |
| B | 14 | 254 | 3324 | 8.4 | 1275 | 1214 | 251.3 |
| B | 5 | 128 | 3283 | 8.23 | 1275 | 1214 | 251.3 |
| C | 12 | 241 | 2760 | 6.59 | 1037 | 962 | 272.7 |
| C | 9 | 242 | 2644 | 6.17 | 1037 | 962 | 272.7 |
| C | 2 | 191 | 2609 | 6.04 | 1037 | 962 | 272.7 |
| D | 6 | 231 | 3250 | 6.51 | 1227 | 1113 | 328.0 |
| D | 1 | 19 | 3081 | 6.0 | 1227 | 1113 | 328.0 |
| D | 7 | 5 | 3078 | 5.99 | 1227 | 1113 | 328.0 |
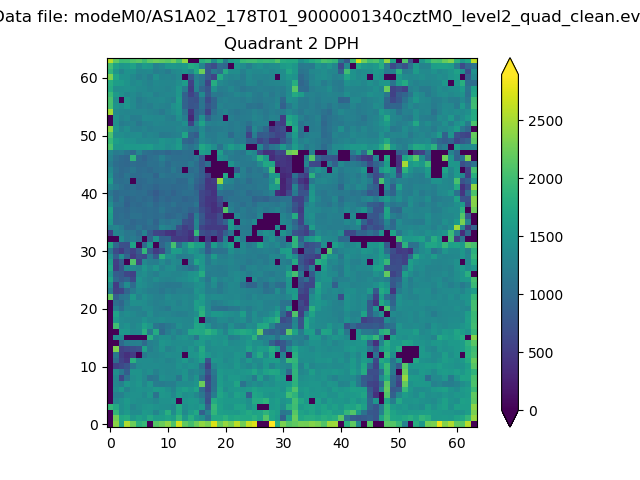
Histogram calculated using DETX and DETY for each event in the final _common_clean file
| Quadrant A | 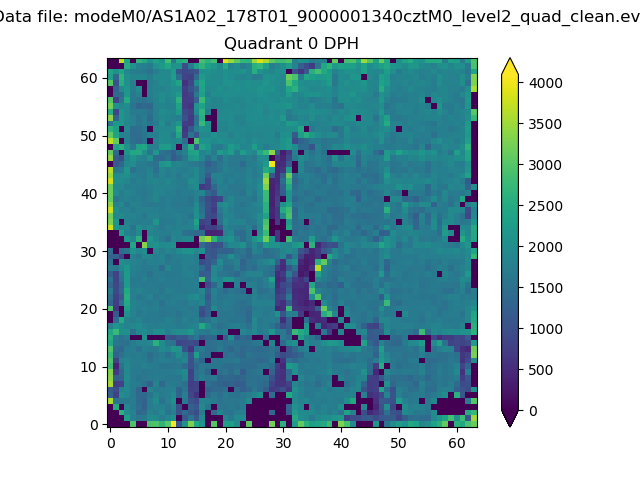 |
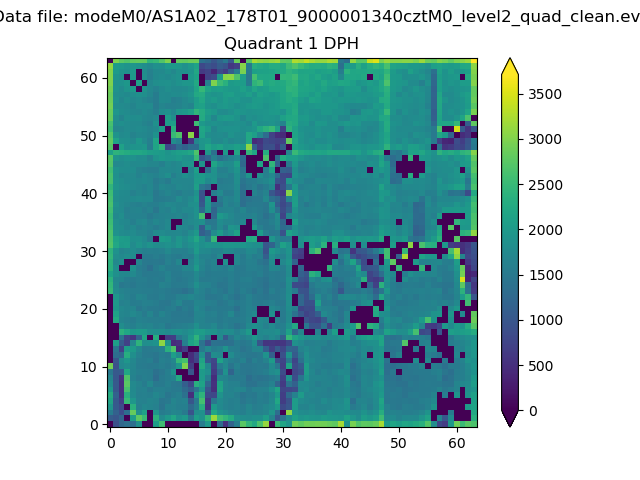 |
Quadrant B |
|---|---|---|---|
| Quadrant D | 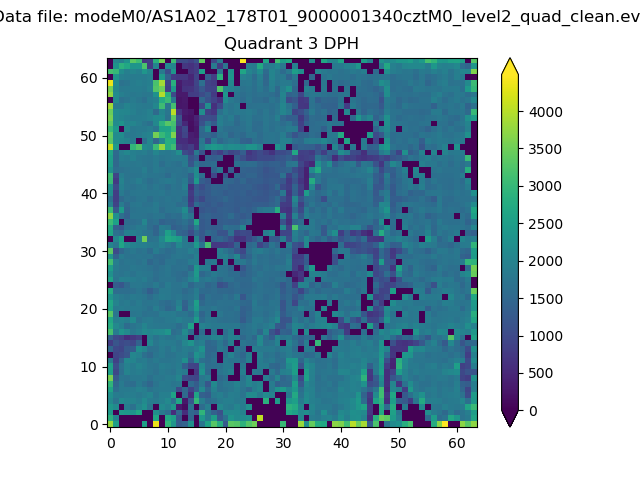 |
 |
Quadrant C |
| Plot type | Count rate plots | Images |
|---|---|---|
| Comparison with Poisson distribution Blue bars denote a histogram of data divided into 1 sec bins. Red curve is a Poisson curve with rate = median count rate of data. |
 |
 |
| Quadrant-wise count rates Data is divided into 100 sec bins |
 |
|
| Module-wise count rates for Quadrant A Data is divided into 100 sec bins |
 |
 |
| Module-wise count rates for Quadrant B Data is divided into 100 sec bins |
 |
 |
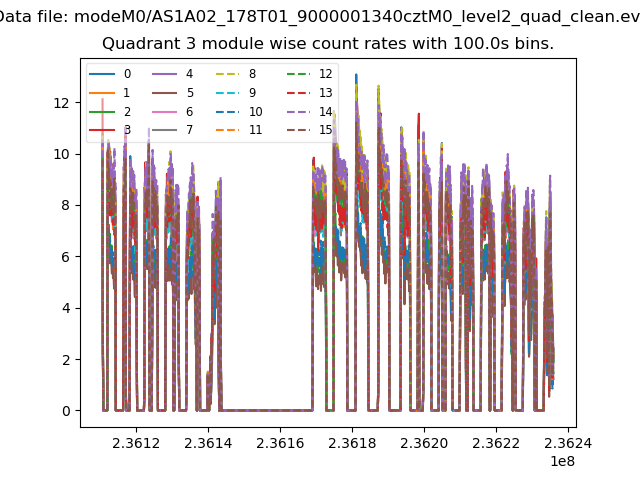
| Module-wise count rates for Quadrant C Data is divided into 100 sec bins |
 |
 |
| Module-wise count rates for Quadrant D Data is divided into 100 sec bins |
 |
 |
| Parameter | Plot |
|---|---|
| CZT HV Monitor | 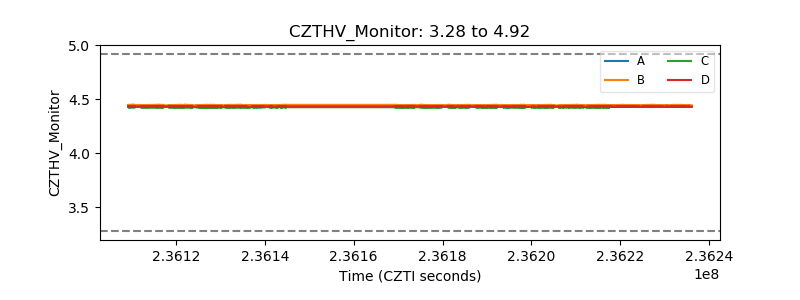 |
| D_VDD | 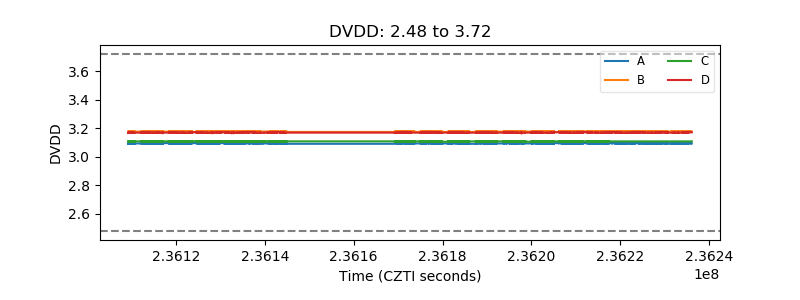 |
| Temperature 1 |  |
| Veto HV Monitor | 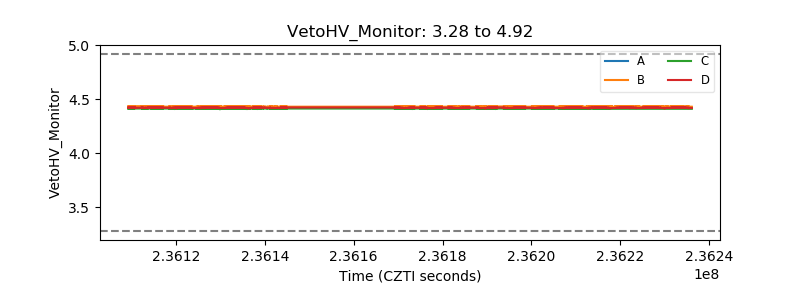 |
| Veto LLD |  |
| Alpha Counter |  |
| _CPM_Rate |  |
| CZT Counter |  |
| +2.5 Volts monitor | 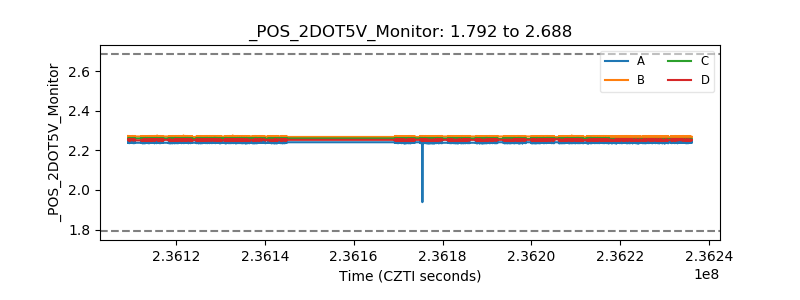 |
| +5 Volts monitor |  |
| _ROLL_ROT | 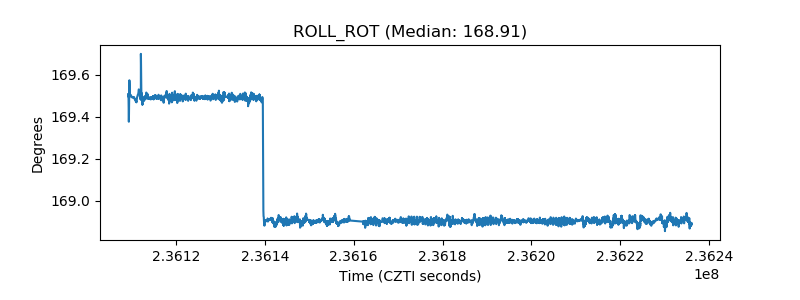 |
| _Roll_DEC |  |
| _Roll_RA |  |
| Veto Counter |  |