| Param | Original file | Final file |
|---|---|---|
| Filename | modeM0/AS1A02_178T01_9000001340_09423cztM0_level2.evt | modeM0/AS1A02_178T01_9000001340_09423cztM0_level2_quad_clean.evt |
| Size (bytes) | 236,545,920 | 34,911,360 |
| Size | 225.6 MB | 33.3 MB |
| Events in quadrant A | 1,821,853 | 214,864 |
| Events in quadrant B | 1,605,834 | 216,796 |
| Events in quadrant C | 1,747,520 | 209,537 |
| Events in quadrant D | 1,786,438 | 205,036 |
| Mode SS | |||
|---|---|---|---|
| Quadrant | BADHDUFLAG | Total packets | Discarded packets |
| A | 0 | 62 | 0 |
| B | 0 | 62 | 0 |
| C | 0 | 62 | 0 |
| D | 0 | 62 | 0 |
| Mode M0 | |||
|---|---|---|---|
| Quadrant | BADHDUFLAG | Total packets | Discarded packets |
| A | 0 | 7328 | 2 |
| B | 0 | 6626 | 1 |
| C | 0 | 7011 | 1 |
| D | 0 | 7245 | 1 |
| Mode M9 | |||
|---|---|---|---|
| Quadrant | BADHDUFLAG | Total packets | Discarded packets |
| A | 0 | 13 | 0 |
| B | 0 | 13 | 0 |
| C | 0 | 13 | 0 |
| D | 0 | 13 | 0 |
| Quadrant | Total seconds | Saturated seconds | Saturation percentage |
|---|---|---|---|
| A | 2948 | 75 | 2.544098% |
| B | 2948 | 66 | 2.238806% |
| C | 2948 | 66 | 2.238806% |
| D | 2948 | 73 | 2.476255% |
Noise dominated data is calculated using 1-second bins in cleaned event files. If a bin has >2000 counts, and if more than 50% of those come from <1% of pixels, then it is considered to be noise-dominated and hence unusable.
| Quadrant | # 1 sec bins | Bins with >0 counts | Bins with >2000 counts | High rate bins dominated by noise | Noise dominated (total time) | Noise dominated (detector-on time) | Marked lightcurve |
|---|---|---|---|---|---|---|---|
| A | 4233 | 2949 | 4 | 4 | 0.09% | 0.14% | 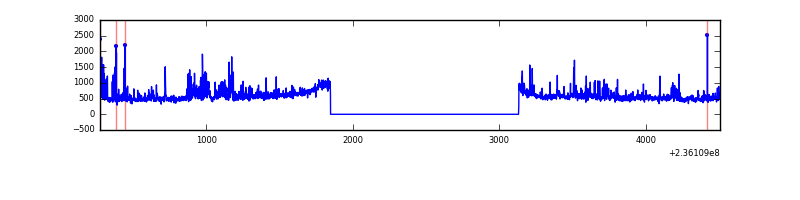 |
| B | 4233 | 2949 | 0 | 0 | 0.00% | 0.00% | 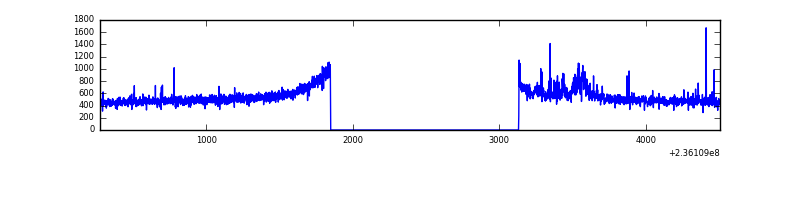 |
| C | 4233 | 2949 | 32 | 32 | 0.76% | 1.09% |  |
| D | 4233 | 2949 | 17 | 17 | 0.40% | 0.58% | 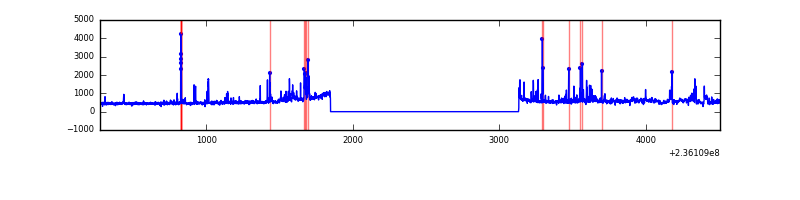 |
Top three noisy pixels from each quadrant. If the there are fewer than three noisy pixels in the level2.evt file, extra rows are filled as -1
| Pixel properties | Quadrant properties | ||||||
|---|---|---|---|---|---|---|---|
| Quadrant | DetID | PixID | Counts | Sigma | Mean | Median | Sigma |
| A | 8 | 5 | 303935 | 3747.89 | 390 | 382 | 81.0 |
| A | 1 | 162 | 6215 | 72.02 | 390 | 382 | 81.0 |
| A | 13 | 251 | 5165 | 59.05 | 390 | 382 | 81.0 |
| B | 0 | 230 | 39263 | 510.75 | 391 | 381 | 76.1 |
| B | 0 | 214 | 15631 | 200.32 | 391 | 381 | 76.1 |
| B | 0 | 189 | 8376 | 105.02 | 391 | 381 | 76.1 |
| C | 4 | 254 | 209705 | 2366.09 | 377 | 378 | 88.5 |
| C | 9 | 68 | 61040 | 685.68 | 377 | 378 | 88.5 |
| C | 14 | 234 | 4610 | 47.84 | 377 | 378 | 88.5 |
| D | 8 | 195 | 129519 | 1415.07 | 374 | 366 | 91.3 |
| D | 1 | 52 | 121184 | 1323.75 | 374 | 366 | 91.3 |
| D | 12 | 227 | 32900 | 356.46 | 374 | 366 | 91.3 |
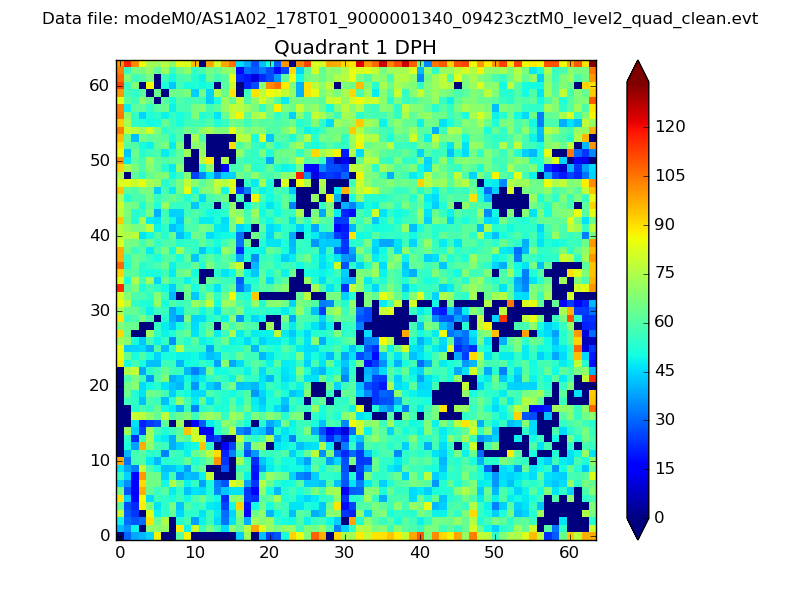
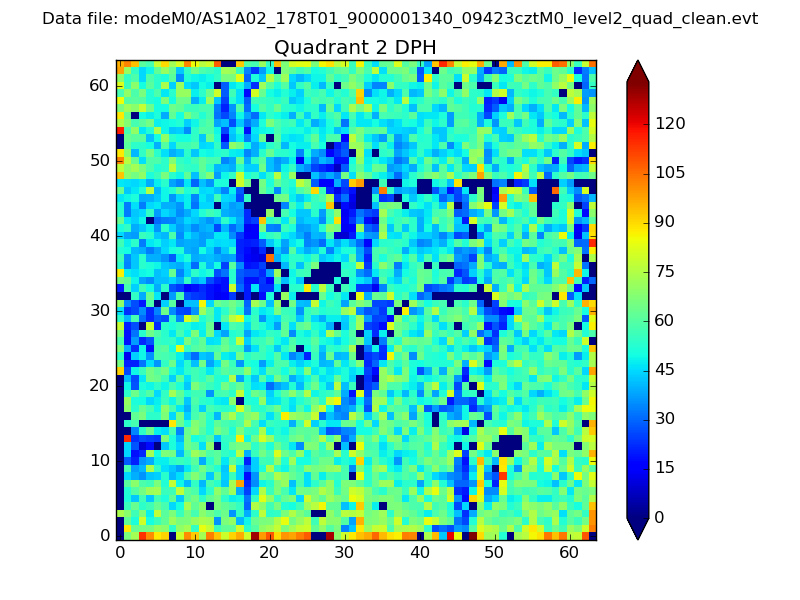
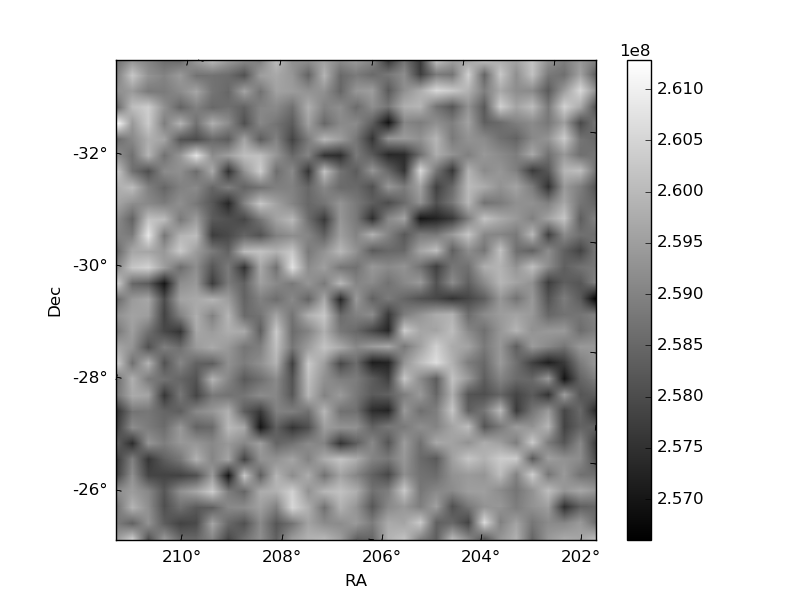
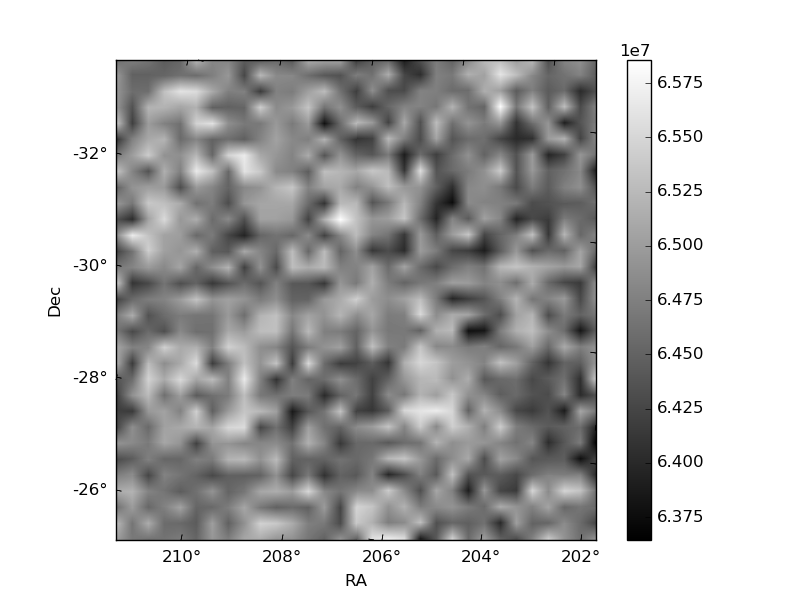
Histogram calculated using DETX and DETY for each event in the final _common_clean file
| Quadrant A | 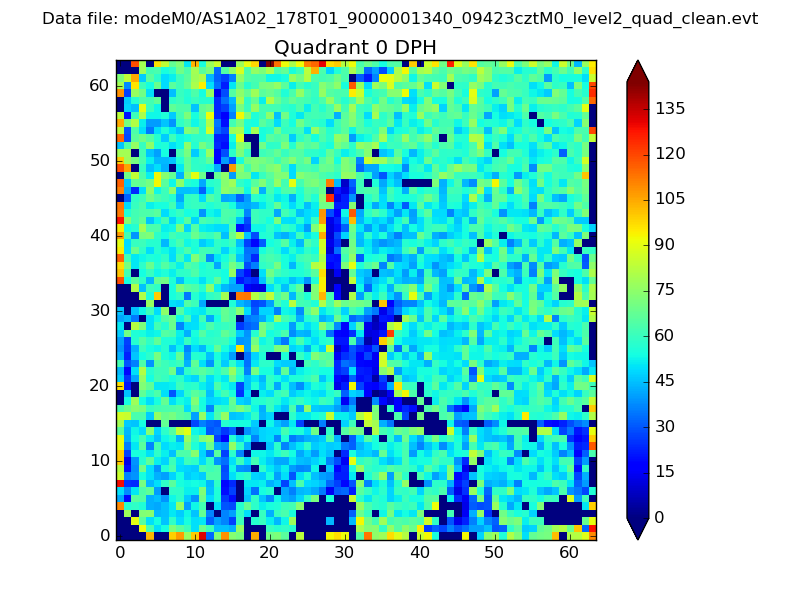 |
 |
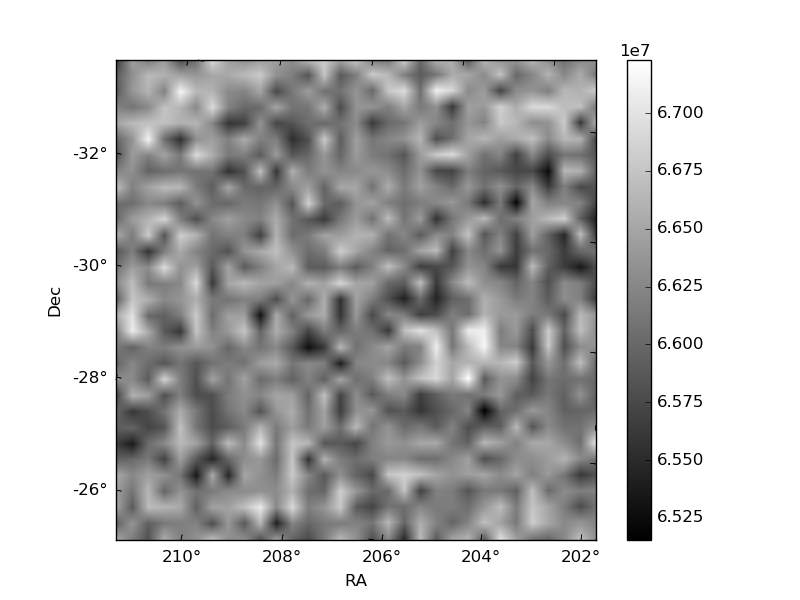
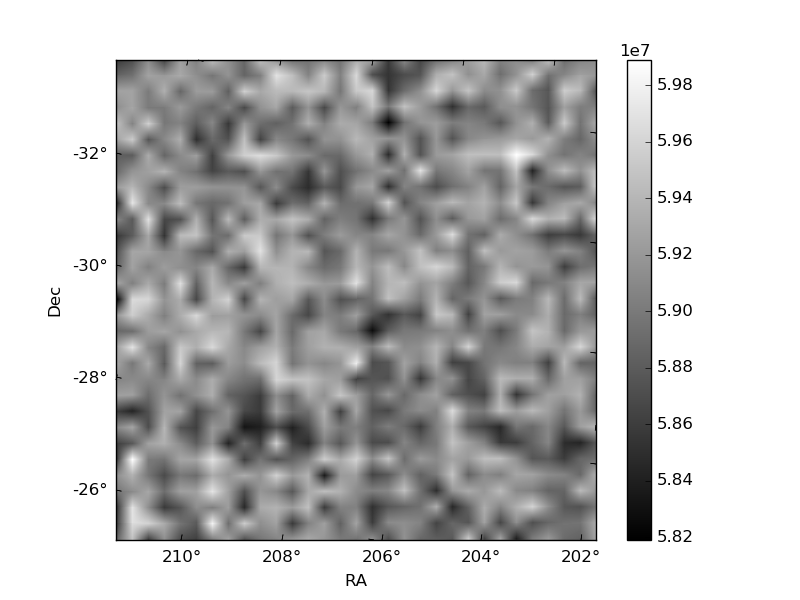
Quadrant B |
|---|---|---|---|
| Quadrant D | 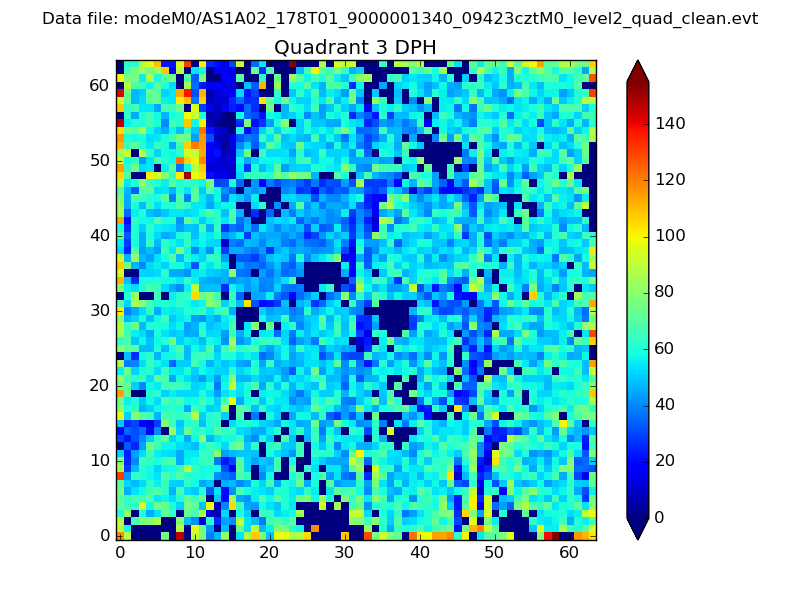 |
 |
Quadrant C |
| Plot type | Count rate plots | Images |
|---|---|---|
| Comparison with Poisson distribution Blue bars denote a histogram of data divided into 1 sec bins. Red curve is a Poisson curve with rate = median count rate of data. |
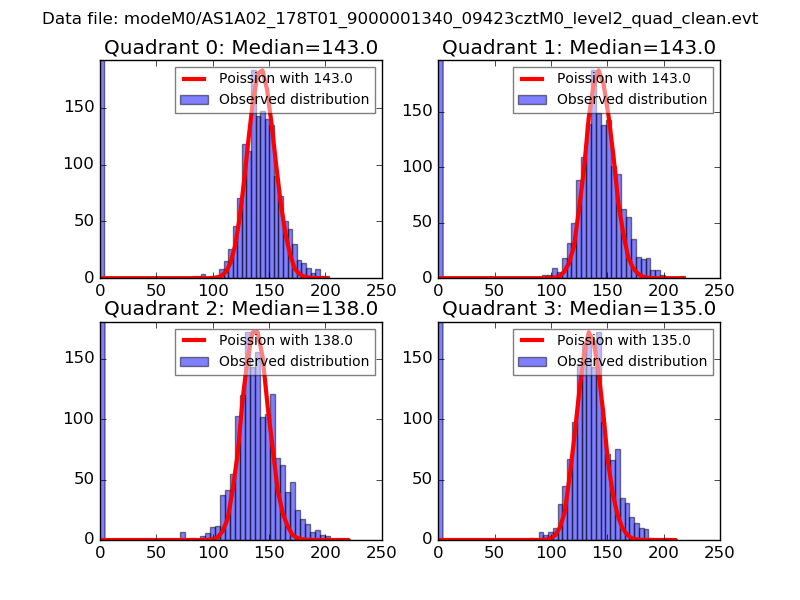 |
 |
| Quadrant-wise count rates Data is divided into 100 sec bins |
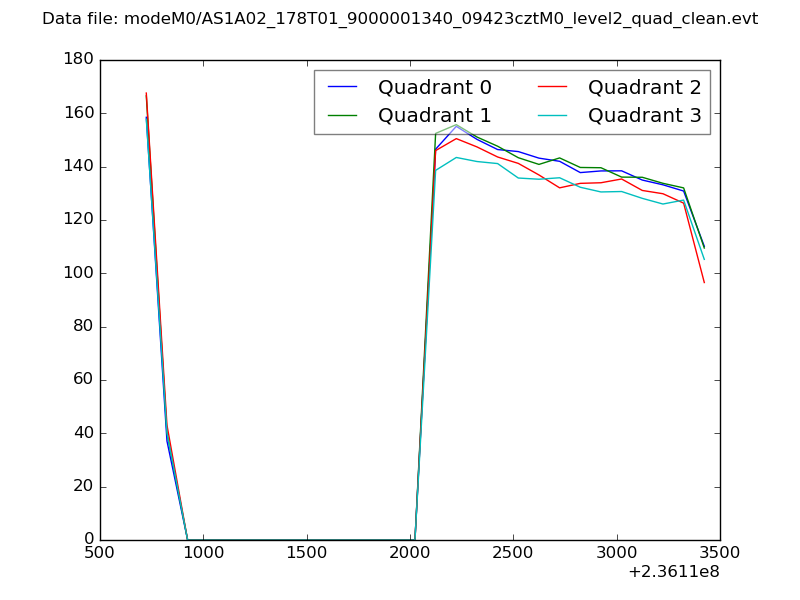 |
|
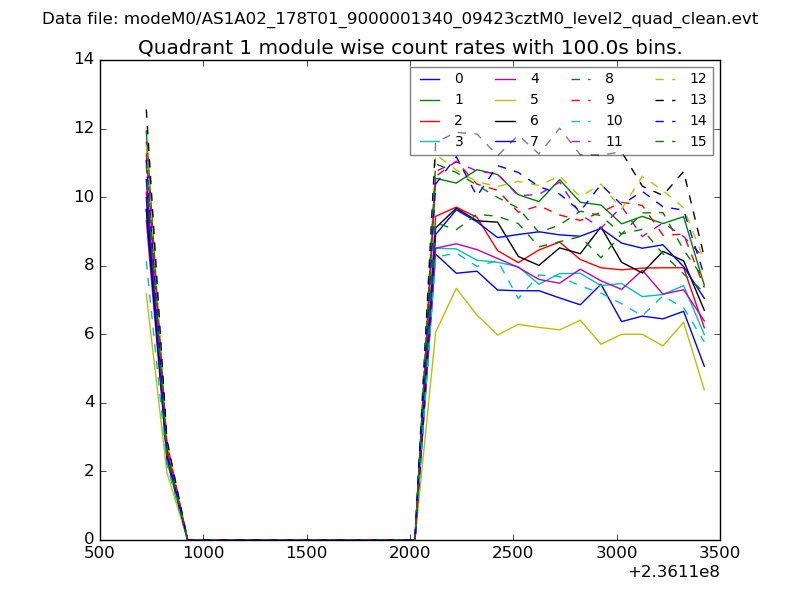
| Module-wise count rates for Quadrant A Data is divided into 100 sec bins |
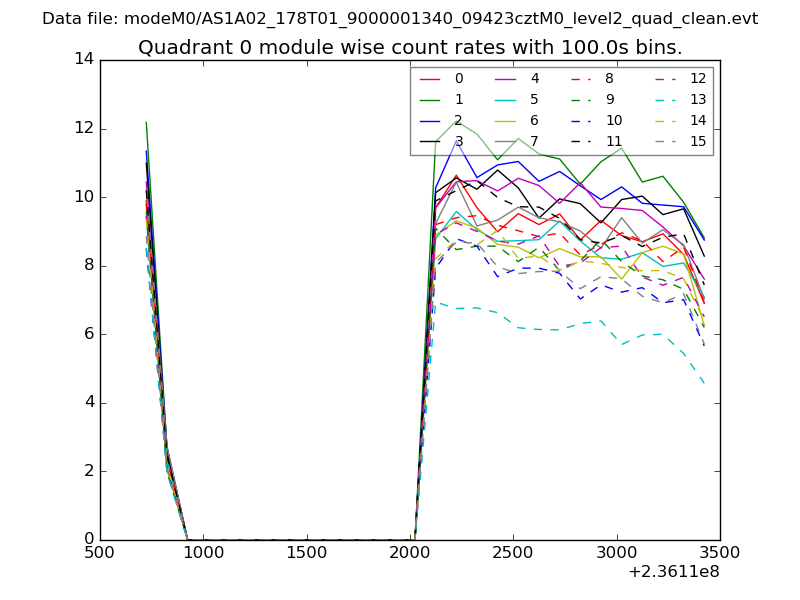 |
 |
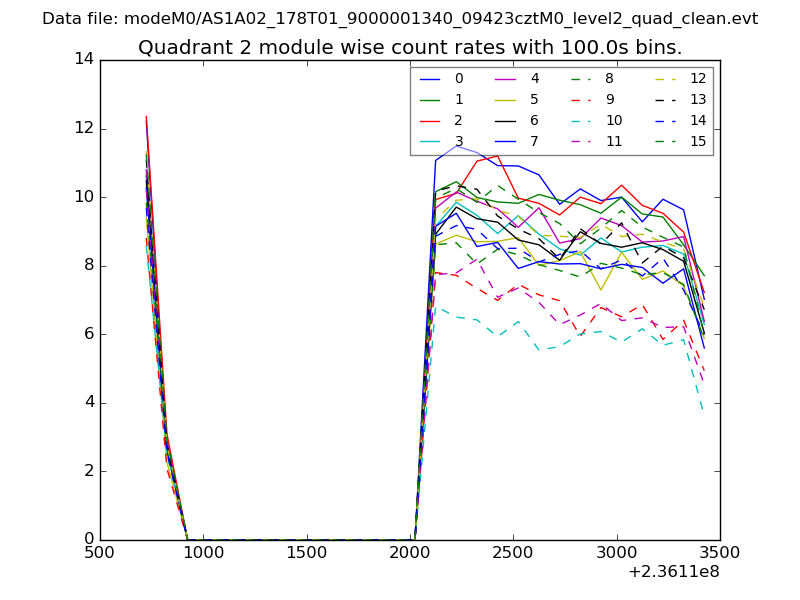
| Module-wise count rates for Quadrant B Data is divided into 100 sec bins |
 |
 |
| Module-wise count rates for Quadrant C Data is divided into 100 sec bins |
 |
 |
| Module-wise count rates for Quadrant D Data is divided into 100 sec bins |
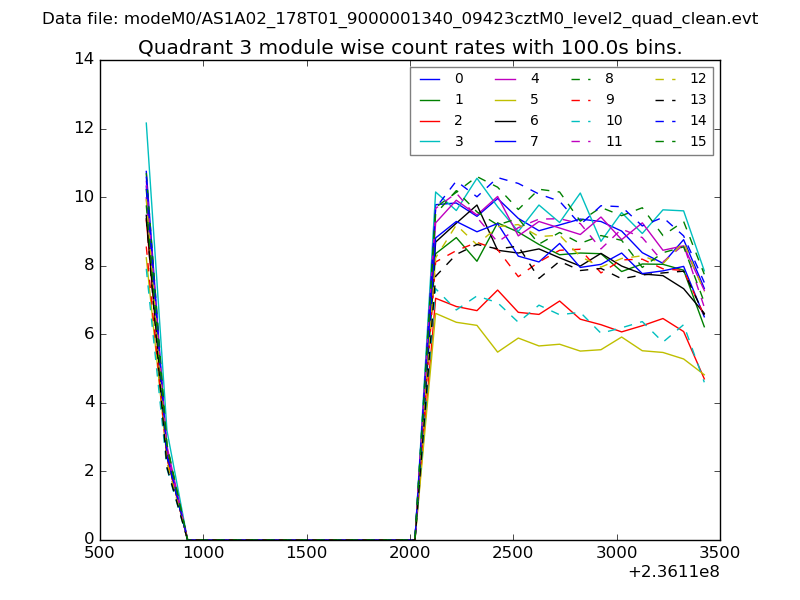 |
 |
| Parameter | Plot |
|---|---|
| CZT HV Monitor | 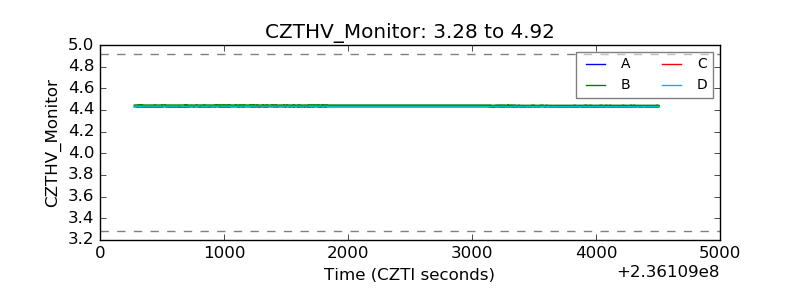 |
| D_VDD | 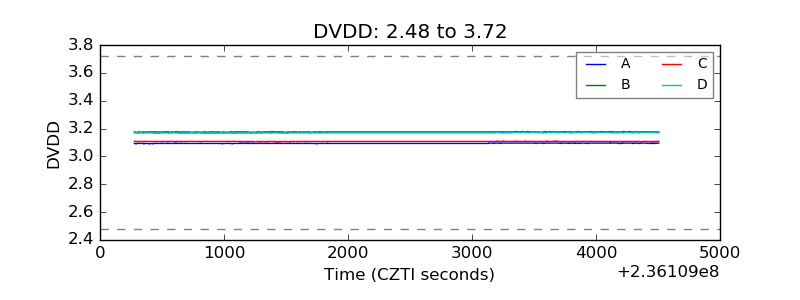 |
| Temperature 1 | 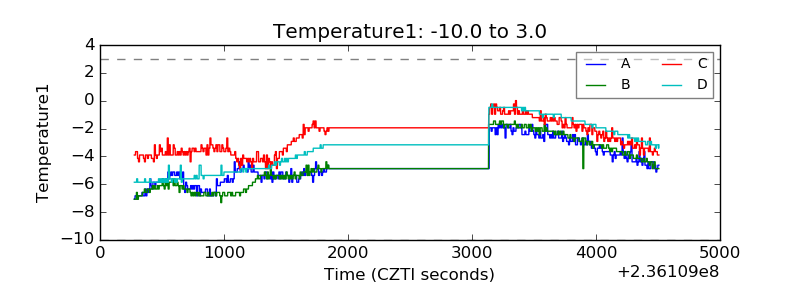 |
| Veto HV Monitor |  |
| Veto LLD | 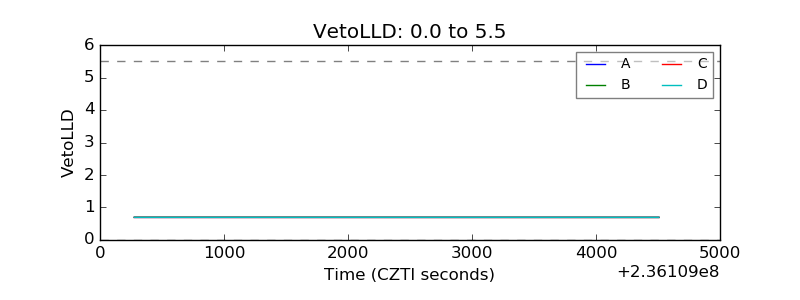 |
| Alpha Counter | 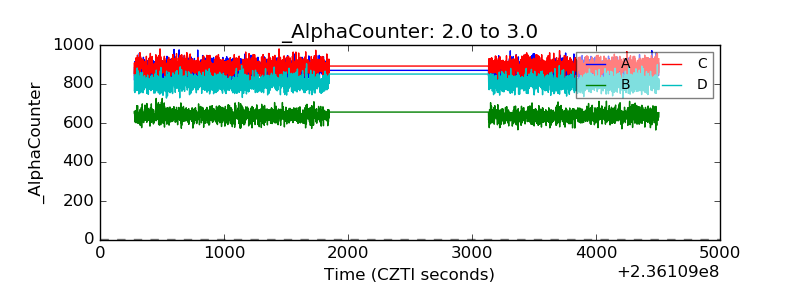 |
| _CPM_Rate | 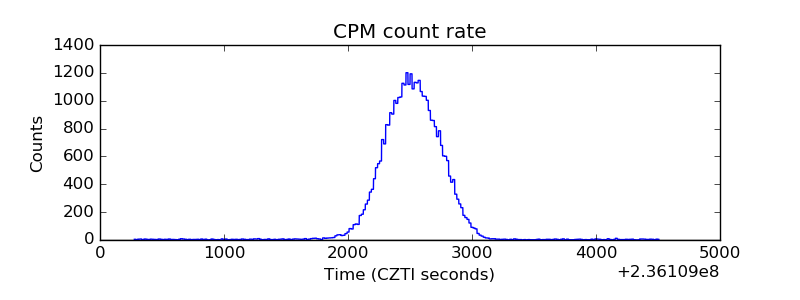 |
| CZT Counter | 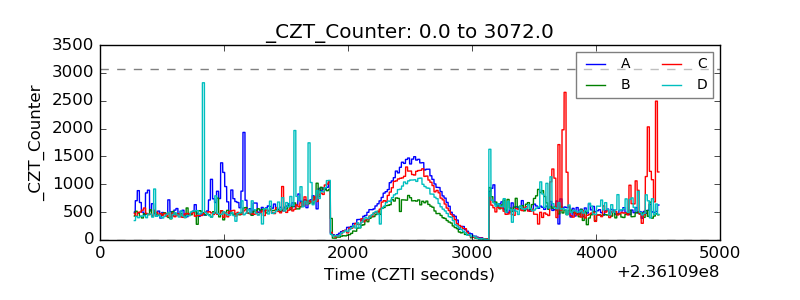 |
| +2.5 Volts monitor |  |
| +5 Volts monitor | 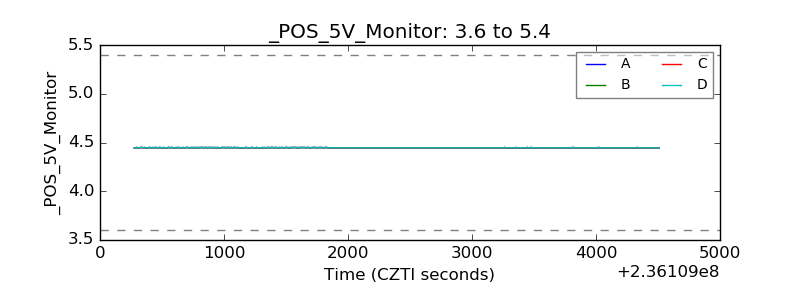 |
| _ROLL_ROT | 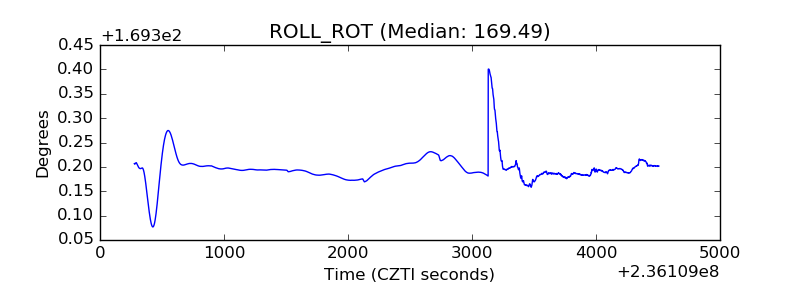 |
| _Roll_DEC | 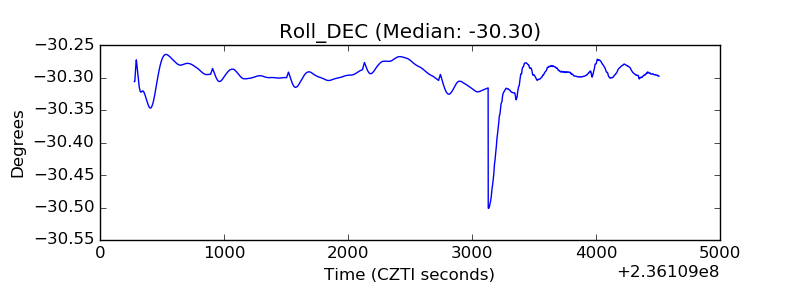 |
| _Roll_RA | 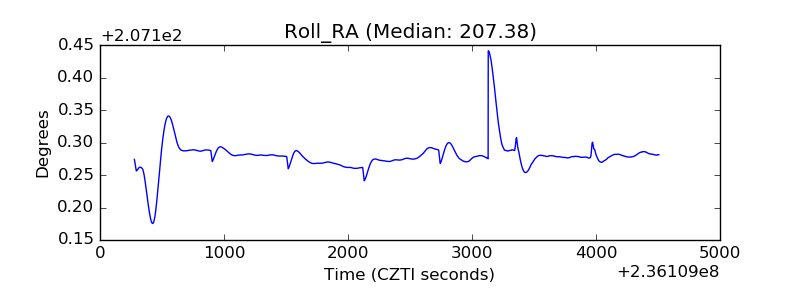 |
| Veto Counter | 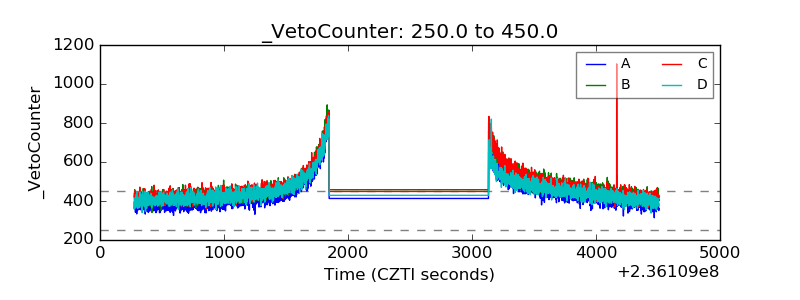 |