| Param | Original file | Final file |
|---|---|---|
| Filename | modeM0/AS1A02_178T01_9000001340_09426cztM0_level2.evt | modeM0/AS1A02_178T01_9000001340_09426cztM0_level2_quad_clean.evt |
| Size (bytes) | 356,578,560 | 59,002,560 |
| Size | 340.1 MB | 56.3 MB |
| Events in quadrant A | 2,302,970 | 419,644 |
| Events in quadrant B | 2,190,192 | 412,285 |
| Events in quadrant C | 3,760,971 | 240,025 |
| Events in quadrant D | 2,249,497 | 410,204 |
| Mode SS | |||
|---|---|---|---|
| Quadrant | BADHDUFLAG | Total packets | Discarded packets |
| A | 0 | 156 | 60 |
| B | 0 | 154 | 45 |
| C | 0 | 155 | 53 |
| D | 0 | 156 | 54 |
| Mode M0 | |||
|---|---|---|---|
| Quadrant | BADHDUFLAG | Total packets | Discarded packets |
| A | 0 | 16612 | 6831 |
| B | 0 | 16020 | 6545 |
| C | 0 | 39313 | 25956 |
| D | 0 | 16273 | 6356 |
| Mode M9 | |||
|---|---|---|---|
| Quadrant | BADHDUFLAG | Total packets | Discarded packets |
| A | 0 | 12 | 4 |
| B | 0 | 12 | 5 |
| C | 0 | 12 | 6 |
| D | 0 | 12 | 2 |
| Quadrant | Total seconds | Saturated seconds | Saturation percentage |
|---|---|---|---|
| A | 4595 | 25 | 0.544070% |
| B | 4559 | 21 | 0.460627% |
| C | 3149 | 1183 | 37.567482% |
| D | 4685 | 20 | 0.426894% |
Noise dominated data is calculated using 1-second bins in cleaned event files. If a bin has >2000 counts, and if more than 50% of those come from <1% of pixels, then it is considered to be noise-dominated and hence unusable.
| Quadrant | # 1 sec bins | Bins with >0 counts | Bins with >2000 counts | High rate bins dominated by noise | Noise dominated (total time) | Noise dominated (detector-on time) | Marked lightcurve |
|---|---|---|---|---|---|---|---|
| A | 8792 | 6016 | 2 | 2 | 0.02% | 0.03% | 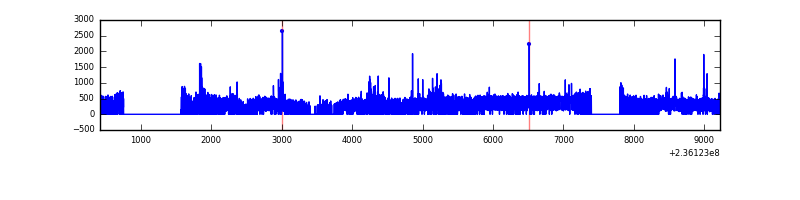 |
| B | 8800 | 5965 | 0 | 0 | 0.00% | 0.00% | 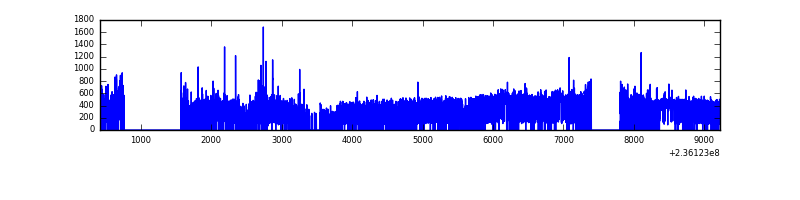 |
| C | 8800 | 4069 | 556 | 556 | 6.32% | 13.66% | 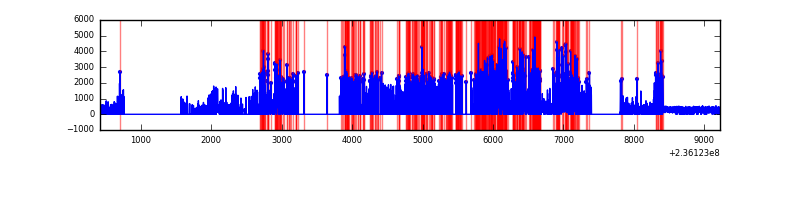 |
| D | 8796 | 6064 | 10 | 10 | 0.11% | 0.16% | 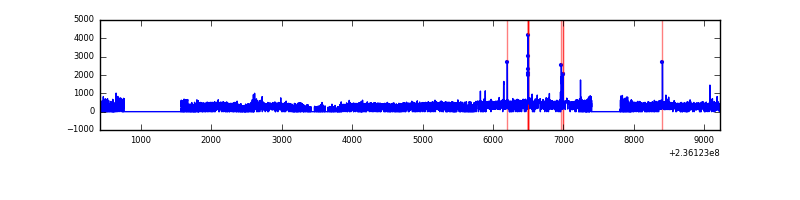 |
Top three noisy pixels from each quadrant. If the there are fewer than three noisy pixels in the level2.evt file, extra rows are filled as -1
| Pixel properties | Quadrant properties | ||||||
|---|---|---|---|---|---|---|---|
| Quadrant | DetID | PixID | Counts | Sigma | Mean | Median | Sigma |
| A | 8 | 5 | 112760 | 999.34 | 541 | 529 | 112.3 |
| A | 4 | 2 | 83856 | 741.97 | 541 | 529 | 112.3 |
| A | 1 | 162 | 13650 | 116.83 | 541 | 529 | 112.3 |
| B | 0 | 214 | 33134 | 314.96 | 535 | 523 | 103.5 |
| B | 0 | 219 | 18484 | 173.47 | 535 | 523 | 103.5 |
| B | 10 | 252 | 14739 | 137.3 | 535 | 523 | 103.5 |
| C | 4 | 254 | 2743770 | 45102.65 | 256 | 257 | 60.8 |
| C | 9 | 68 | 10590 | 169.87 | 256 | 257 | 60.8 |
| C | 14 | 234 | 3270 | 49.53 | 256 | 257 | 60.8 |
| D | 8 | 195 | 104651 | 775.74 | 529 | 516 | 134.2 |
| D | 7 | 71 | 48859 | 360.12 | 529 | 516 | 134.2 |
| D | 2 | 234 | 23755 | 173.12 | 529 | 516 | 134.2 |
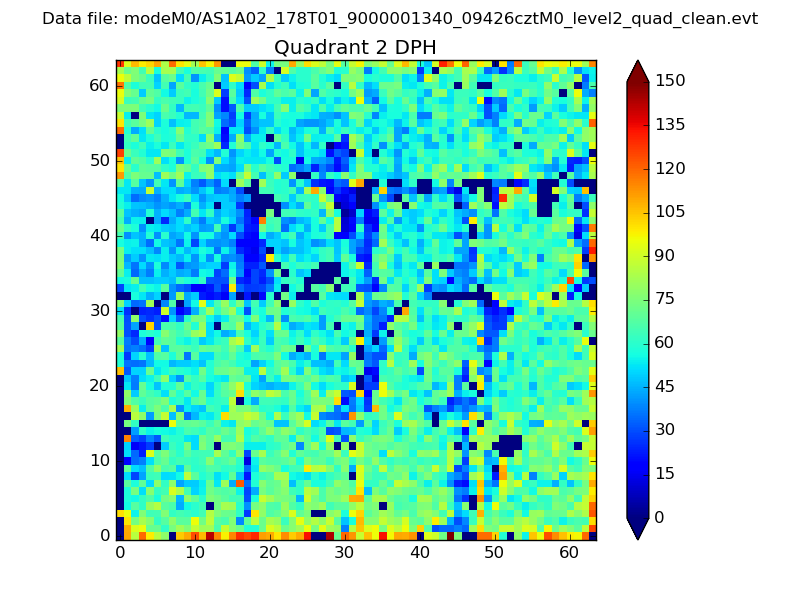
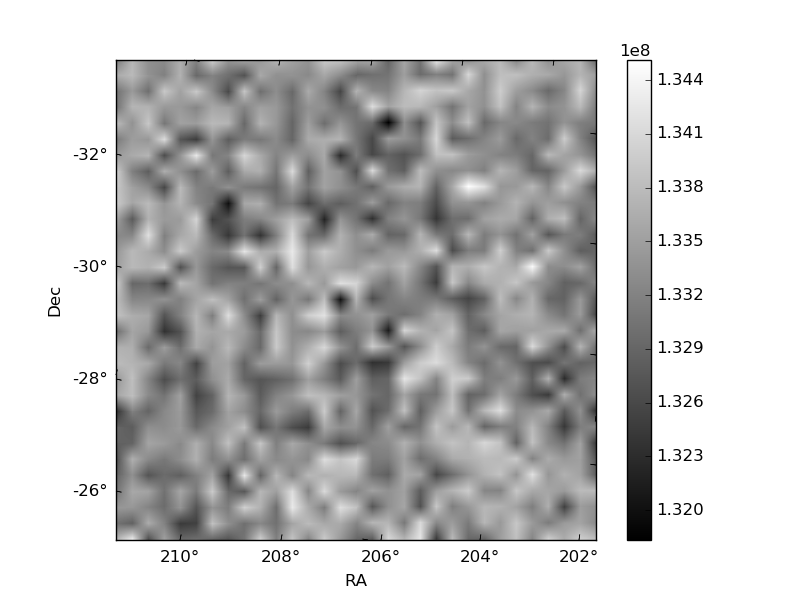
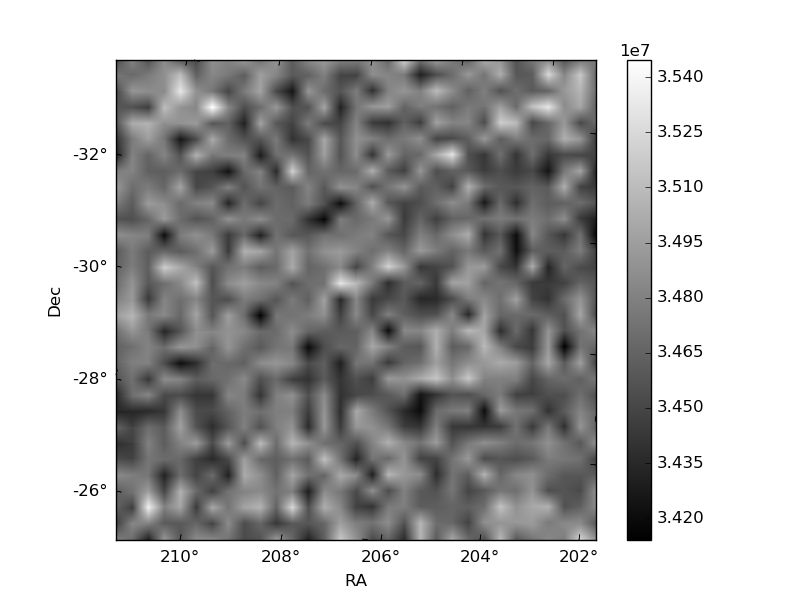
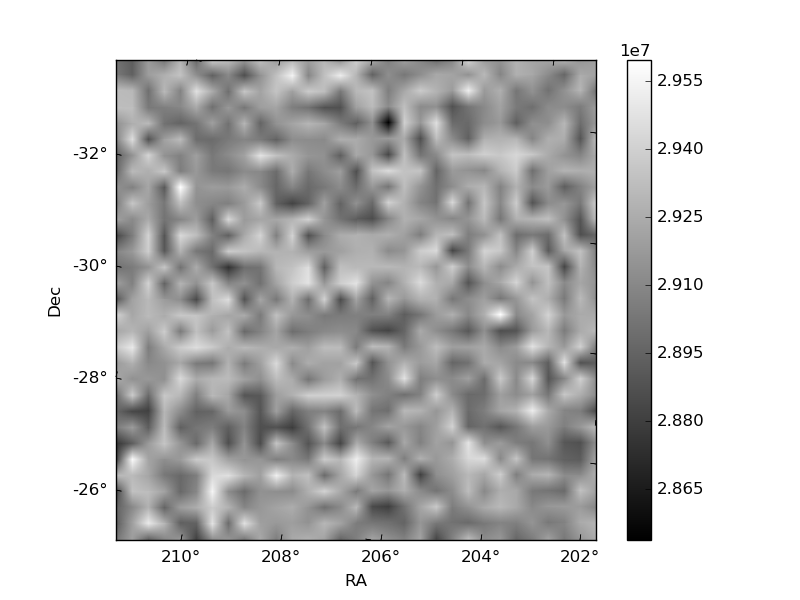
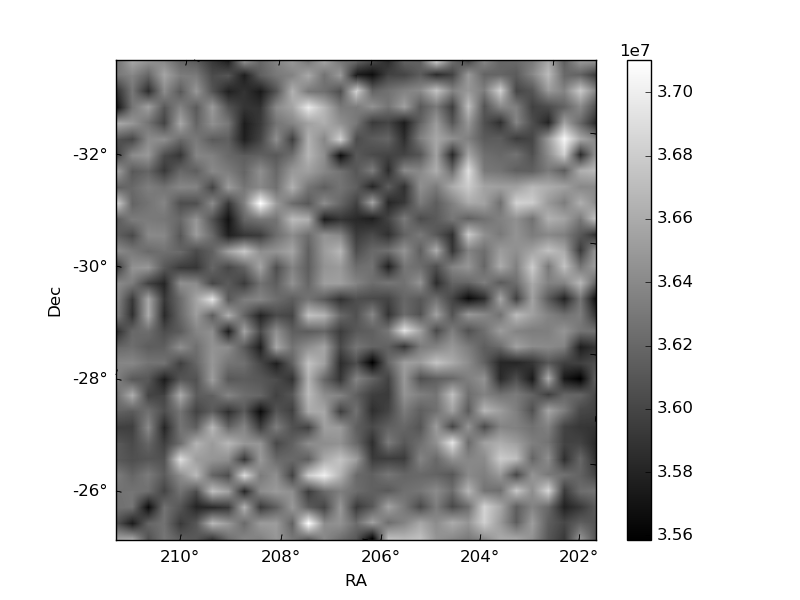
Histogram calculated using DETX and DETY for each event in the final _common_clean file
| Quadrant A | 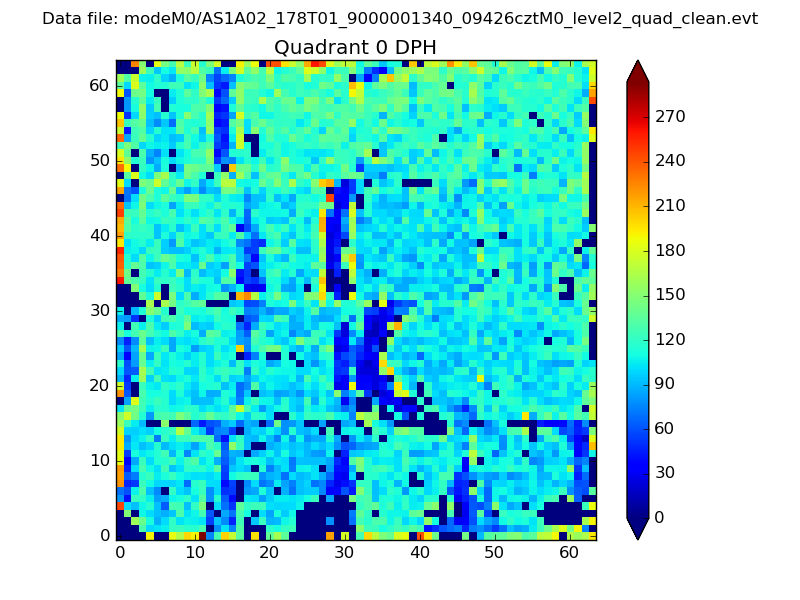 |
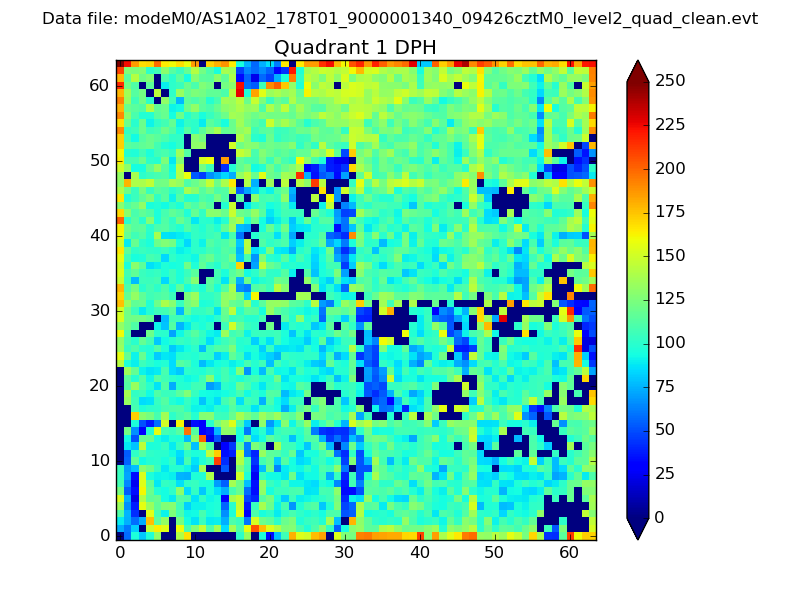 |
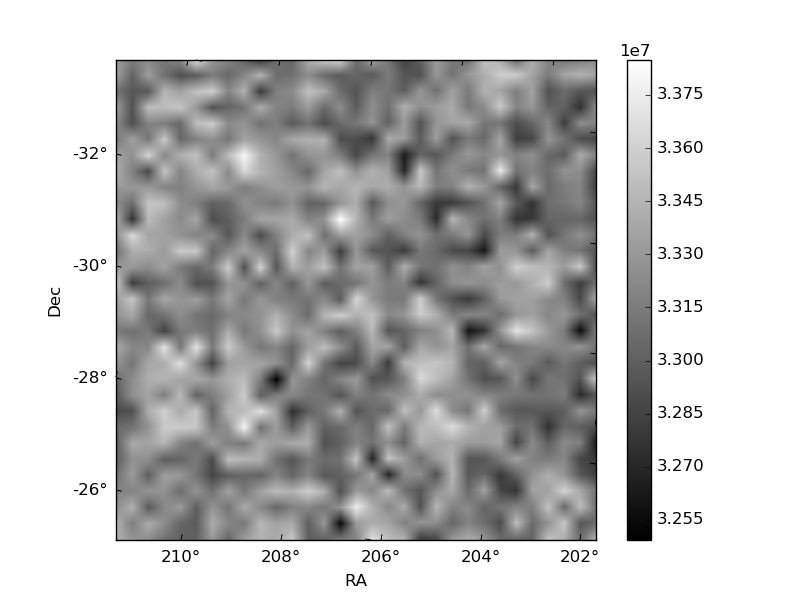
Quadrant B |
|---|---|---|---|
| Quadrant D | 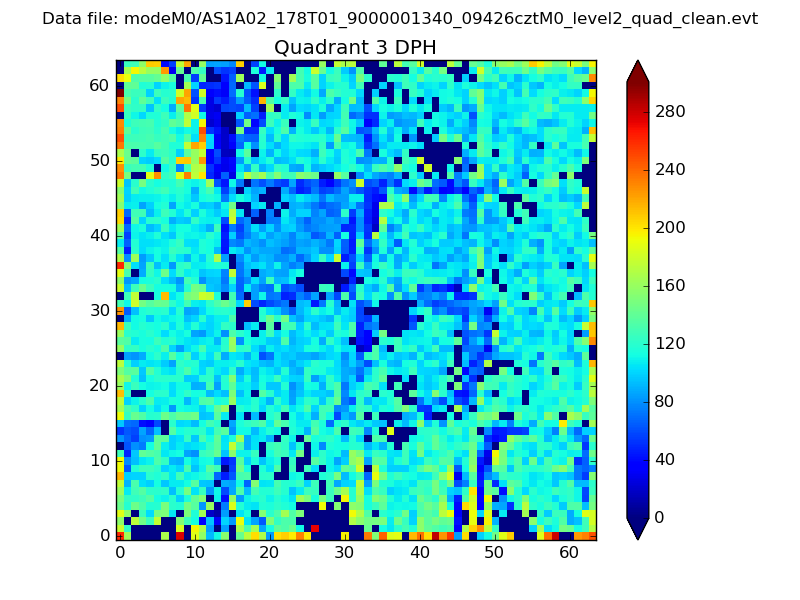 |
 |
Quadrant C |
| Plot type | Count rate plots | Images |
|---|---|---|
| Comparison with Poisson distribution Blue bars denote a histogram of data divided into 1 sec bins. Red curve is a Poisson curve with rate = median count rate of data. |
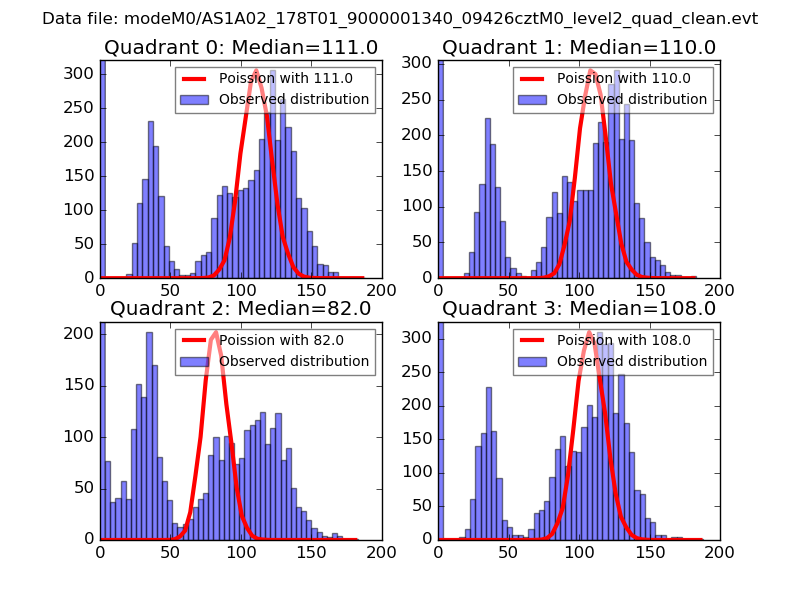 |
 |
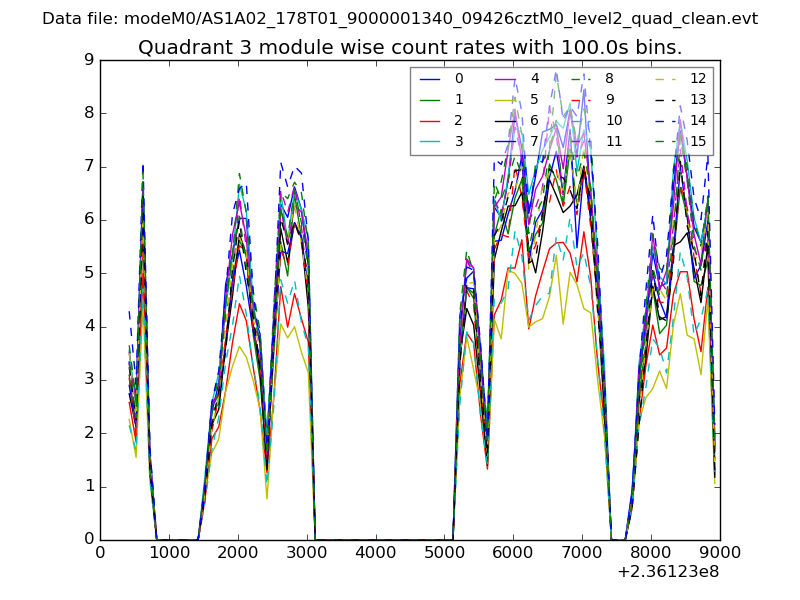
| Quadrant-wise count rates Data is divided into 100 sec bins |
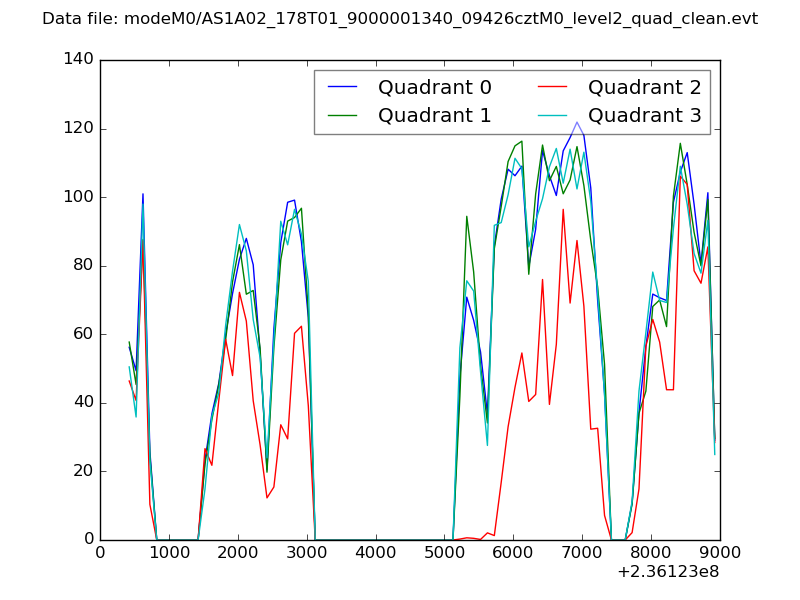 |
|
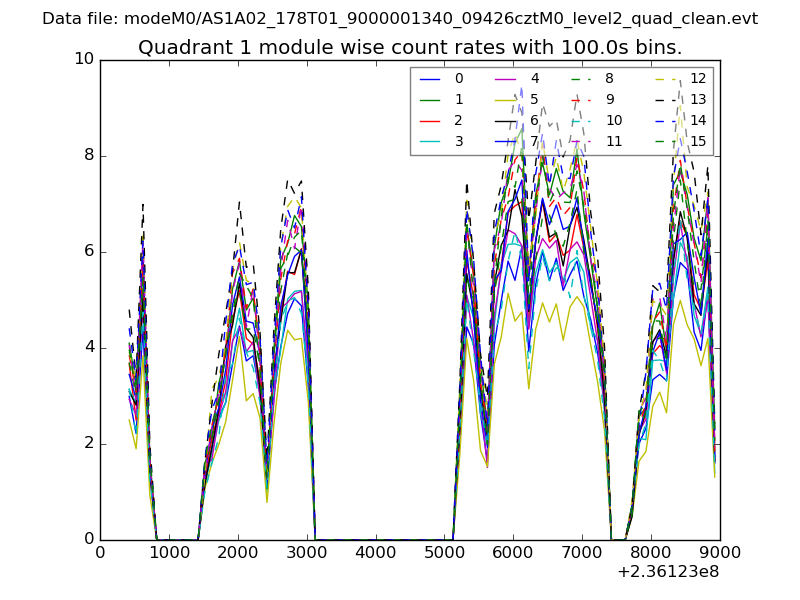
| Module-wise count rates for Quadrant A Data is divided into 100 sec bins |
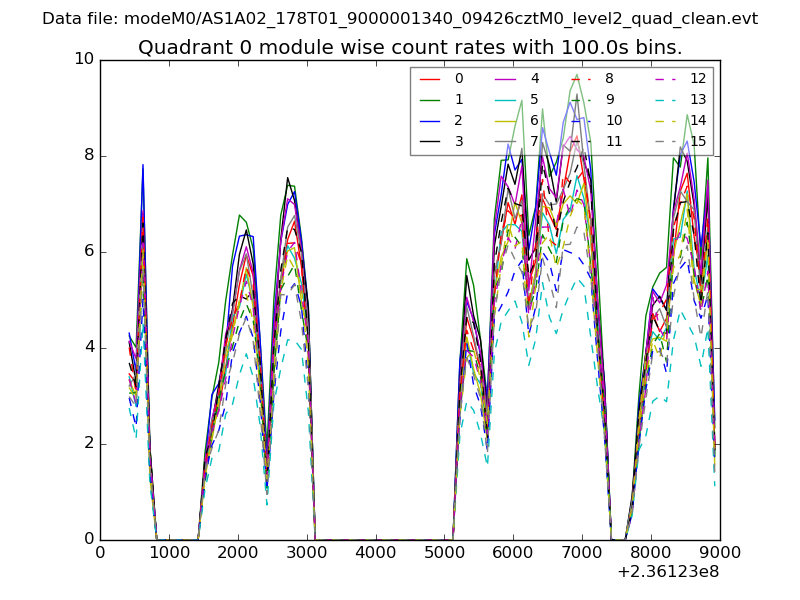 |
 |
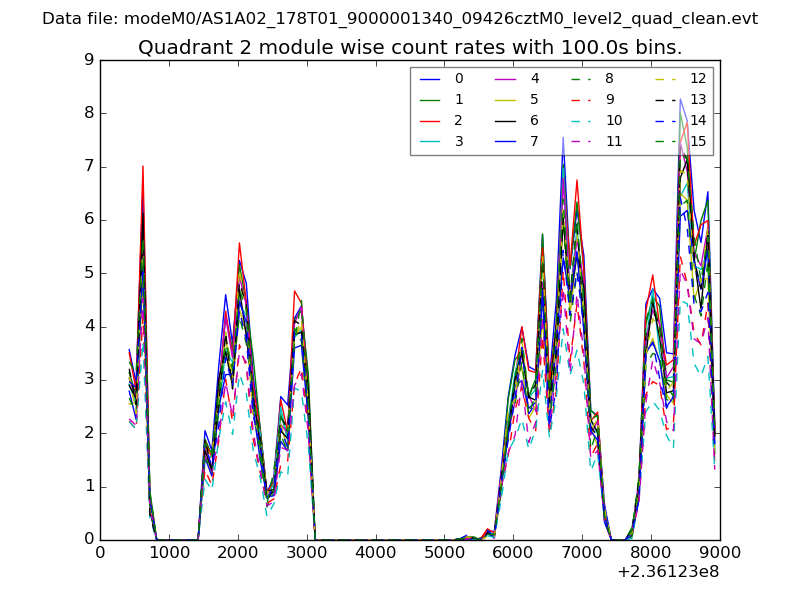
| Module-wise count rates for Quadrant B Data is divided into 100 sec bins |
 |
 |
| Module-wise count rates for Quadrant C Data is divided into 100 sec bins |
 |
 |
| Module-wise count rates for Quadrant D Data is divided into 100 sec bins |
 |
 |
| Parameter | Plot |
|---|---|
| CZT HV Monitor | 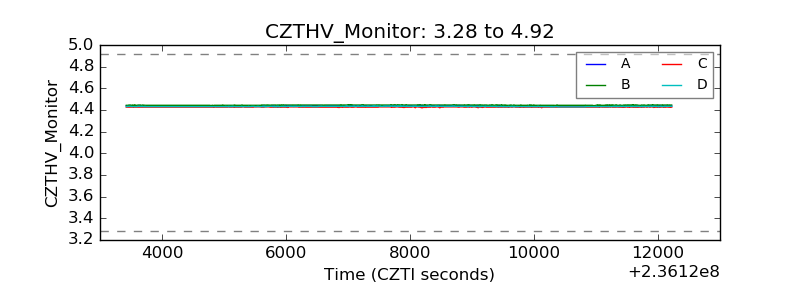 |
| D_VDD | 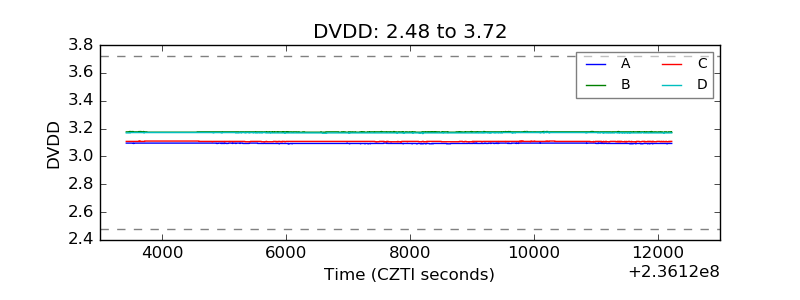 |
| Temperature 1 | 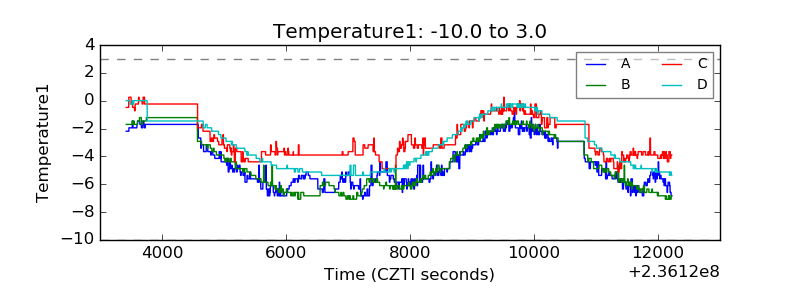 |
| Veto HV Monitor | 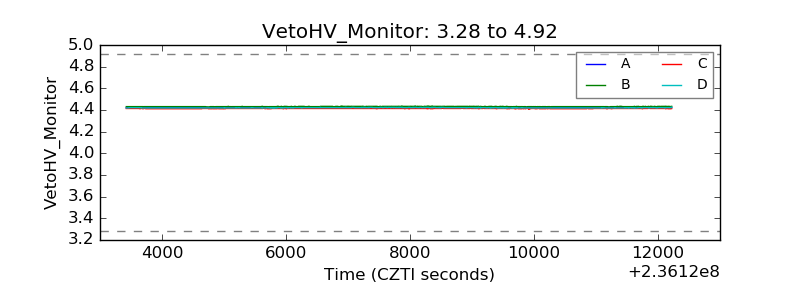 |
| Veto LLD | 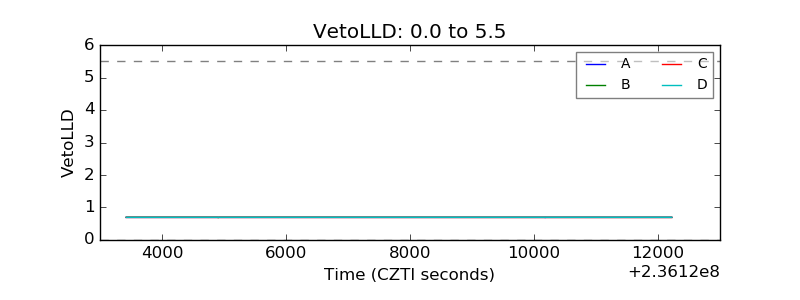 |
| Alpha Counter | 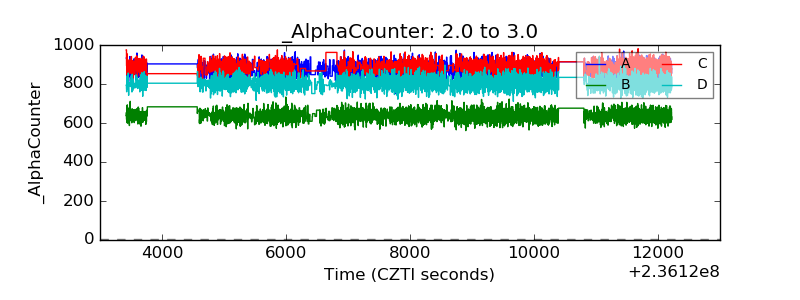 |
| _CPM_Rate | 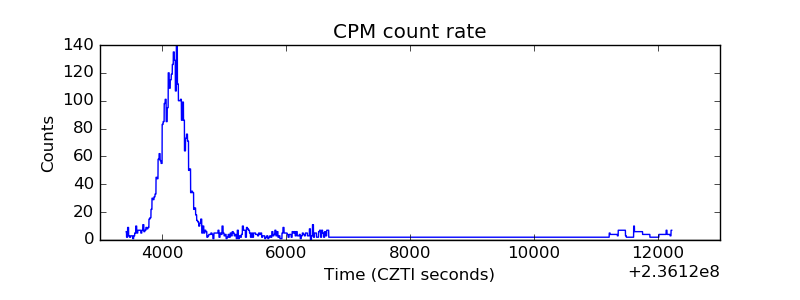 |
| CZT Counter | 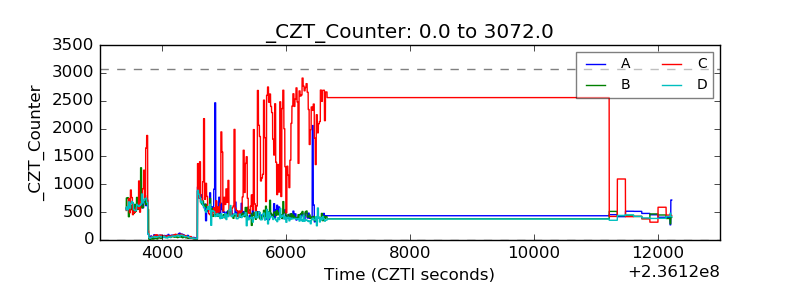 |
| +2.5 Volts monitor | 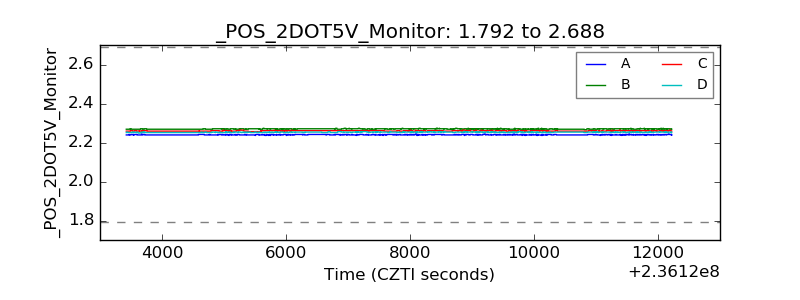 |
| +5 Volts monitor |  |
| _ROLL_ROT | 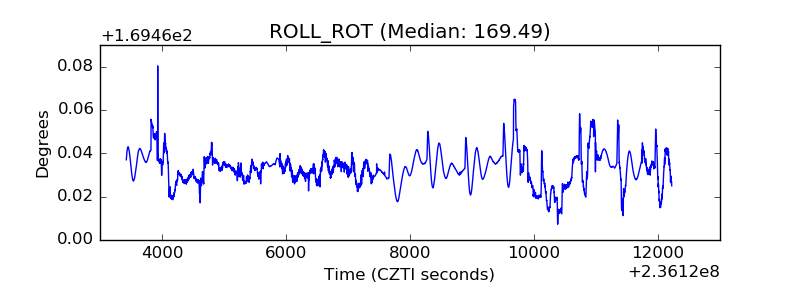 |
| _Roll_DEC | 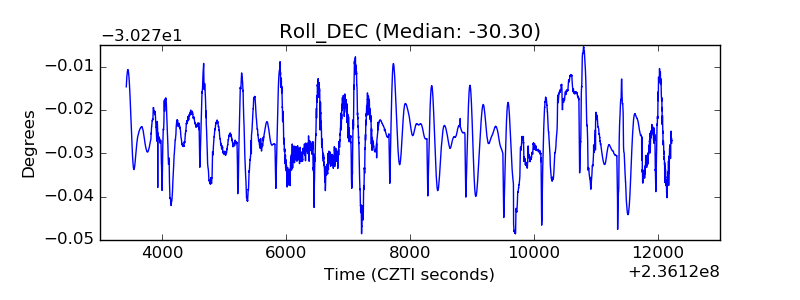 |
| _Roll_RA | 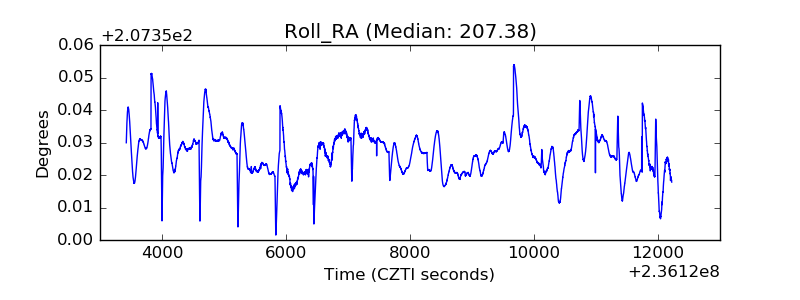 |
| Veto Counter | 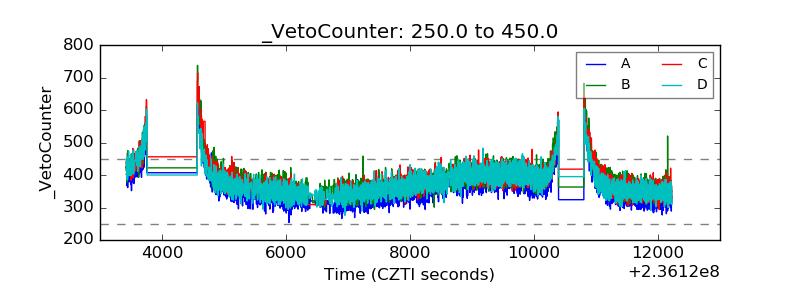 |