| Param | Original file | Final file |
|---|---|---|
| Filename | modeM0/AS1A02_178T01_9000001340_09427cztM0_level2.evt | modeM0/AS1A02_178T01_9000001340_09427cztM0_level2_quad_clean.evt |
| Size (bytes) | 1,578,974,400 | 203,362,560 |
| Size | 1.5 GB | 193.9 MB |
| Events in quadrant A | 9,000,651 | 1,299,250 |
| Events in quadrant B | 8,358,934 | 1,317,865 |
| Events in quadrant C | 20,803,799 | 1,071,475 |
| Events in quadrant D | 8,478,363 | 1,267,869 |
| Mode SS | |||
|---|---|---|---|
| Quadrant | BADHDUFLAG | Total packets | Discarded packets |
| A | 0 | 370 | 26 |
| B | 0 | 370 | 16 |
| C | 0 | 370 | 10 |
| D | 0 | 370 | 14 |
| Mode M0 | |||
|---|---|---|---|
| Quadrant | BADHDUFLAG | Total packets | Discarded packets |
| A | 0 | 40867 | 2548 |
| B | 0 | 38325 | 1738 |
| C | 0 | 76673 | 2664 |
| D | 0 | 39158 | 1988 |
| Mode M9 | |||
|---|---|---|---|
| Quadrant | BADHDUFLAG | Total packets | Discarded packets |
| A | 0 | 15 | 1 |
| B | 0 | 15 | 0 |
| C | 0 | 15 | 2 |
| D | 0 | 15 | 1 |
| Quadrant | Total seconds | Saturated seconds | Saturation percentage |
|---|---|---|---|
| A | 17371 | 146 | 0.840481% |
| B | 17488 | 104 | 0.594694% |
| C | 17392 | 5795 | 33.319917% |
| D | 17435 | 67 | 0.384284% |
Noise dominated data is calculated using 1-second bins in cleaned event files. If a bin has >2000 counts, and if more than 50% of those come from <1% of pixels, then it is considered to be noise-dominated and hence unusable.
| Quadrant | # 1 sec bins | Bins with >0 counts | Bins with >2000 counts | High rate bins dominated by noise | Noise dominated (total time) | Noise dominated (detector-on time) | Marked lightcurve |
|---|---|---|---|---|---|---|---|
| A | 19772 | 18013 | 35 | 35 | 0.18% | 0.19% | 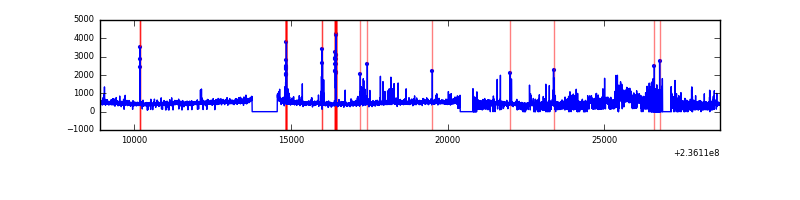 |
| B | 19772 | 18102 | 15 | 15 | 0.08% | 0.08% | 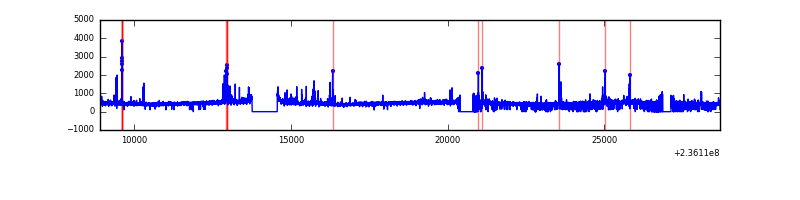 |
| C | 19772 | 18027 | 3997 | 3997 | 20.22% | 22.17% | 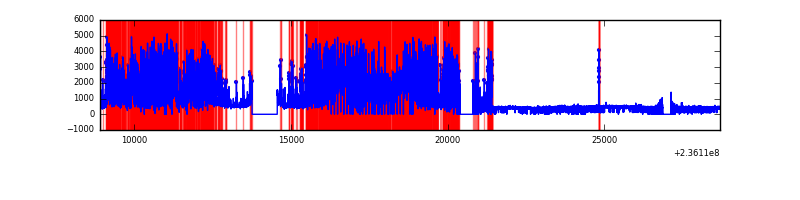 |
| D | 19772 | 18078 | 30 | 30 | 0.15% | 0.17% | 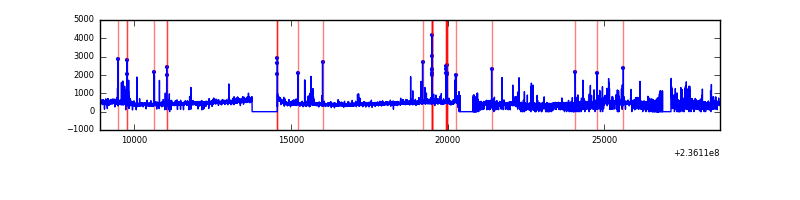 |
Top three noisy pixels from each quadrant. If the there are fewer than three noisy pixels in the level2.evt file, extra rows are filled as -1
| Pixel properties | Quadrant properties | ||||||
|---|---|---|---|---|---|---|---|
| Quadrant | DetID | PixID | Counts | Sigma | Mean | Median | Sigma |
| A | 8 | 5 | 883603 | 2169.52 | 2013 | 1971 | 406.4 |
| A | 4 | 2 | 203097 | 494.93 | 2013 | 1971 | 406.4 |
| A | 1 | 162 | 55965 | 132.87 | 2013 | 1971 | 406.4 |
| B | 0 | 214 | 107889 | 275.96 | 2031 | 1984 | 383.8 |
| B | 0 | 219 | 74428 | 188.77 | 2031 | 1984 | 383.8 |
| B | 4 | 80 | 59777 | 150.59 | 2031 | 1984 | 383.8 |
| C | 4 | 254 | 14718184 | 42064.04 | 1522 | 1528 | 349.9 |
| C | 9 | 68 | 104836 | 295.28 | 1522 | 1528 | 349.9 |
| C | 14 | 234 | 34692 | 94.79 | 1522 | 1528 | 349.9 |
| D | 8 | 195 | 563919 | 1165.99 | 1942 | 1894 | 482.0 |
| D | 7 | 71 | 155951 | 319.61 | 1942 | 1894 | 482.0 |
| D | 1 | 52 | 124541 | 254.45 | 1942 | 1894 | 482.0 |
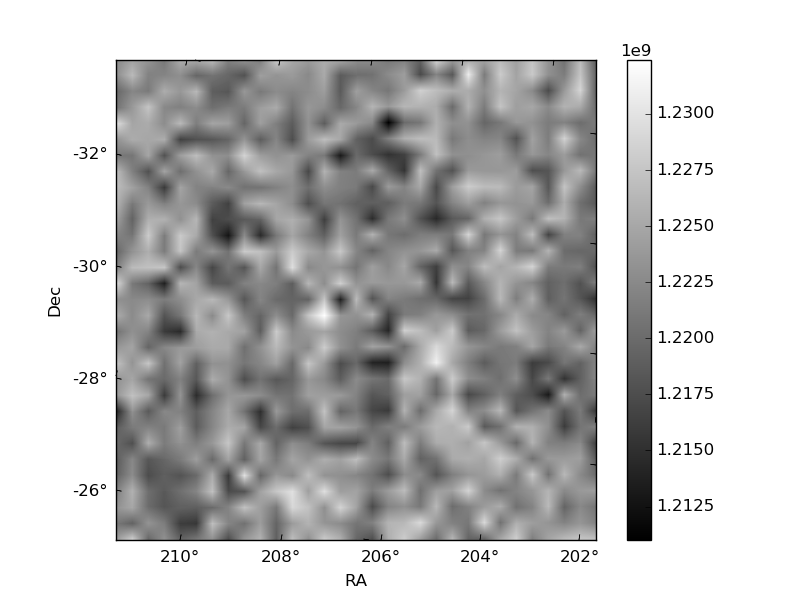
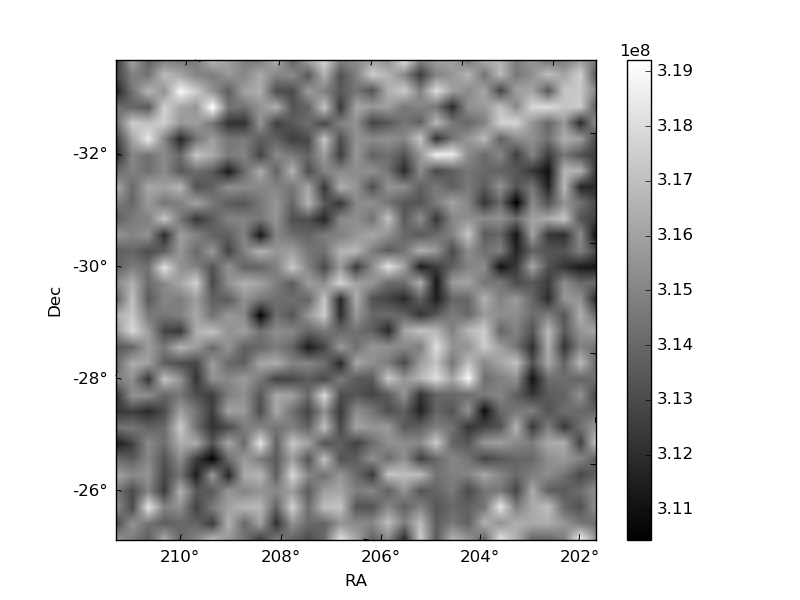
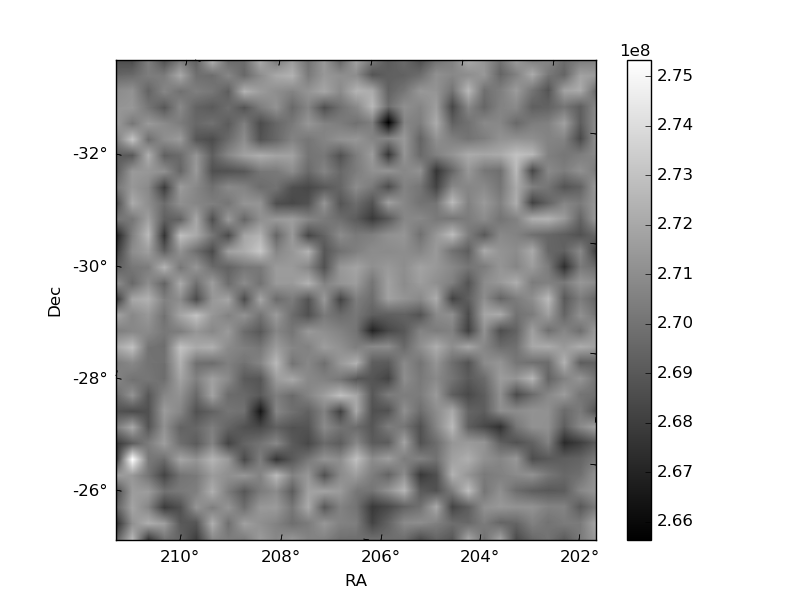
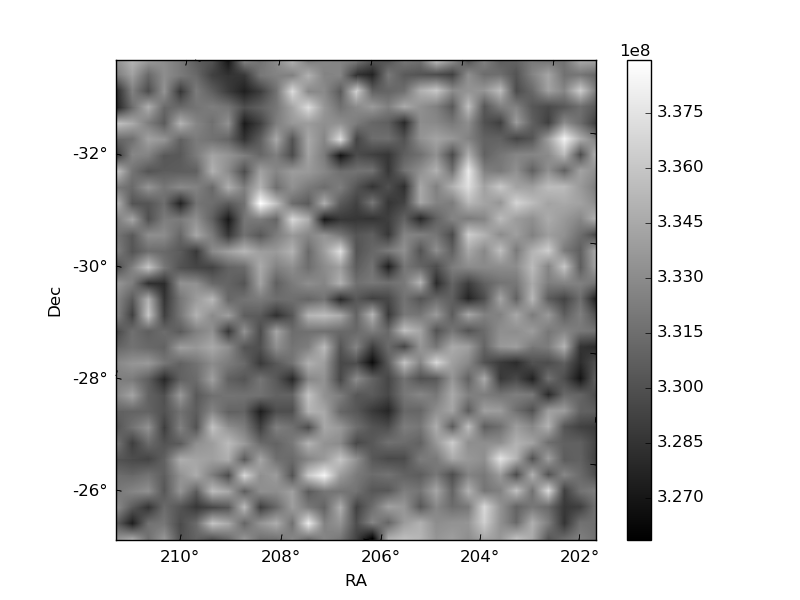
Histogram calculated using DETX and DETY for each event in the final _common_clean file
| Quadrant A | 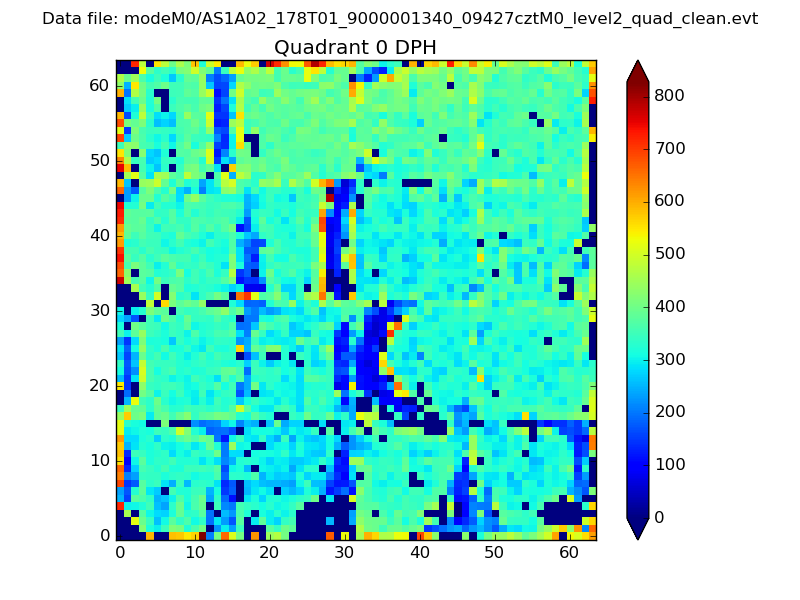 |
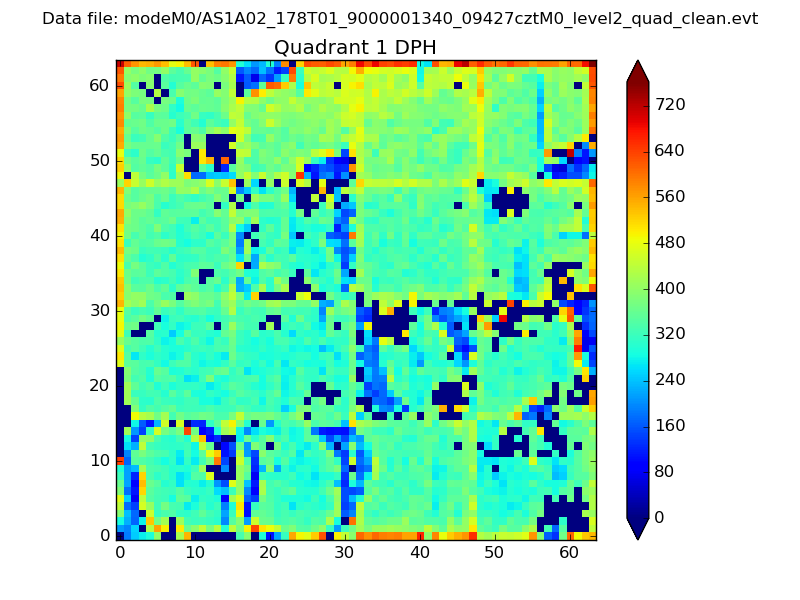 |
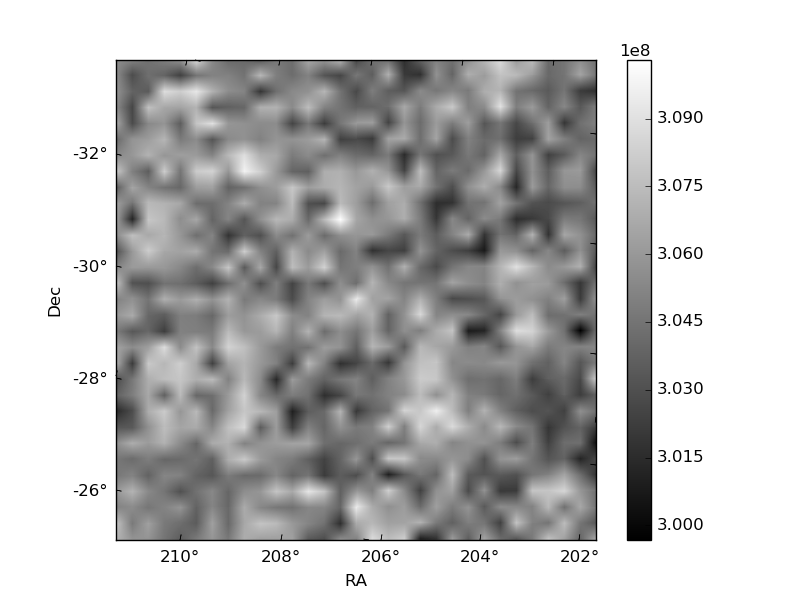
Quadrant B |
|---|---|---|---|
| Quadrant D | 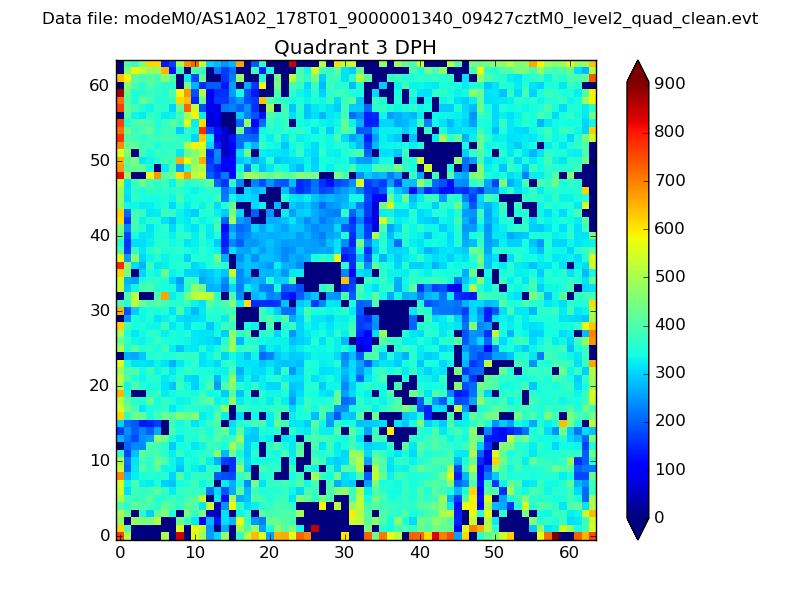 |
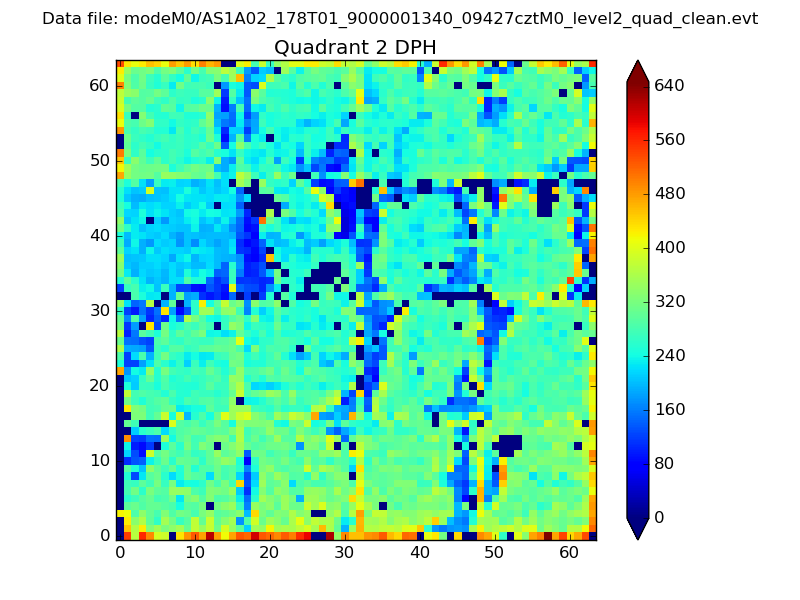 |
Quadrant C |
| Plot type | Count rate plots | Images |
|---|---|---|
| Comparison with Poisson distribution Blue bars denote a histogram of data divided into 1 sec bins. Red curve is a Poisson curve with rate = median count rate of data. |
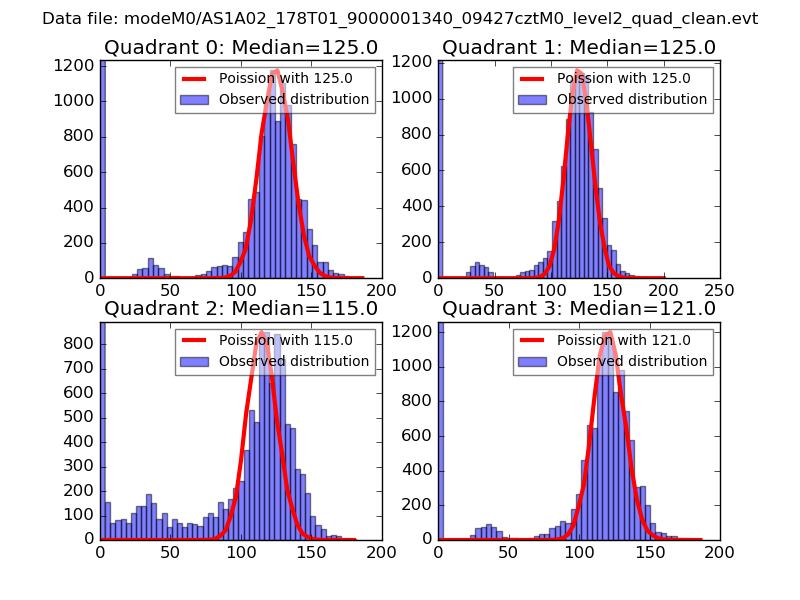 |
 |
| Quadrant-wise count rates Data is divided into 100 sec bins |
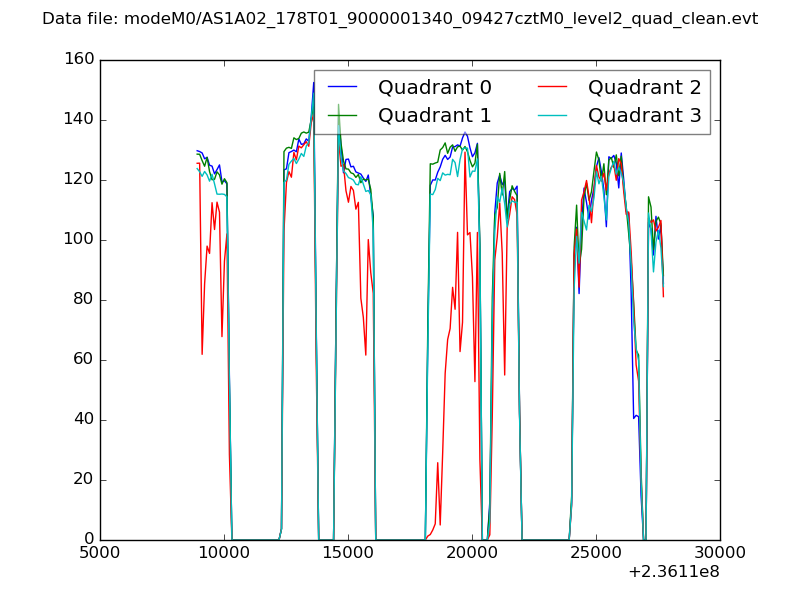 |
|
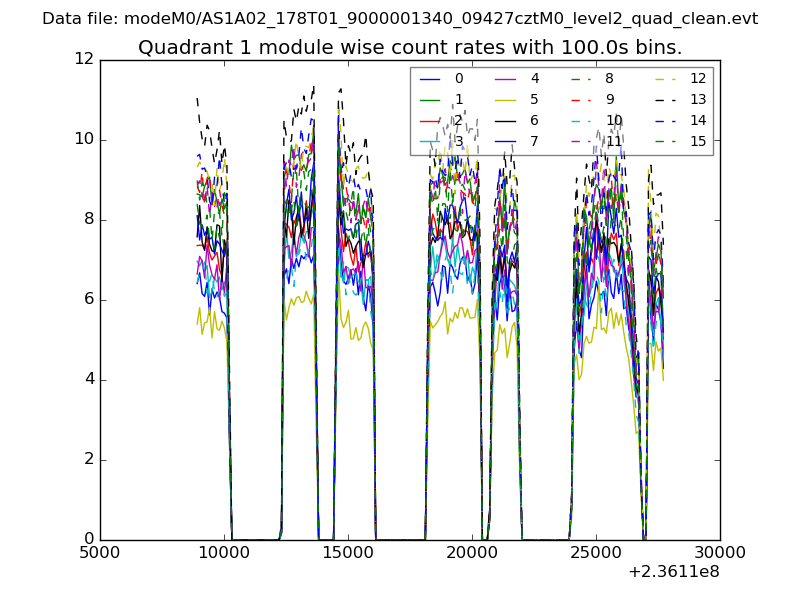
| Module-wise count rates for Quadrant A Data is divided into 100 sec bins |
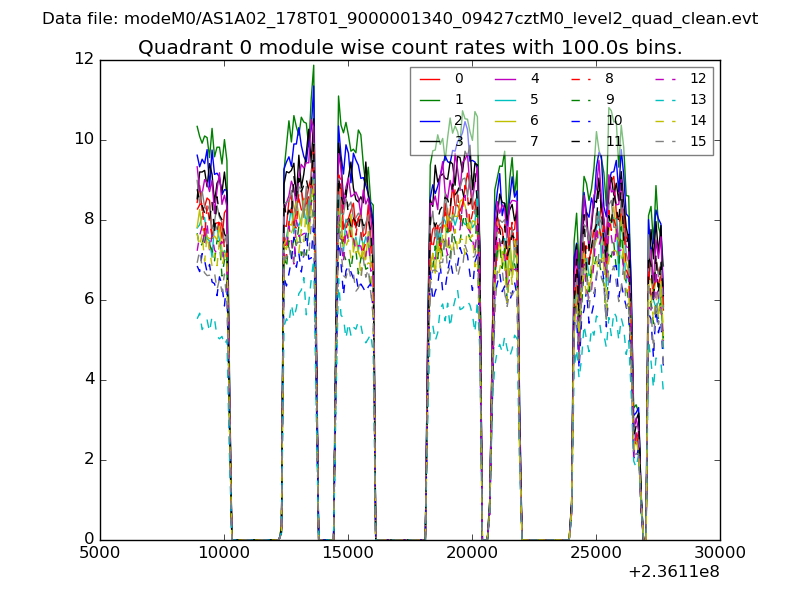 |
 |
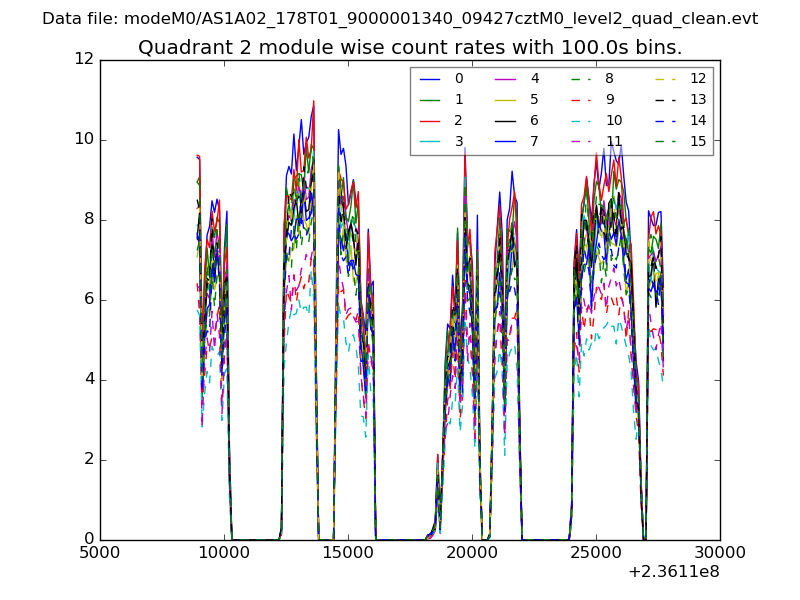
| Module-wise count rates for Quadrant B Data is divided into 100 sec bins |
 |
 |
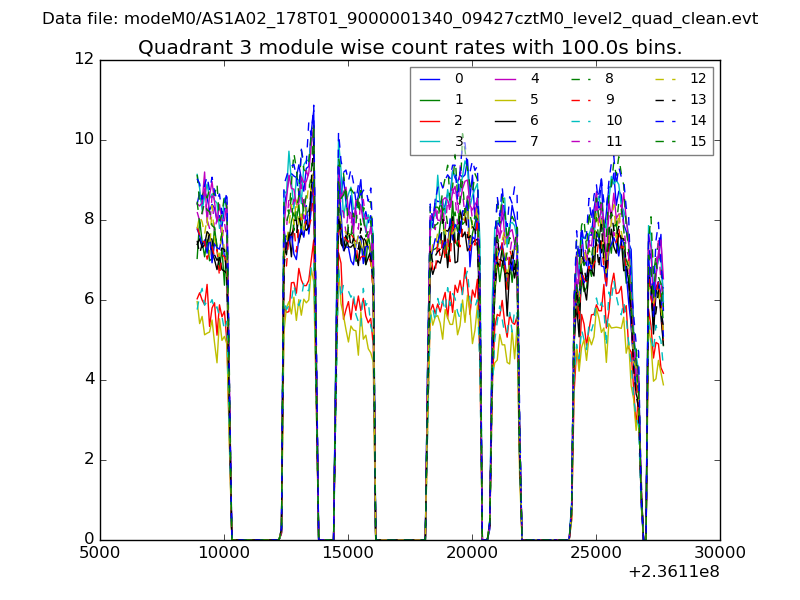
| Module-wise count rates for Quadrant C Data is divided into 100 sec bins |
 |
 |
| Module-wise count rates for Quadrant D Data is divided into 100 sec bins |
 |
 |
| Parameter | Plot |
|---|---|
| CZT HV Monitor | 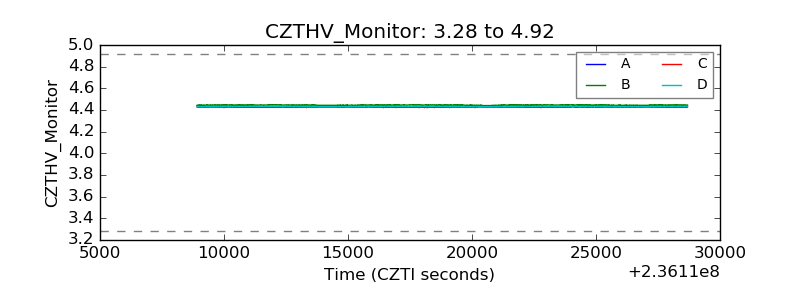 |
| D_VDD | 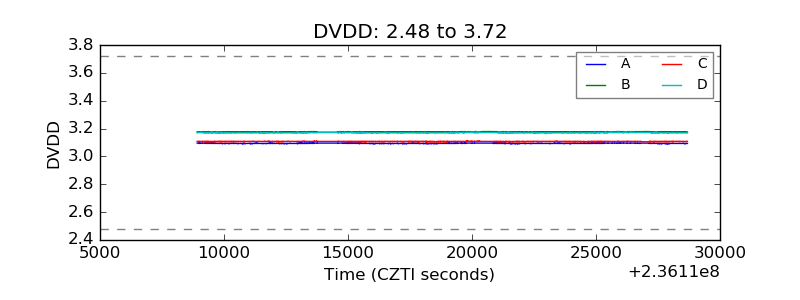 |
| Temperature 1 |  |
| Veto HV Monitor | 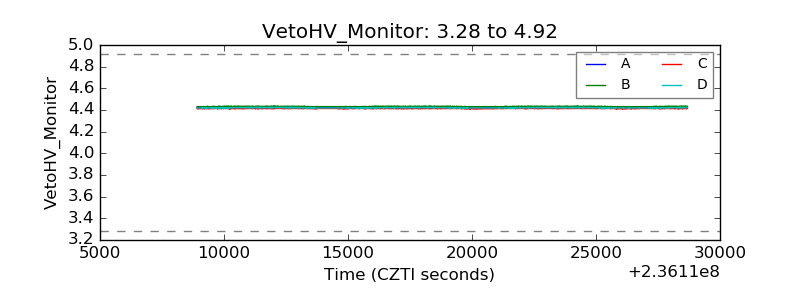 |
| Veto LLD | 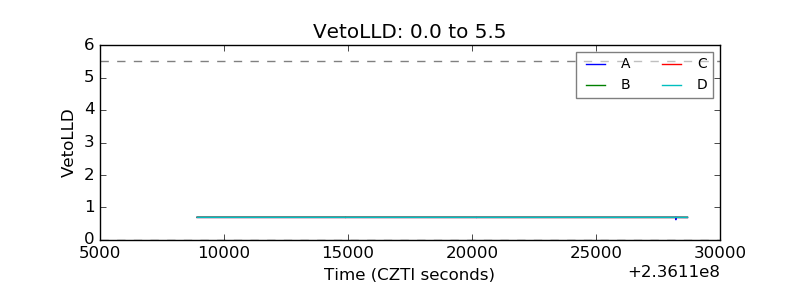 |
| Alpha Counter | 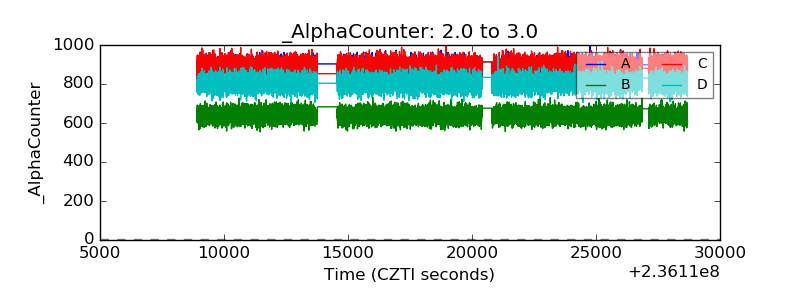 |
| _CPM_Rate | 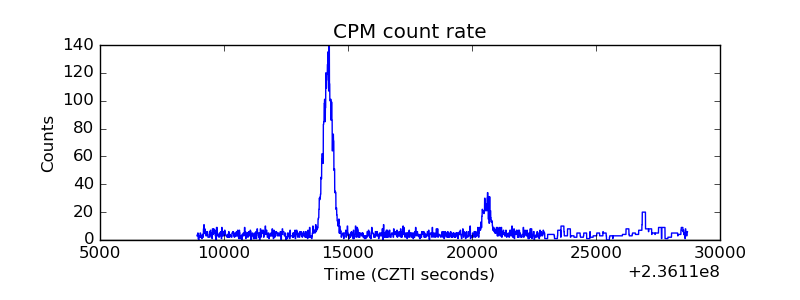 |
| CZT Counter | 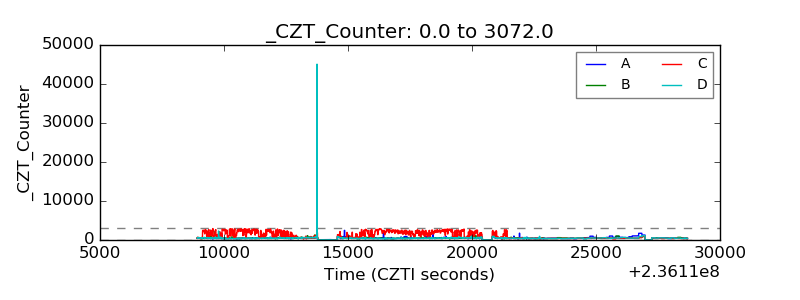 |
| +2.5 Volts monitor |  |
| +5 Volts monitor |  |
| _ROLL_ROT | 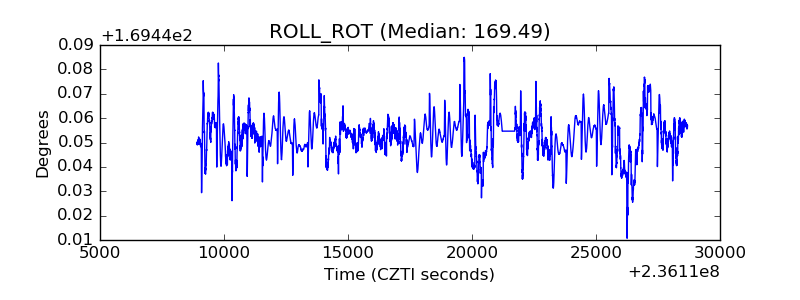 |
| _Roll_DEC |  |
| _Roll_RA | 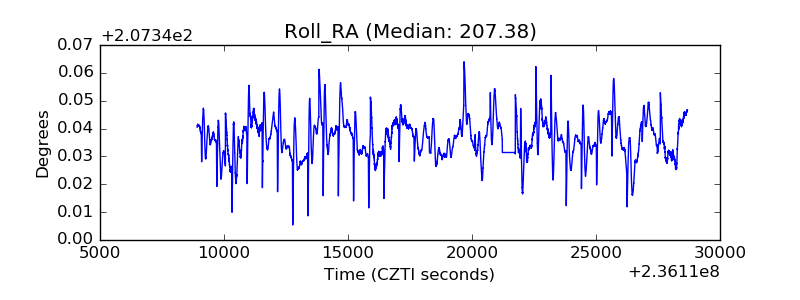 |
| Veto Counter |  |