| Param | Original file | Final file |
|---|---|---|
| Filename | modeM0/AS1A02_178T01_9000001340_09430cztM0_level2.evt | modeM0/AS1A02_178T01_9000001340_09430cztM0_level2_quad_clean.evt |
| Size (bytes) | 78,462,720 | 14,310,720 |
| Size | 74.8 MB | 13.6 MB |
| Events in quadrant A | 574,483 | 83,539 |
| Events in quadrant B | 573,205 | 85,962 |
| Events in quadrant C | 550,561 | 87,609 |
| Events in quadrant D | 591,910 | 84,082 |
| Mode SS | |||
|---|---|---|---|
| Quadrant | BADHDUFLAG | Total packets | Discarded packets |
| A | 0 | 93 | 69 |
| B | 0 | 91 | 67 |
| C | 0 | 91 | 55 |
| D | 0 | 89 | 71 |
| Mode M0 | |||
|---|---|---|---|
| Quadrant | BADHDUFLAG | Total packets | Discarded packets |
| A | 0 | 9340 | 6918 |
| B | 0 | 9233 | 6749 |
| C | 0 | 9148 | 6634 |
| D | 0 | 9554 | 6992 |
| Mode M9 | |||
|---|---|---|---|
| Quadrant | BADHDUFLAG | Total packets | Discarded packets |
| A | 0 | 3 | 1 |
| B | 0 | 4 | 0 |
| C | 0 | 4 | 2 |
| D | 0 | 3 | 1 |
| Quadrant | Total seconds | Saturated seconds | Saturation percentage |
|---|---|---|---|
| A | 1169 | 5 | 0.427716% |
| B | 1210 | 7 | 0.578512% |
| C | 1235 | 3 | 0.242915% |
| D | 1218 | 10 | 0.821018% |
Noise dominated data is calculated using 1-second bins in cleaned event files. If a bin has >2000 counts, and if more than 50% of those come from <1% of pixels, then it is considered to be noise-dominated and hence unusable.
| Quadrant | # 1 sec bins | Bins with >0 counts | Bins with >2000 counts | High rate bins dominated by noise | Noise dominated (total time) | Noise dominated (detector-on time) | Marked lightcurve |
|---|---|---|---|---|---|---|---|
| A | 5162 | 1605 | 0 | 0 | 0.00% | 0.00% | 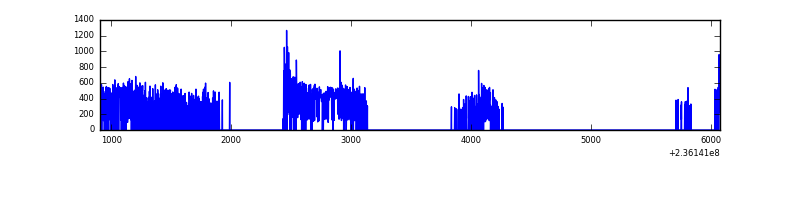 |
| B | 5164 | 1657 | 0 | 0 | 0.00% | 0.00% | 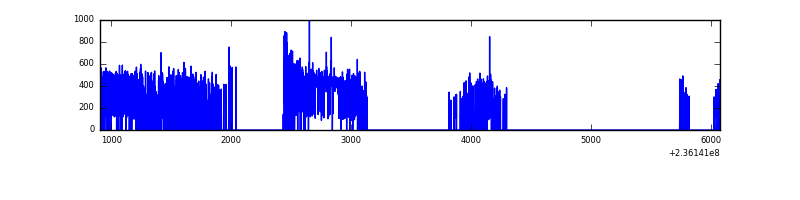 |
| C | 5163 | 1698 | 0 | 0 | 0.00% | 0.00% | 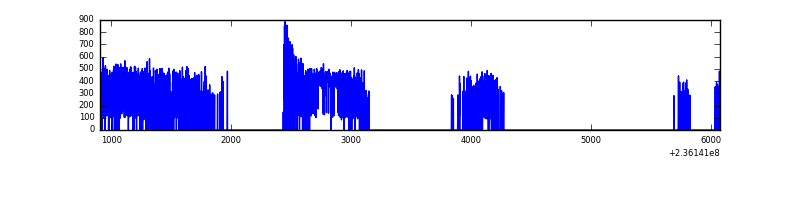 |
| D | 5164 | 1646 | 1 | 1 | 0.02% | 0.06% | 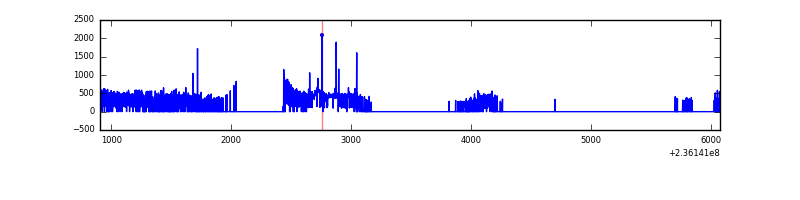 |
Top three noisy pixels from each quadrant. If the there are fewer than three noisy pixels in the level2.evt file, extra rows are filled as -1
| Pixel properties | Quadrant properties | ||||||
|---|---|---|---|---|---|---|---|
| Quadrant | DetID | PixID | Counts | Sigma | Mean | Median | Sigma |
| A | 8 | 5 | 38113 | 1253.49 | 137 | 134 | 30.3 |
| A | 14 | 111 | 4204 | 134.33 | 137 | 134 | 30.3 |
| A | 1 | 162 | 2357 | 73.37 | 137 | 134 | 30.3 |
| B | 4 | 173 | 6306 | 204.96 | 143 | 140 | 30.1 |
| B | 0 | 214 | 5629 | 182.46 | 143 | 140 | 30.1 |
| B | 12 | 111 | 2959 | 93.71 | 143 | 140 | 30.1 |
| C | 9 | 68 | 3247 | 89.52 | 140 | 140 | 34.7 |
| C | 13 | 61 | 1054 | 26.33 | 140 | 140 | 34.7 |
| C | 14 | 67 | 737 | 17.2 | 140 | 140 | 34.7 |
| D | 8 | 195 | 40618 | 1034.17 | 137 | 134 | 39.1 |
| D | 1 | 52 | 8227 | 206.74 | 137 | 134 | 39.1 |
| D | 7 | 71 | 7354 | 184.44 | 137 | 134 | 39.1 |
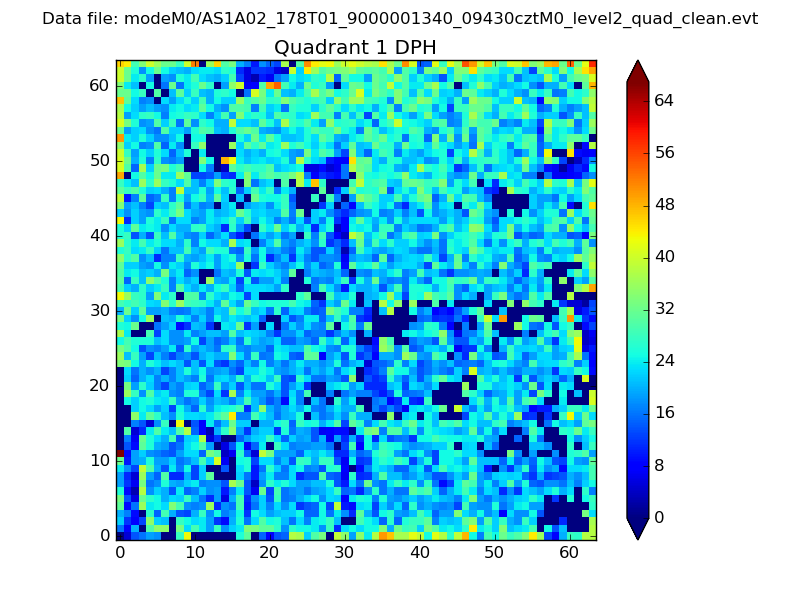
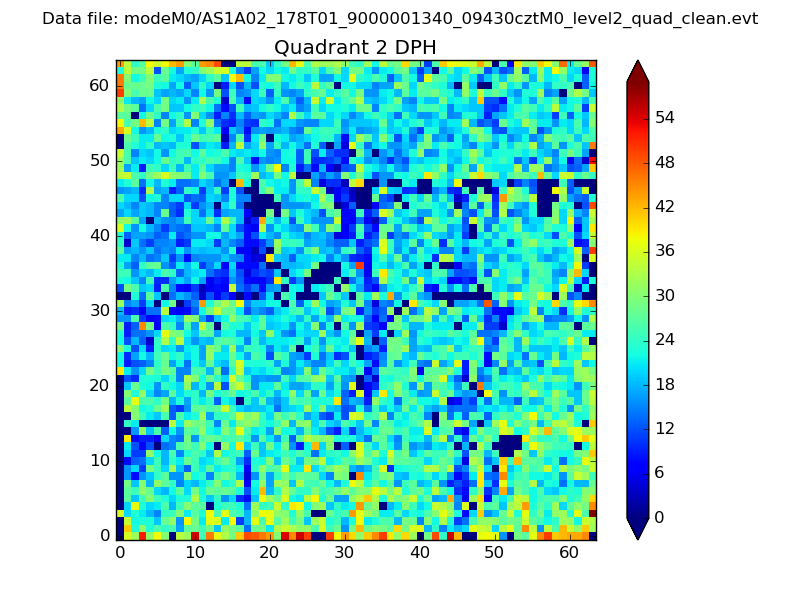
Histogram calculated using DETX and DETY for each event in the final _common_clean file
| Quadrant A |  |
 |
Quadrant B |
|---|---|---|---|
| Quadrant D |  |
 |
Quadrant C |
| Plot type | Count rate plots | Images |
|---|---|---|
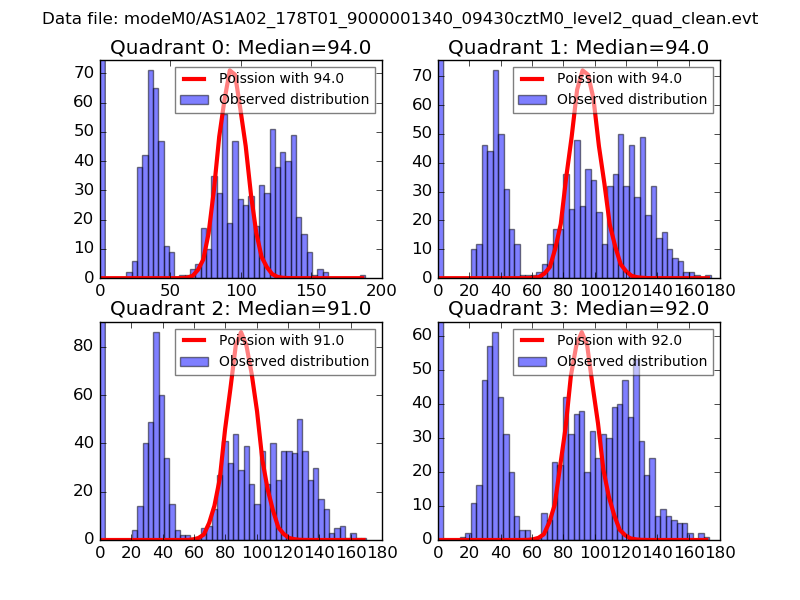
| Comparison with Poisson distribution Blue bars denote a histogram of data divided into 1 sec bins. Red curve is a Poisson curve with rate = median count rate of data. |
 |
 |
| Quadrant-wise count rates Data is divided into 100 sec bins |
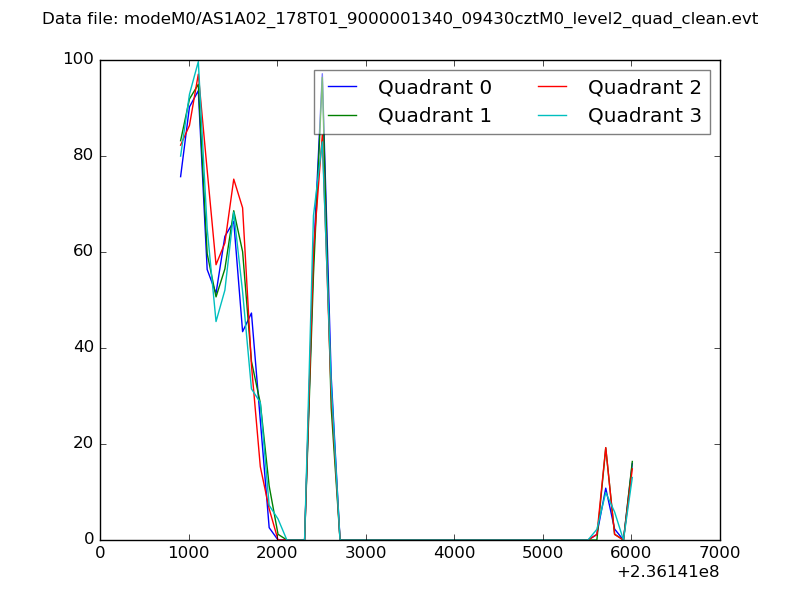 |
|
| Module-wise count rates for Quadrant A Data is divided into 100 sec bins |
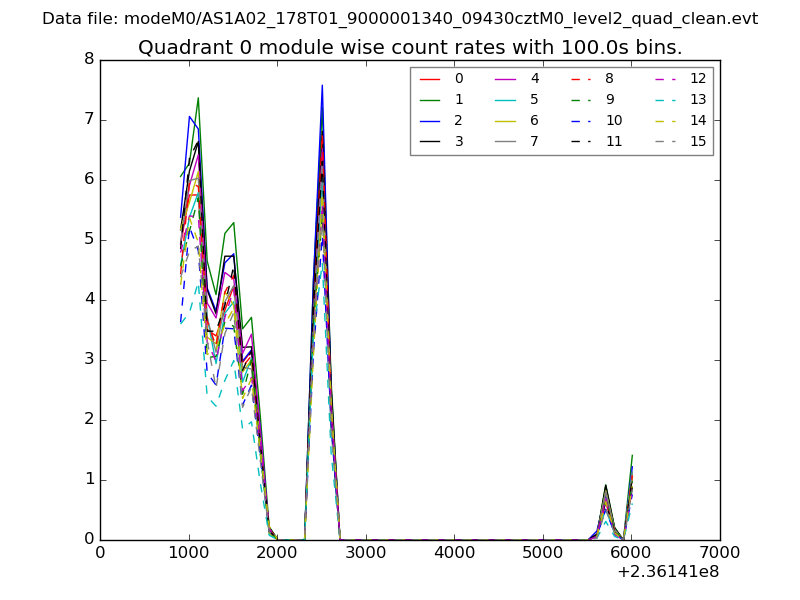 |
 |
| Module-wise count rates for Quadrant B Data is divided into 100 sec bins |
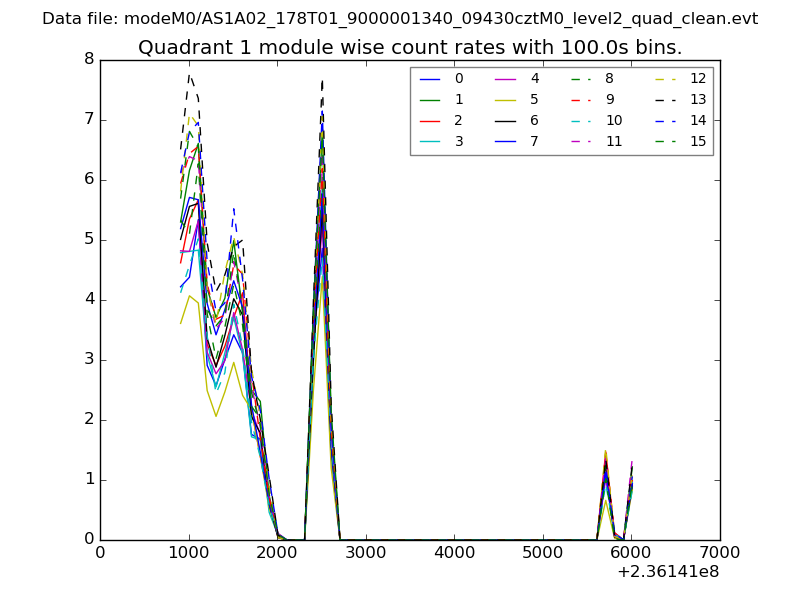 |
 |
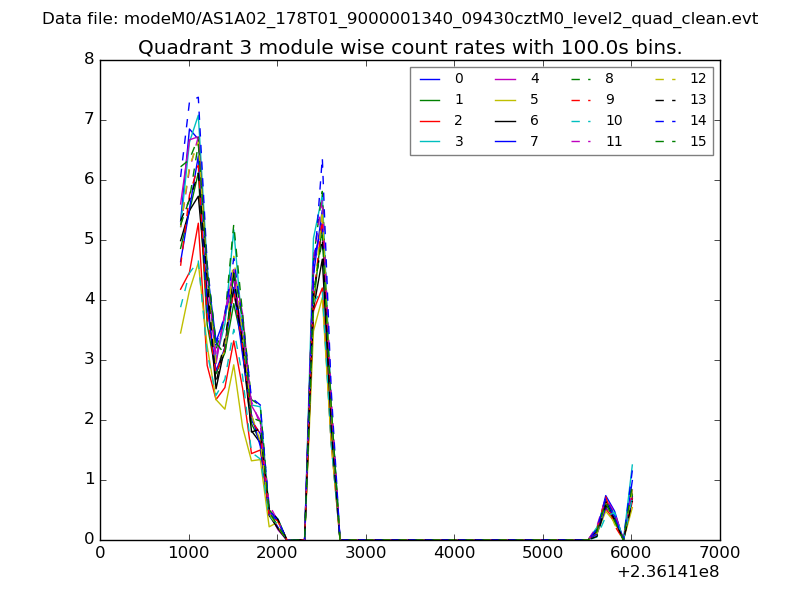
| Module-wise count rates for Quadrant C Data is divided into 100 sec bins |
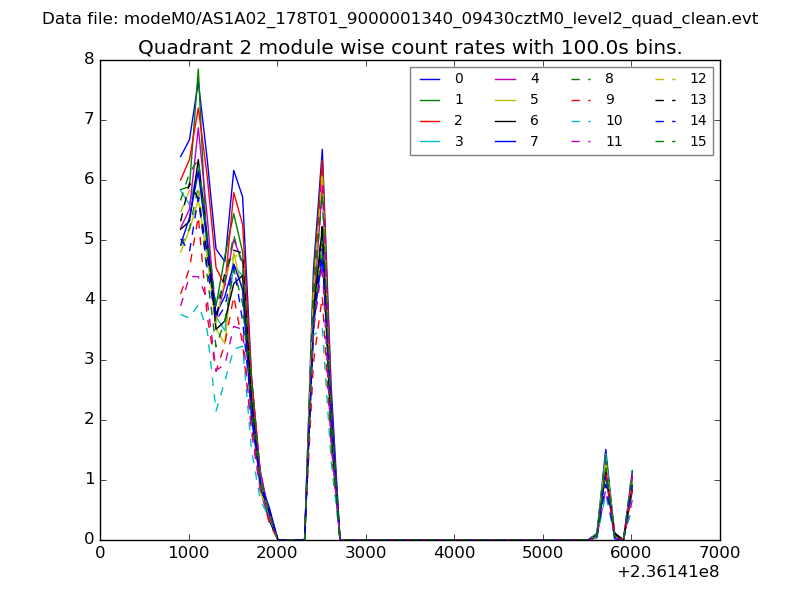 |
 |
| Module-wise count rates for Quadrant D Data is divided into 100 sec bins |
 |
 |
| Parameter | Plot |
|---|---|
| CZT HV Monitor | 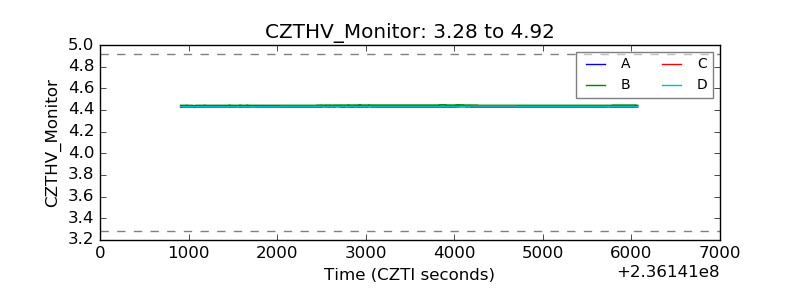 |
| D_VDD | 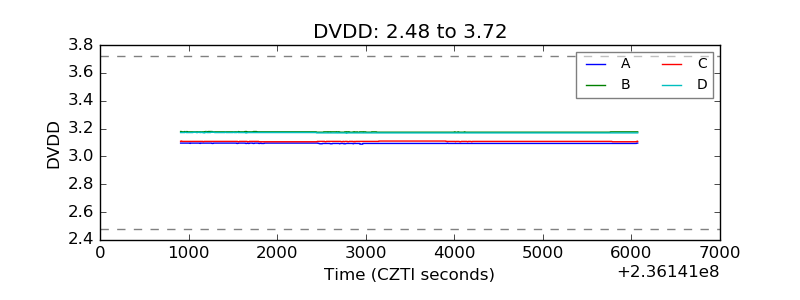 |
| Temperature 1 | 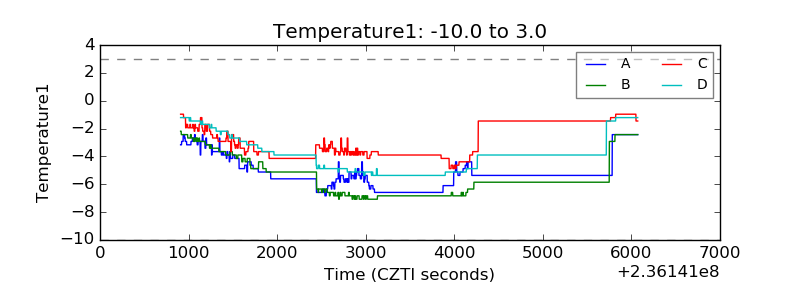 |
| Veto HV Monitor | 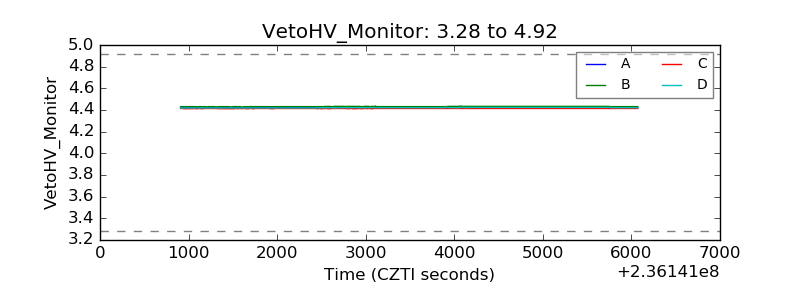 |
| Veto LLD | 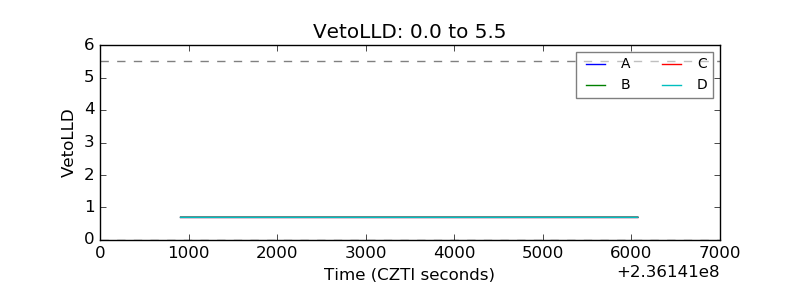 |
| Alpha Counter | 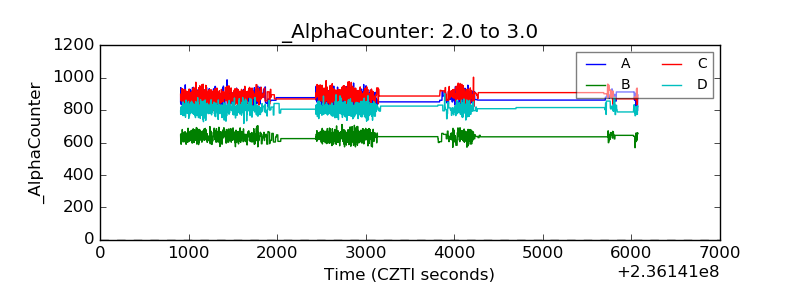 |
| _CPM_Rate | 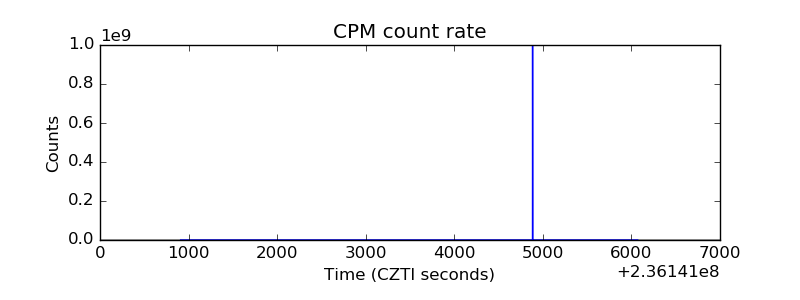 |
| CZT Counter | 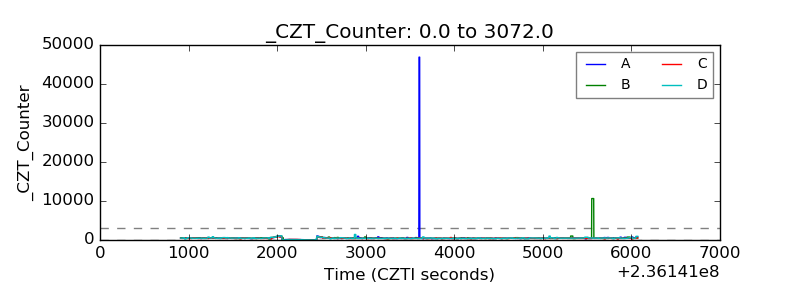 |
| +2.5 Volts monitor |  |
| +5 Volts monitor |  |
| _ROLL_ROT | 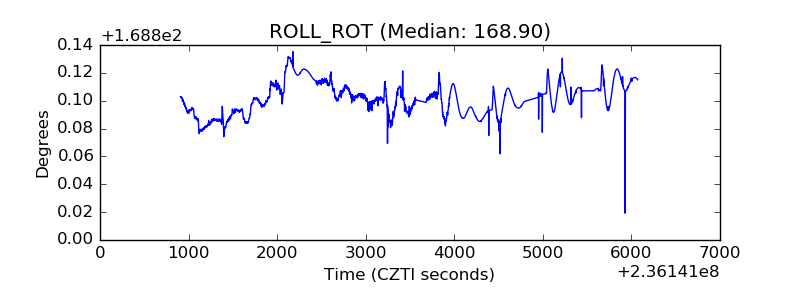 |
| _Roll_DEC | 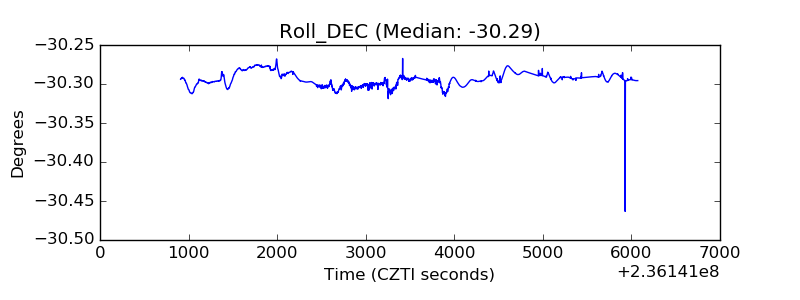 |
| _Roll_RA | 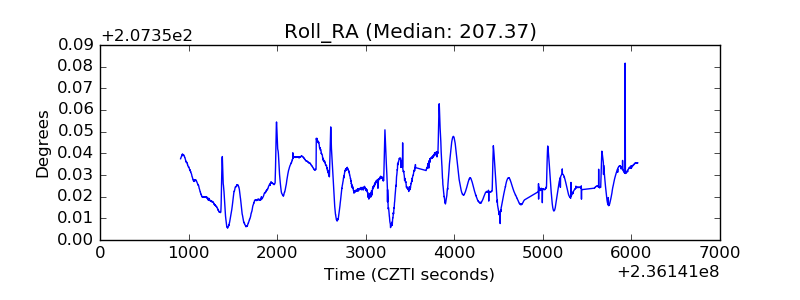 |
| Veto Counter | 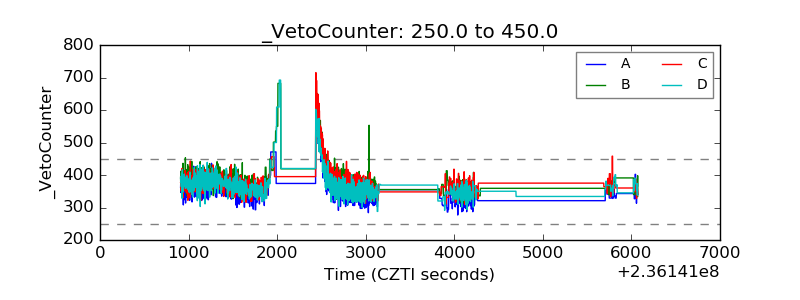 |