| Param | Original file | Final file |
|---|---|---|
| Filename | modeM0/AS1A02_178T01_9000001340_09432cztM0_level2.evt | modeM0/AS1A02_178T01_9000001340_09432cztM0_level2_quad_clean.evt |
| Size (bytes) | 60,569,280 | 15,508,800 |
| Size | 57.8 MB | 14.8 MB |
| Events in quadrant A | 429,520 | 83,189 |
| Events in quadrant B | 415,811 | 83,285 |
| Events in quadrant C | 399,476 | 80,815 |
| Events in quadrant D | 453,127 | 79,704 |
| Mode SS | |||
|---|---|---|---|
| Quadrant | BADHDUFLAG | Total packets | Discarded packets |
| A | 0 | 362 | 0 |
| B | 0 | 368 | 0 |
| C | 0 | 374 | 0 |
| D | 0 | 380 | 0 |
| Mode M0 | |||
|---|---|---|---|
| Quadrant | BADHDUFLAG | Total packets | Discarded packets |
| A | 0 | 1828 | 3 |
| B | 0 | 1821 | 0 |
| C | 0 | 1826 | 3 |
| D | 0 | 1831 | 3 |
| Mode M9 | |||
|---|---|---|---|
| Quadrant | BADHDUFLAG | Total packets | Discarded packets |
| A | 0 | 25 | 0 |
| B | 0 | 26 | 0 |
| C | 0 | 23 | 0 |
| D | 0 | 22 | 0 |
| Quadrant | Total seconds | Saturated seconds | Saturation percentage |
|---|---|---|---|
| A | 799 | 5 | 0.625782% |
| B | 861 | 3 | 0.348432% |
| C | 870 | 1 | 0.114943% |
| D | 723 | 3 | 0.414938% |
Noise dominated data is calculated using 1-second bins in cleaned event files. If a bin has >2000 counts, and if more than 50% of those come from <1% of pixels, then it is considered to be noise-dominated and hence unusable.
| Quadrant | # 1 sec bins | Bins with >0 counts | Bins with >2000 counts | High rate bins dominated by noise | Noise dominated (total time) | Noise dominated (detector-on time) | Marked lightcurve |
|---|---|---|---|---|---|---|---|
| A | 805 | 805 | 1 | 1 | 0.12% | 0.12% | 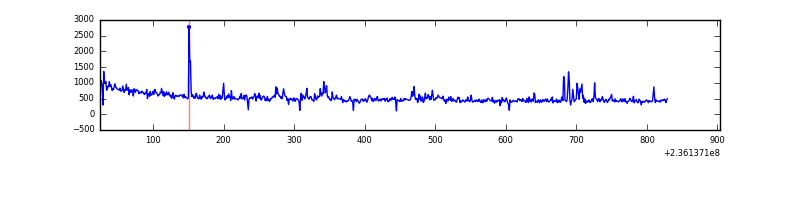 |
| B | 870 | 870 | 0 | 0 | 0.00% | 0.00% | 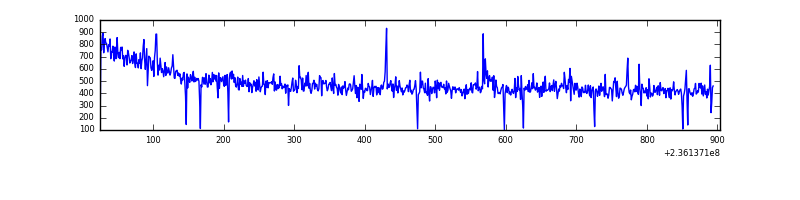 |
| C | 878 | 877 | 0 | 0 | 0.00% | 0.00% | 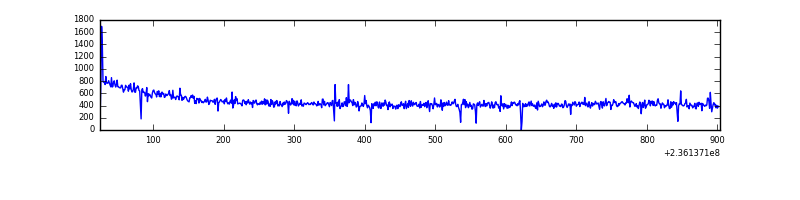 |
| D | 728 | 728 | 0 | 0 | 0.00% | 0.00% | 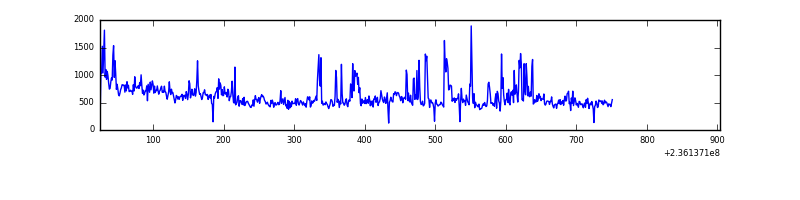 |
Top three noisy pixels from each quadrant. If the there are fewer than three noisy pixels in the level2.evt file, extra rows are filled as -1
| Pixel properties | Quadrant properties | ||||||
|---|---|---|---|---|---|---|---|
| Quadrant | DetID | PixID | Counts | Sigma | Mean | Median | Sigma |
| A | 8 | 5 | 56462 | 2583.98 | 96 | 94 | 21.8 |
| A | 1 | 162 | 2056 | 89.94 | 96 | 94 | 21.8 |
| A | 0 | 226 | 910 | 37.41 | 96 | 94 | 21.8 |
| B | 0 | 219 | 3623 | 154.43 | 104 | 101 | 22.8 |
| B | 0 | 197 | 3044 | 129.04 | 104 | 101 | 22.8 |
| B | 8 | 234 | 2327 | 97.6 | 104 | 101 | 22.8 |
| C | 9 | 68 | 6957 | 266.08 | 99 | 100 | 25.8 |
| C | 12 | 4 | 1995 | 73.53 | 99 | 100 | 25.8 |
| C | 13 | 61 | 753 | 25.34 | 99 | 100 | 25.8 |
| D | 8 | 195 | 63615 | 2814.22 | 83 | 81 | 22.6 |
| D | 1 | 52 | 51179 | 2263.37 | 83 | 81 | 22.6 |
| D | 7 | 71 | 8214 | 360.25 | 83 | 81 | 22.6 |
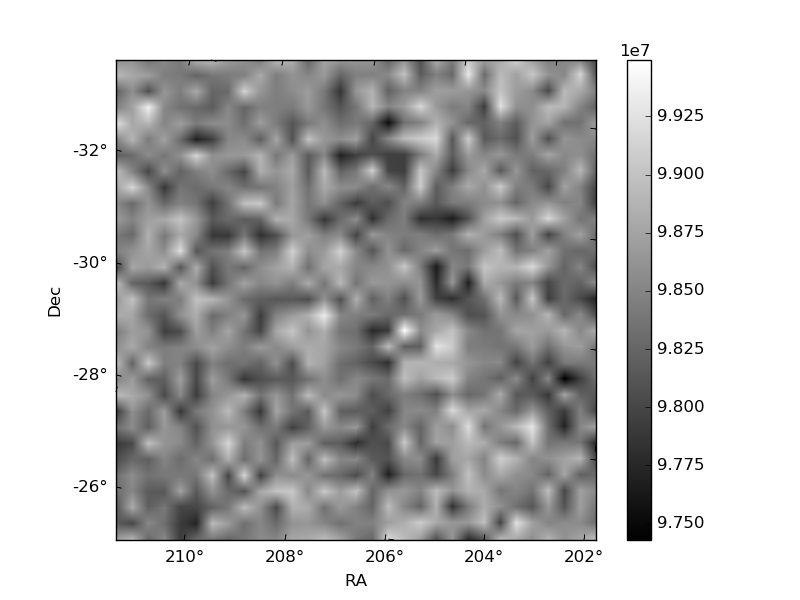
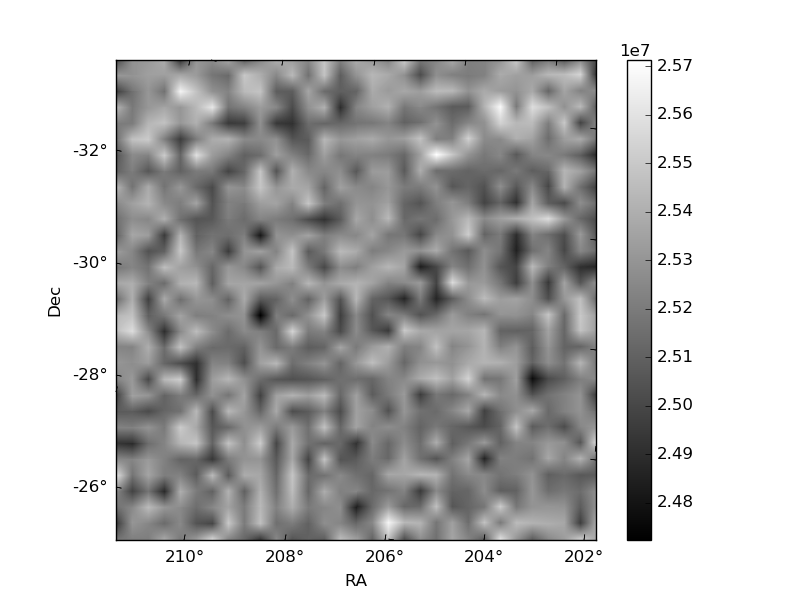
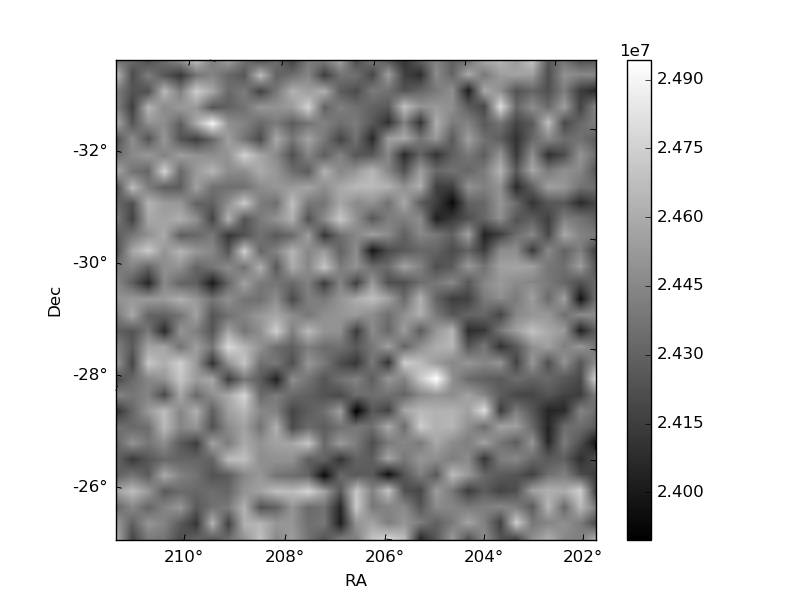
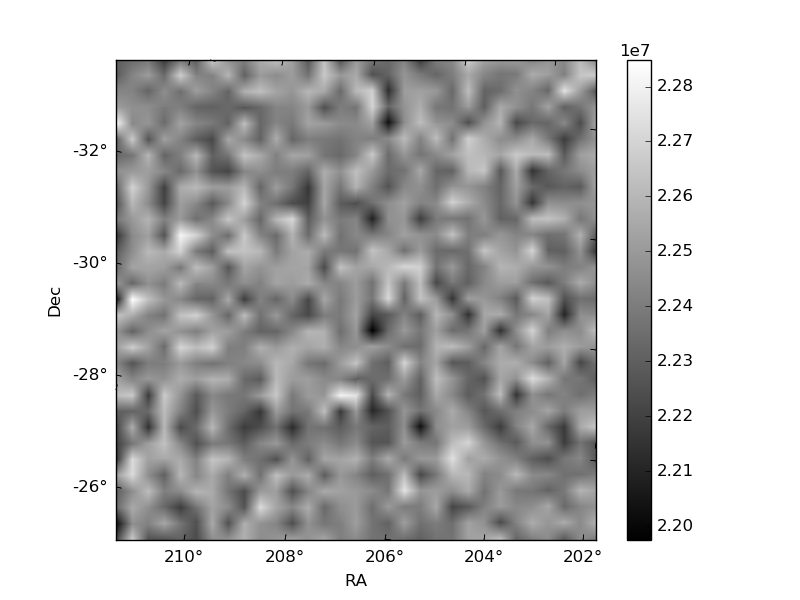
Histogram calculated using DETX and DETY for each event in the final _common_clean file
| Quadrant A | 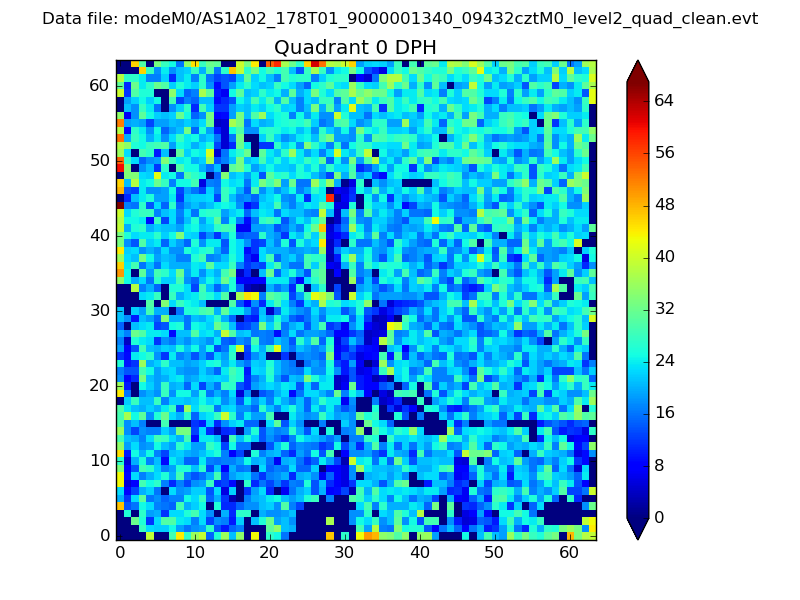 |
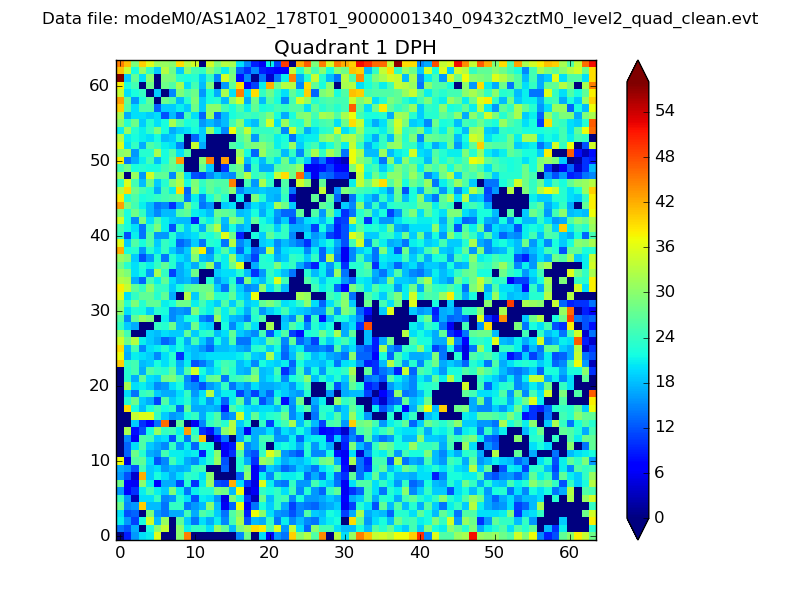 |
Quadrant B |
|---|---|---|---|
| Quadrant D | 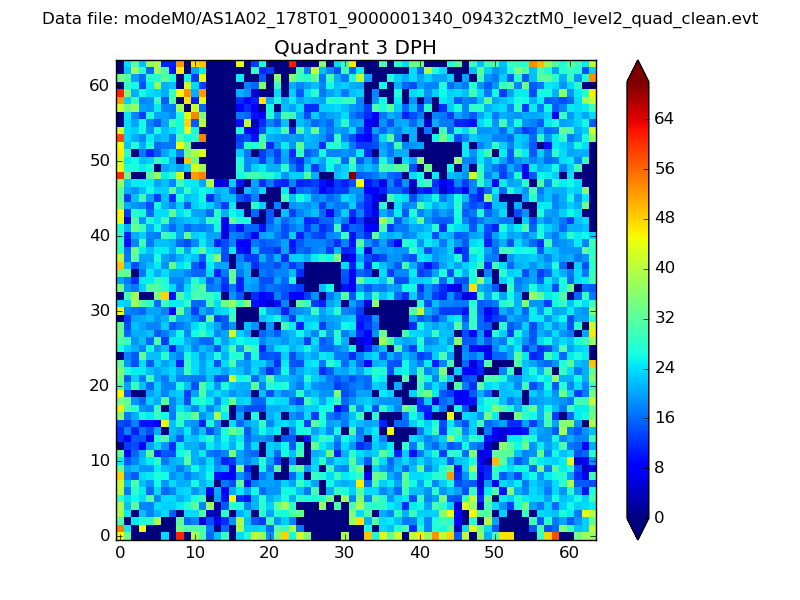 |
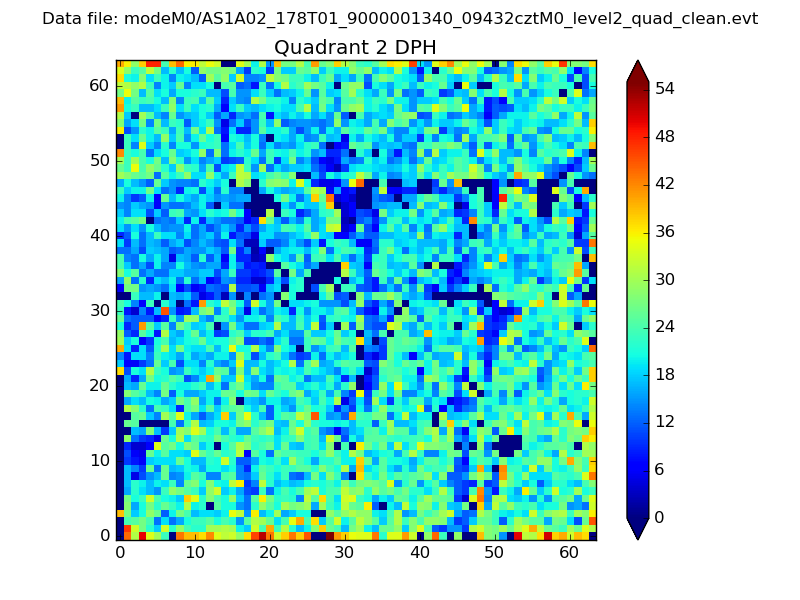 |
Quadrant C |
| Plot type | Count rate plots | Images |
|---|---|---|
| Comparison with Poisson distribution Blue bars denote a histogram of data divided into 1 sec bins. Red curve is a Poisson curve with rate = median count rate of data. |
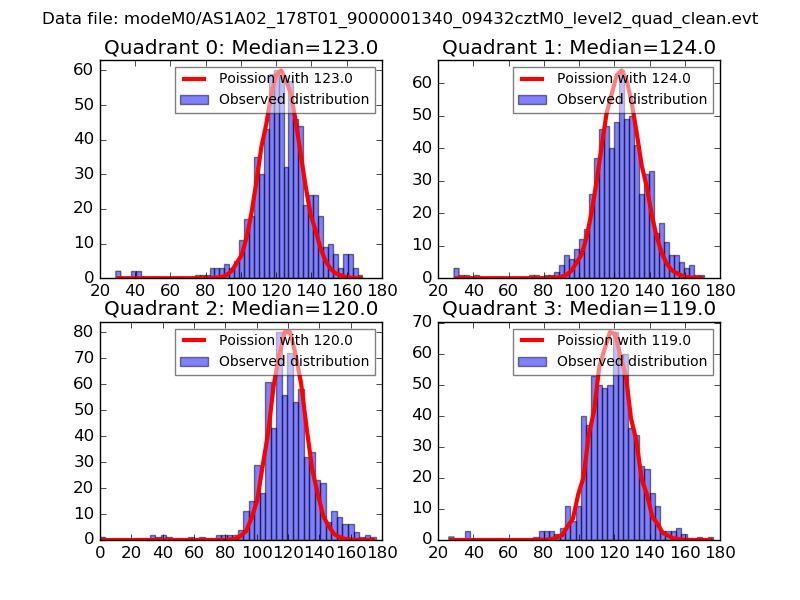 |
 |
| Quadrant-wise count rates Data is divided into 100 sec bins |
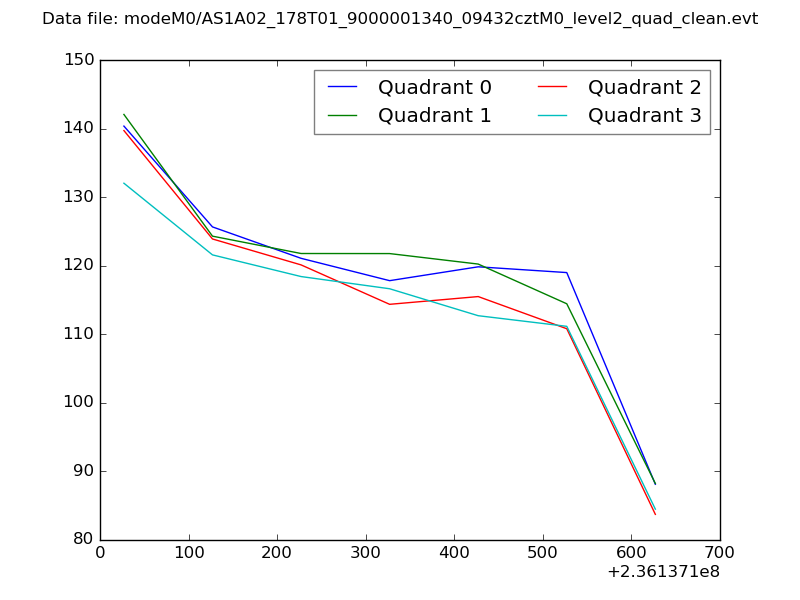 |
|
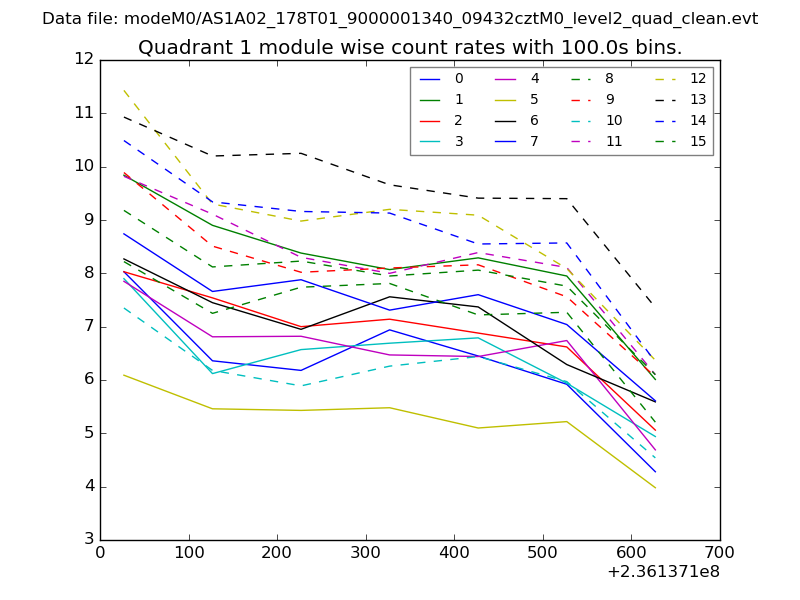
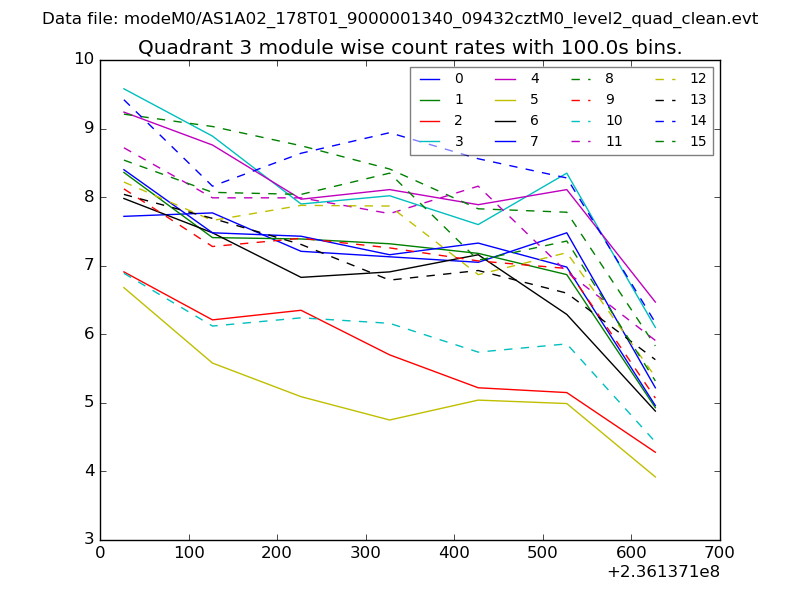
| Module-wise count rates for Quadrant A Data is divided into 100 sec bins |
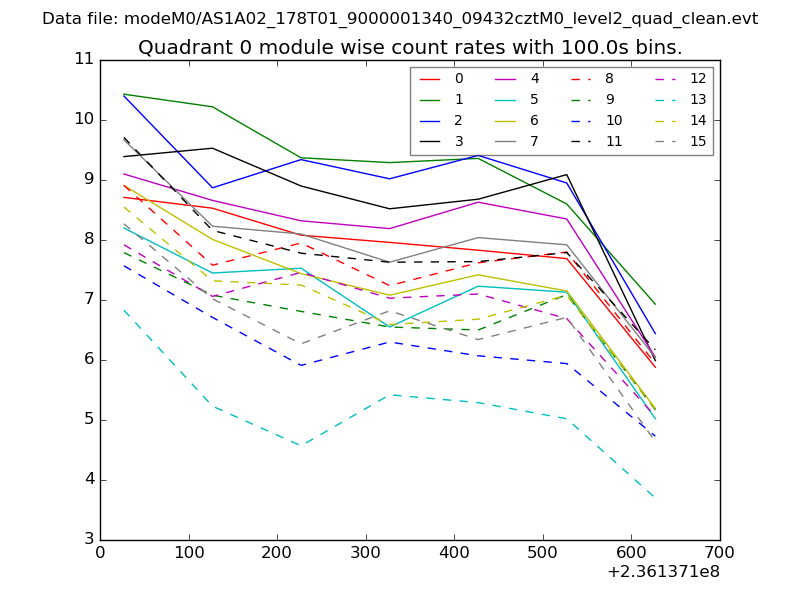 |
 |
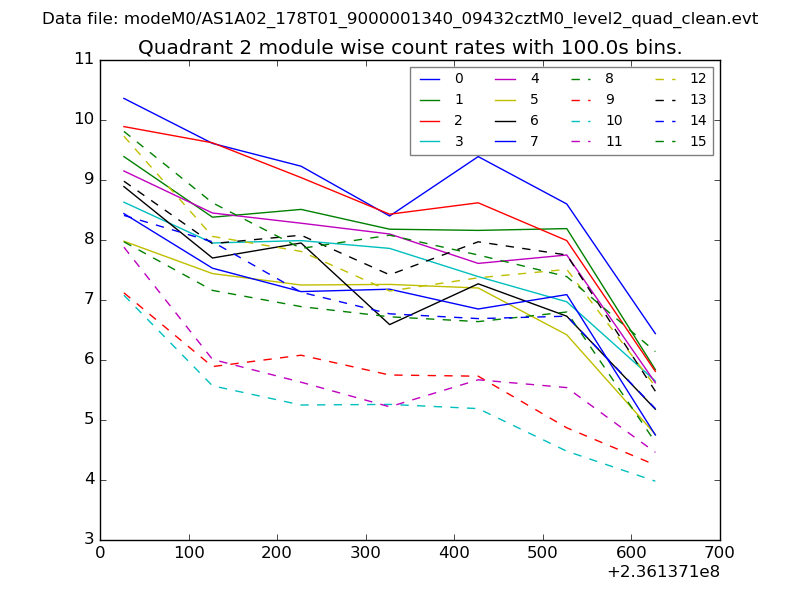
| Module-wise count rates for Quadrant B Data is divided into 100 sec bins |
 |
 |
| Module-wise count rates for Quadrant C Data is divided into 100 sec bins |
 |
 |
| Module-wise count rates for Quadrant D Data is divided into 100 sec bins |
 |
 |
| Parameter | Plot |
|---|---|
| CZT HV Monitor | 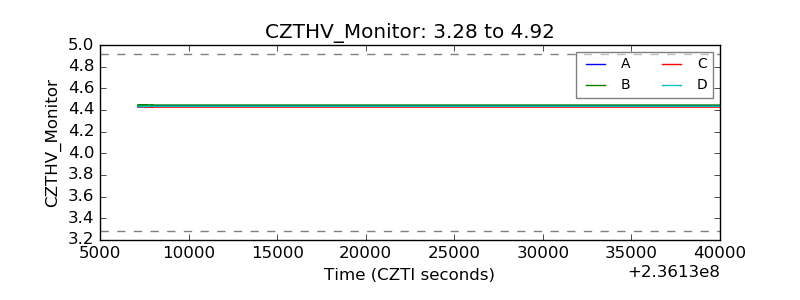 |
| D_VDD | 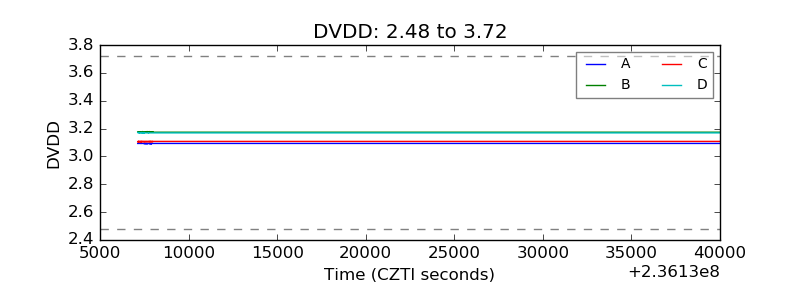 |
| Temperature 1 | 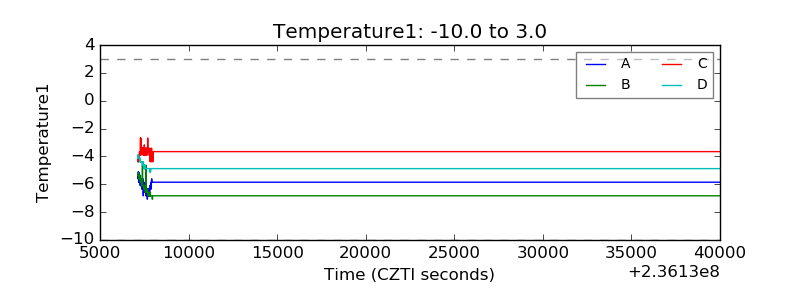 |
| Veto HV Monitor | 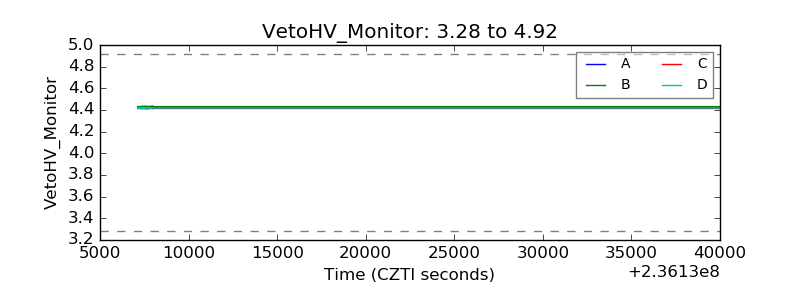 |
| Veto LLD | 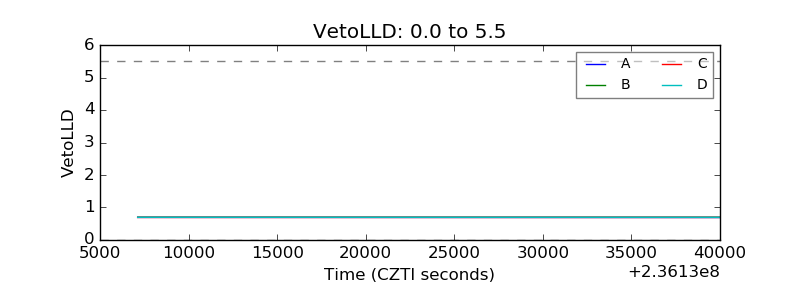 |
| Alpha Counter | 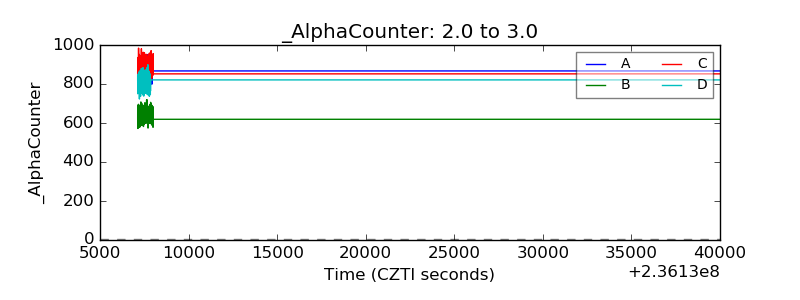 |
| _CPM_Rate | 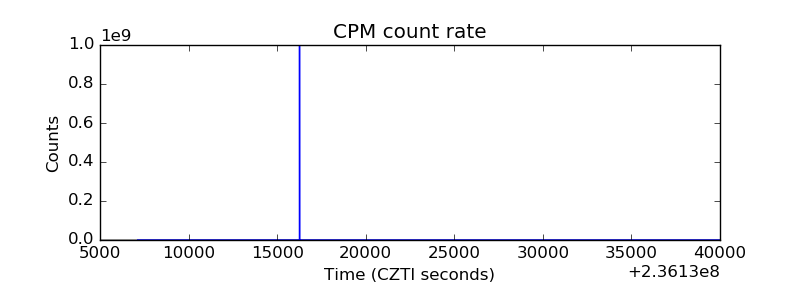 |
| CZT Counter | 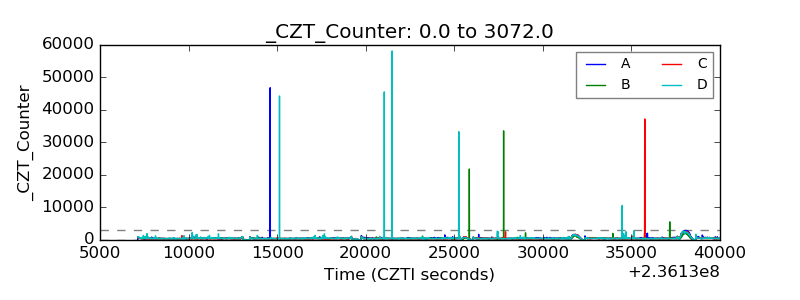 |
| +2.5 Volts monitor |  |
| +5 Volts monitor |  |
| _ROLL_ROT | 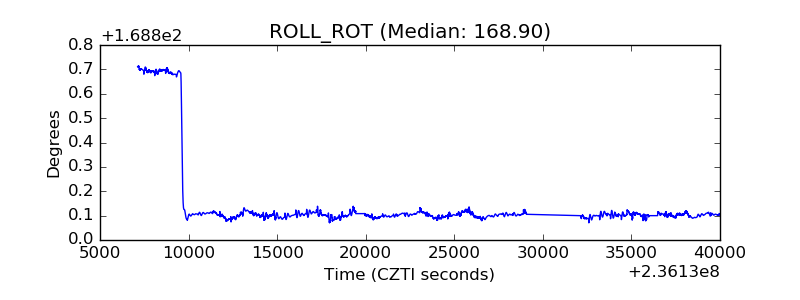 |
| _Roll_DEC |  |
| _Roll_RA | 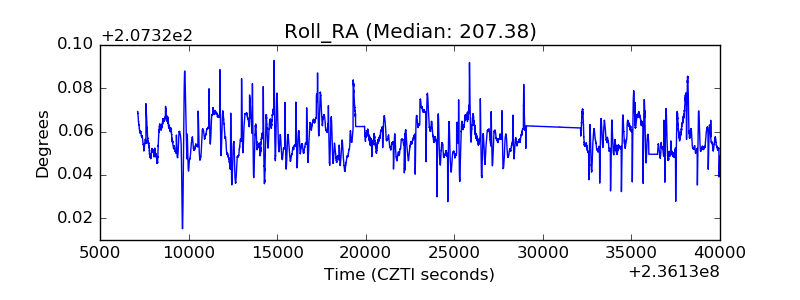 |
| Veto Counter | 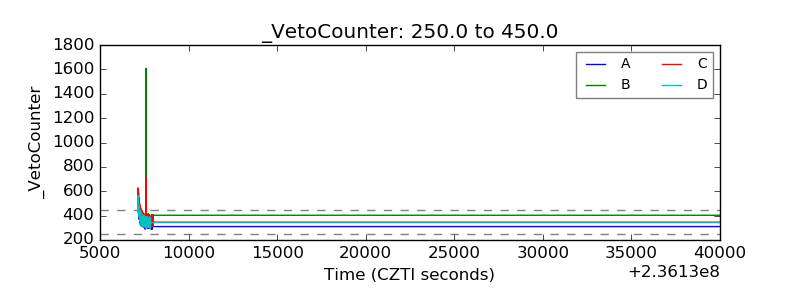 |