| Param | Original file | Final file |
|---|---|---|
| Filename | modeM0/AS1A02_178T01_9000001340_09434cztM0_level2.evt | modeM0/AS1A02_178T01_9000001340_09434cztM0_level2_quad_clean.evt |
| Size (bytes) | 367,620,480 | 88,171,200 |
| Size | 350.6 MB | 84.1 MB |
| Events in quadrant A | 2,927,345 | 587,497 |
| Events in quadrant B | 2,592,139 | 579,750 |
| Events in quadrant C | 2,512,968 | 568,839 |
| Events in quadrant D | 2,737,416 | 560,823 |
| Mode SS | |||
|---|---|---|---|
| Quadrant | BADHDUFLAG | Total packets | Discarded packets |
| A | 0 | 118 | 16 |
| B | 0 | 118 | 8 |
| C | 0 | 118 | 16 |
| D | 0 | 118 | 16 |
| Mode M0 | |||
|---|---|---|---|
| Quadrant | BADHDUFLAG | Total packets | Discarded packets |
| A | 0 | 13427 | 1321 |
| B | 0 | 12411 | 1280 |
| C | 0 | 12250 | 1203 |
| D | 0 | 12900 | 1360 |
| Mode M9 | |||
|---|---|---|---|
| Quadrant | BADHDUFLAG | Total packets | Discarded packets |
| A | 0 | 12 | 0 |
| B | 0 | 12 | 1 |
| C | 0 | 12 | 0 |
| D | 0 | 12 | 1 |
| Quadrant | Total seconds | Saturated seconds | Saturation percentage |
|---|---|---|---|
| A | 5364 | 70 | 1.304996% |
| B | 5316 | 54 | 1.015801% |
| C | 5332 | 27 | 0.506377% |
| D | 5324 | 43 | 0.807663% |
Noise dominated data is calculated using 1-second bins in cleaned event files. If a bin has >2000 counts, and if more than 50% of those come from <1% of pixels, then it is considered to be noise-dominated and hence unusable.
| Quadrant | # 1 sec bins | Bins with >0 counts | Bins with >2000 counts | High rate bins dominated by noise | Noise dominated (total time) | Noise dominated (detector-on time) | Marked lightcurve |
|---|---|---|---|---|---|---|---|
| A | 7058 | 5774 | 3 | 3 | 0.04% | 0.05% |  |
| B | 7058 | 5785 | 3 | 3 | 0.04% | 0.05% |  |
| C | 7057 | 5744 | 0 | 0 | 0.00% | 0.00% | 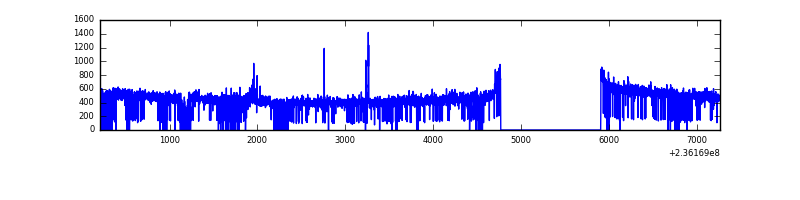 |
| D | 7058 | 5779 | 5 | 5 | 0.07% | 0.09% | 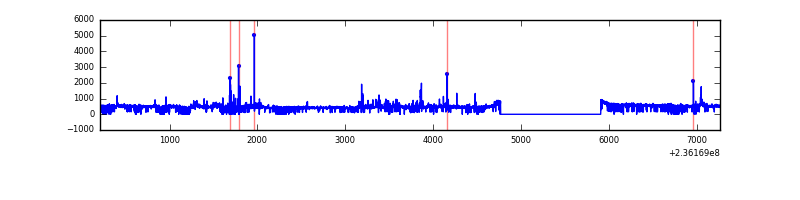 |
Top three noisy pixels from each quadrant. If the there are fewer than three noisy pixels in the level2.evt file, extra rows are filled as -1
| Pixel properties | Quadrant properties | ||||||
|---|---|---|---|---|---|---|---|
| Quadrant | DetID | PixID | Counts | Sigma | Mean | Median | Sigma |
| A | 8 | 5 | 318204 | 2343.84 | 664 | 651 | 135.5 |
| A | 14 | 111 | 21214 | 151.77 | 664 | 651 | 135.5 |
| A | 1 | 162 | 18579 | 132.33 | 664 | 651 | 135.5 |
| B | 0 | 219 | 19606 | 153.83 | 648 | 634 | 123.3 |
| B | 0 | 246 | 18504 | 144.9 | 648 | 634 | 123.3 |
| B | 5 | 255 | 14614 | 113.35 | 648 | 634 | 123.3 |
| C | 9 | 68 | 39243 | 266.2 | 629 | 633 | 145.0 |
| C | 14 | 234 | 16625 | 110.26 | 629 | 633 | 145.0 |
| C | 13 | 61 | 4674 | 27.86 | 629 | 633 | 145.0 |
| D | 1 | 52 | 143117 | 890.78 | 633 | 617 | 160.0 |
| D | 8 | 195 | 79194 | 491.19 | 633 | 617 | 160.0 |
| D | 7 | 71 | 49862 | 307.83 | 633 | 617 | 160.0 |
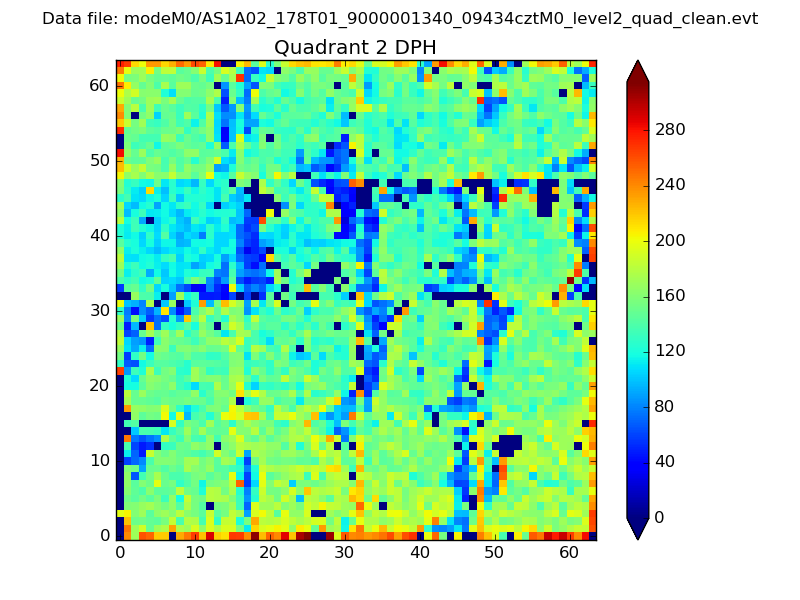
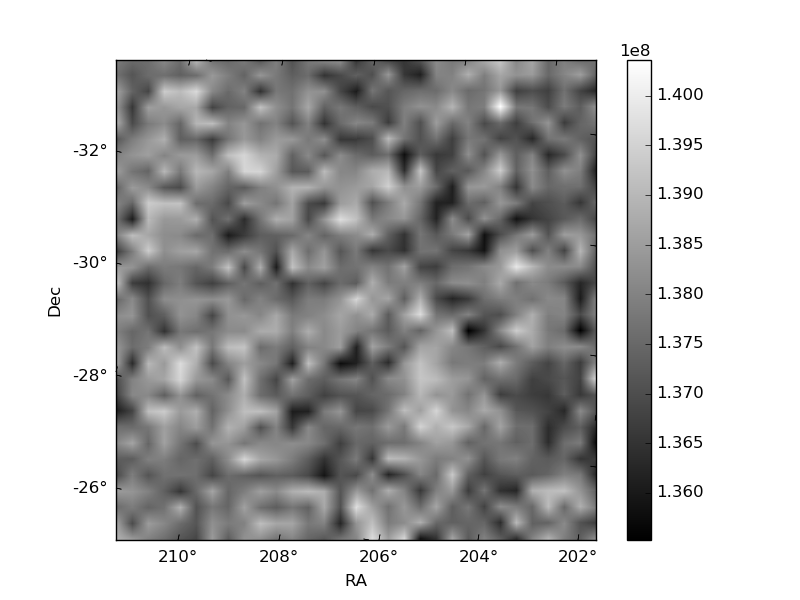
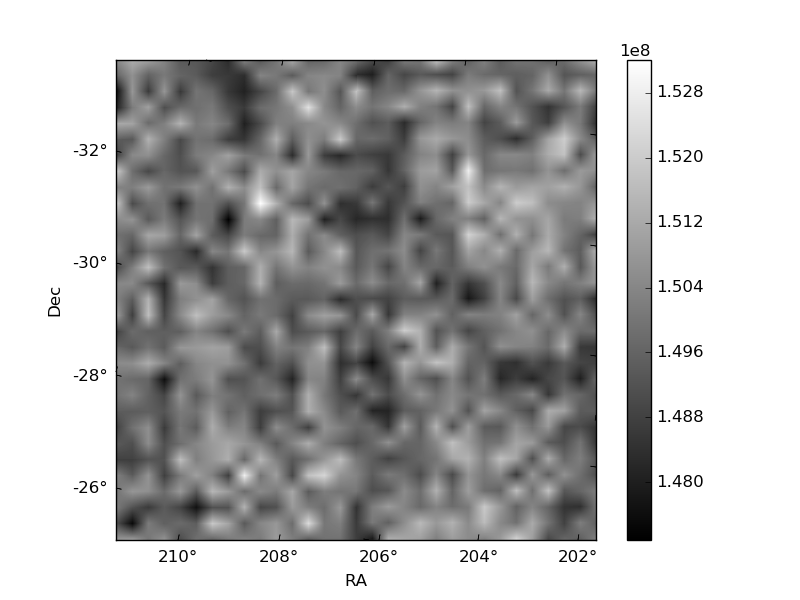
Histogram calculated using DETX and DETY for each event in the final _common_clean file
| Quadrant A | 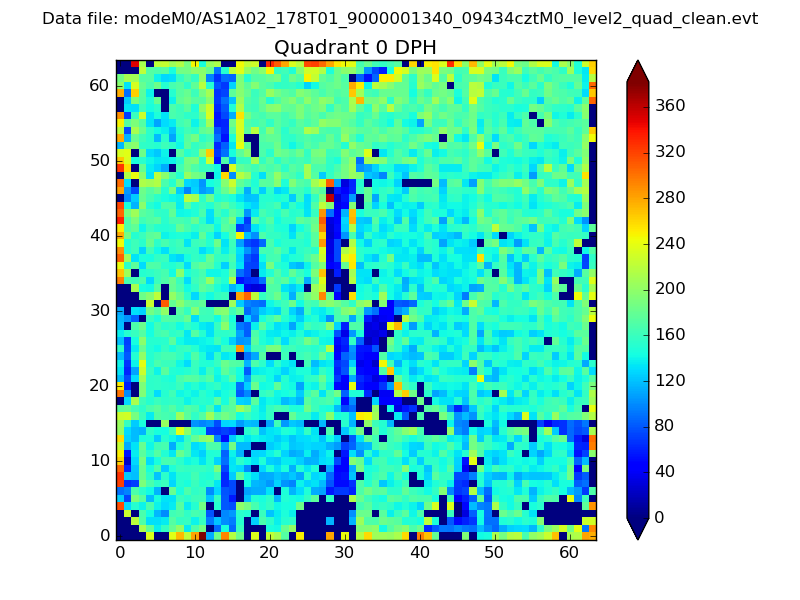 |
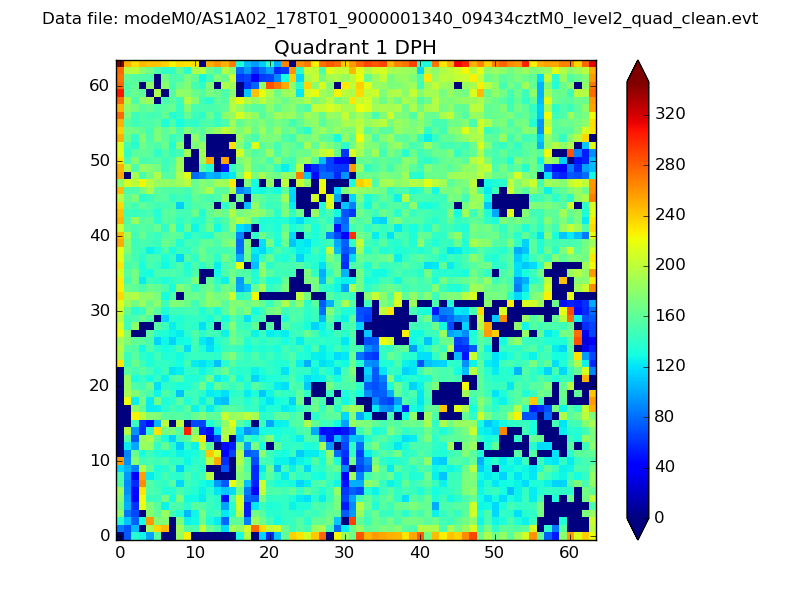 |
Quadrant B |
|---|---|---|---|
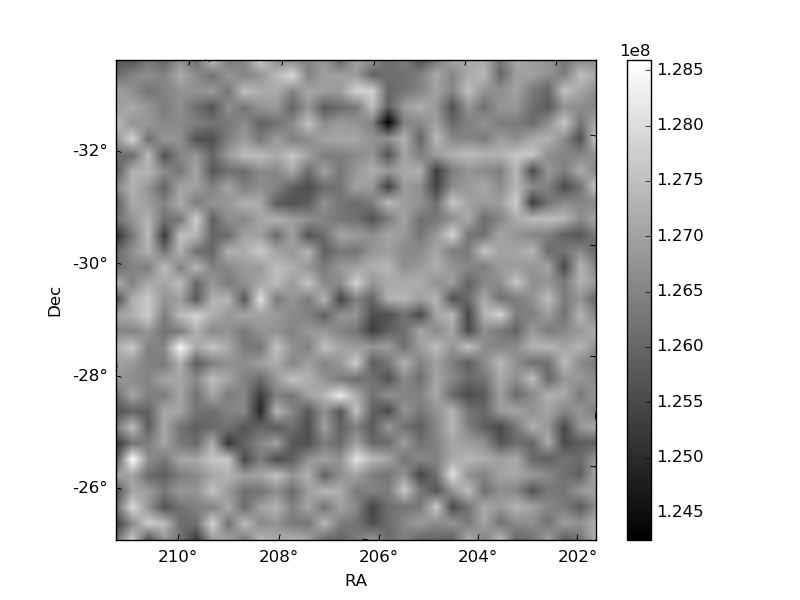
| Quadrant D | 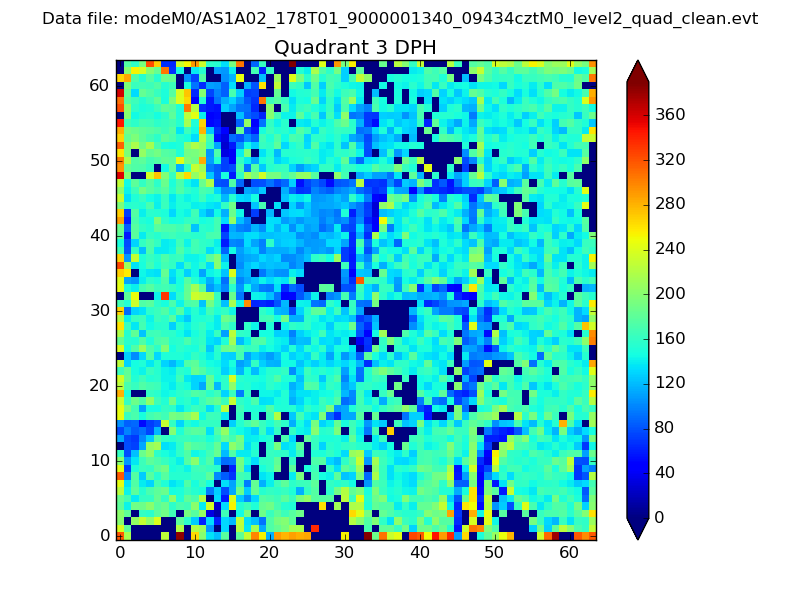 |
 |
Quadrant C |
| Plot type | Count rate plots | Images |
|---|---|---|
| Comparison with Poisson distribution Blue bars denote a histogram of data divided into 1 sec bins. Red curve is a Poisson curve with rate = median count rate of data. |
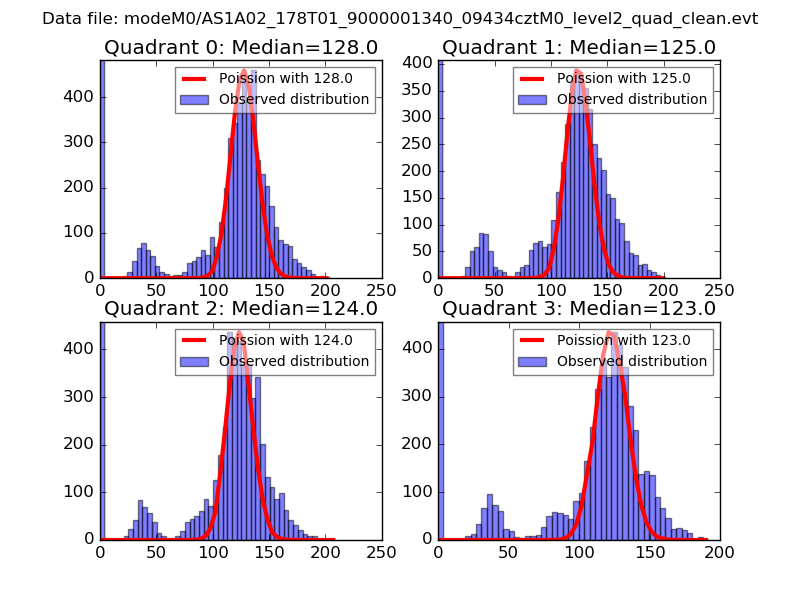 |
 |
| Quadrant-wise count rates Data is divided into 100 sec bins |
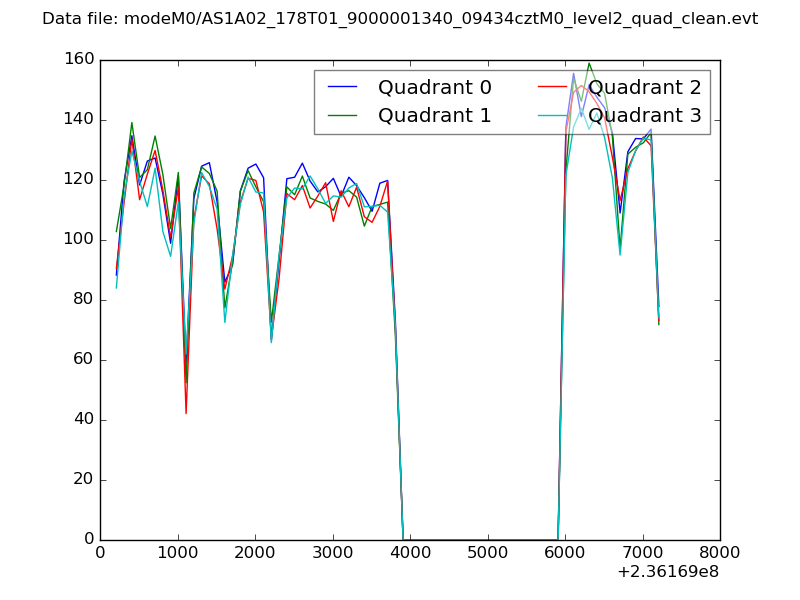 |
|
| Module-wise count rates for Quadrant A Data is divided into 100 sec bins |
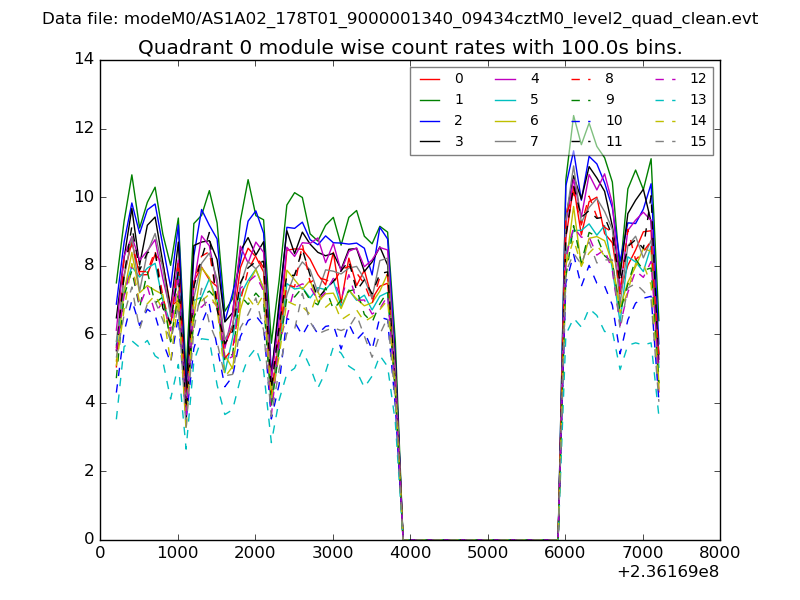 |
 |
| Module-wise count rates for Quadrant B Data is divided into 100 sec bins |
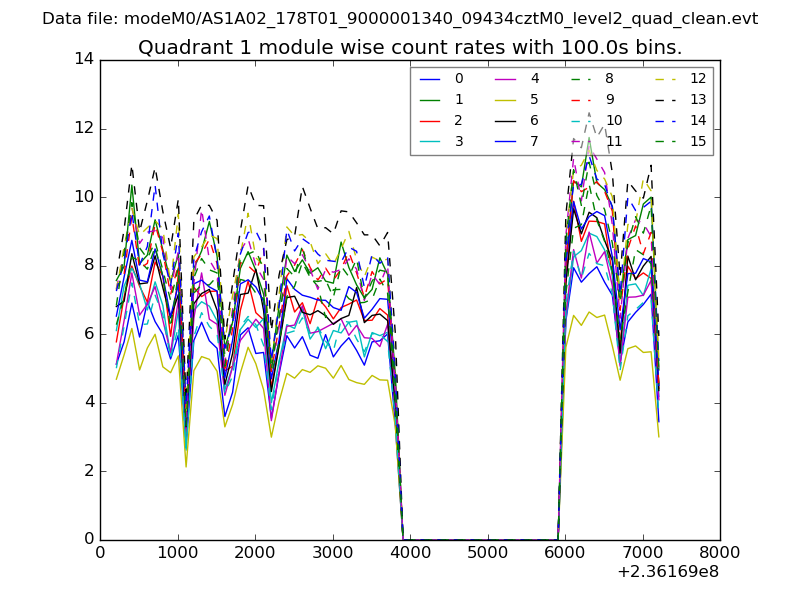 |
 |
| Module-wise count rates for Quadrant C Data is divided into 100 sec bins |
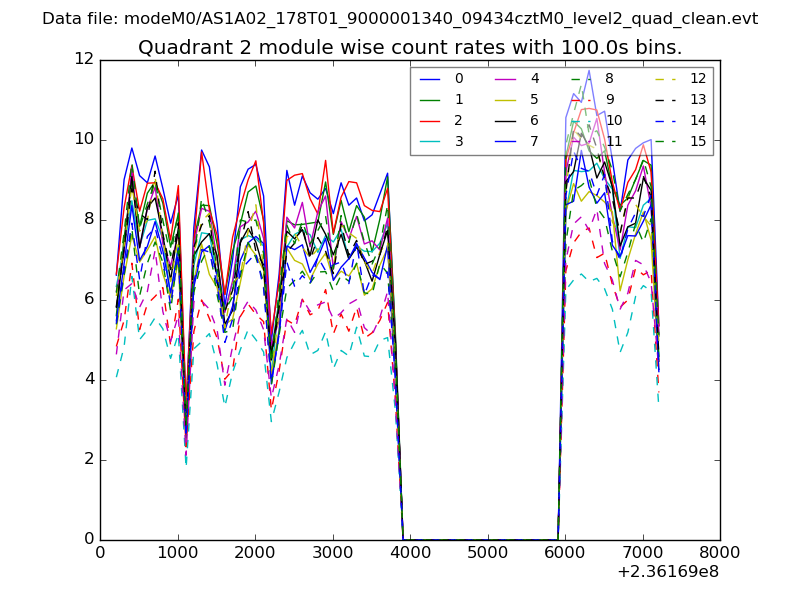 |
 |
| Module-wise count rates for Quadrant D Data is divided into 100 sec bins |
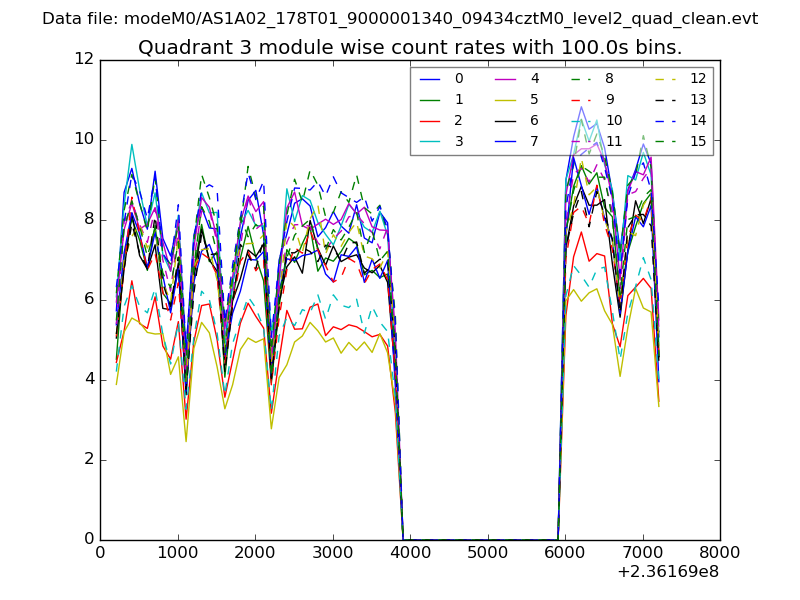 |
 |
| Parameter | Plot |
|---|---|
| CZT HV Monitor | 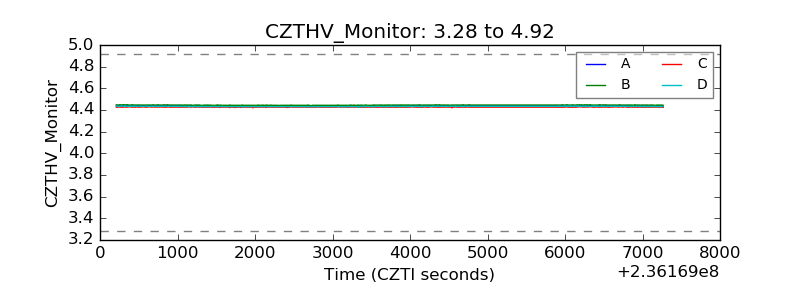 |
| D_VDD |  |
| Temperature 1 | 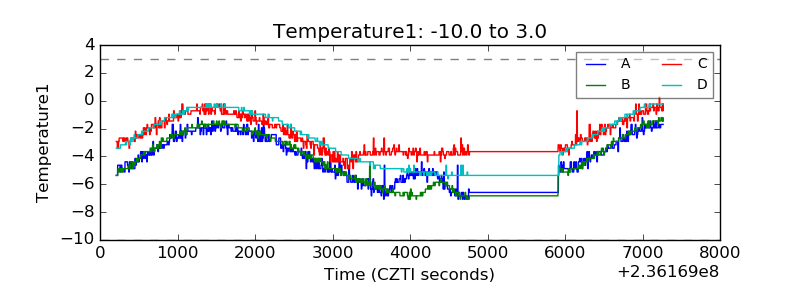 |
| Veto HV Monitor |  |
| Veto LLD | 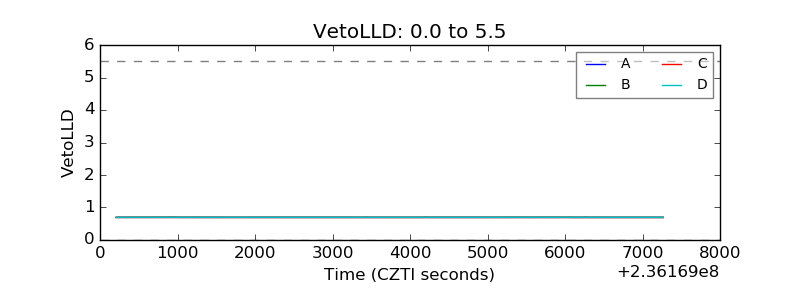 |
| Alpha Counter | 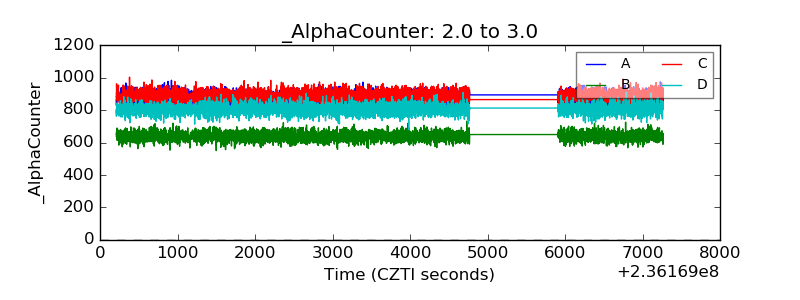 |
| _CPM_Rate | 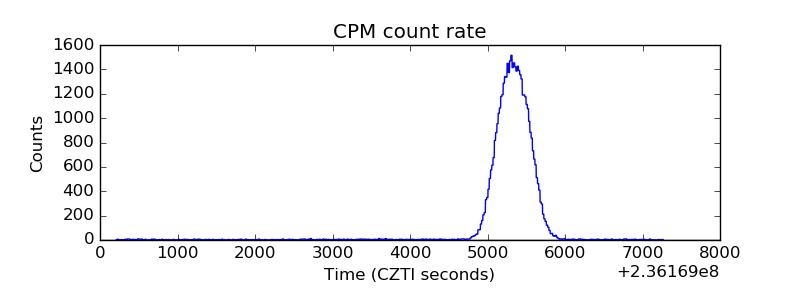 |
| CZT Counter | 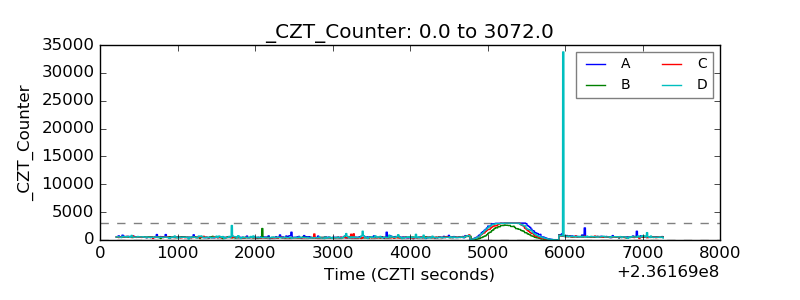 |
| +2.5 Volts monitor |  |
| +5 Volts monitor |  |
| _ROLL_ROT | 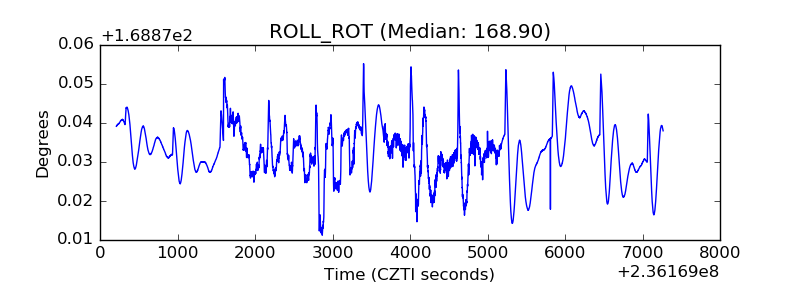 |
| _Roll_DEC | 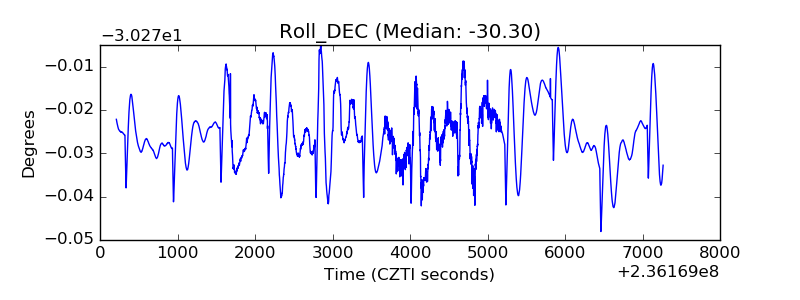 |
| _Roll_RA | 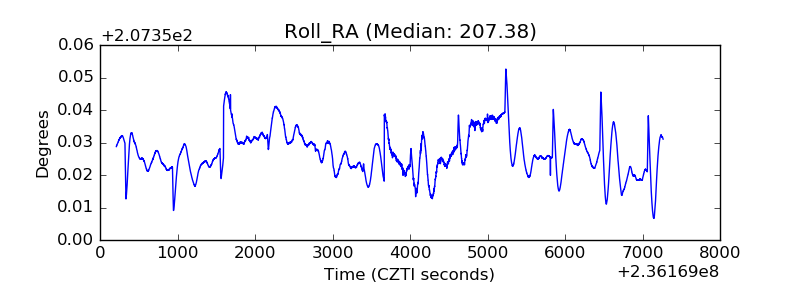 |
| Veto Counter | 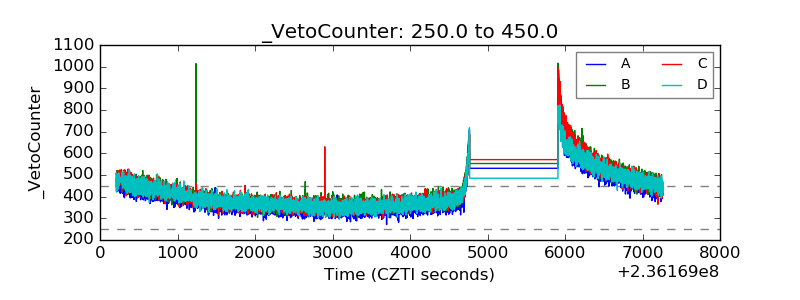 |