| Param | Original file | Final file |
|---|---|---|
| Filename | modeM0/AS1A02_178T01_9000001340_09435cztM0_level2.evt | modeM0/AS1A02_178T01_9000001340_09435cztM0_level2_quad_clean.evt |
| Size (bytes) | 800,688,960 | 183,337,920 |
| Size | 763.6 MB | 174.8 MB |
| Events in quadrant A | 6,973,839 | 1,212,607 |
| Events in quadrant B | 5,551,526 | 1,213,116 |
| Events in quadrant C | 5,228,485 | 1,180,898 |
| Events in quadrant D | 5,739,463 | 1,174,130 |
| Mode SS | |||
|---|---|---|---|
| Quadrant | BADHDUFLAG | Total packets | Discarded packets |
| A | 0 | 226 | 0 |
| B | 0 | 226 | 0 |
| C | 0 | 226 | 0 |
| D | 0 | 226 | 0 |
| Mode M0 | |||
|---|---|---|---|
| Quadrant | BADHDUFLAG | Total packets | Discarded packets |
| A | 0 | 27997 | 4 |
| B | 0 | 23807 | 4 |
| C | 0 | 23169 | 2 |
| D | 0 | 24430 | 4 |
| Mode M9 | |||
|---|---|---|---|
| Quadrant | BADHDUFLAG | Total packets | Discarded packets |
| A | 0 | 24 | 0 |
| B | 0 | 24 | 0 |
| C | 0 | 24 | 0 |
| D | 0 | 24 | 0 |
| Quadrant | Total seconds | Saturated seconds | Saturation percentage |
|---|---|---|---|
| A | 11166 | 329 | 2.946445% |
| B | 11165 | 124 | 1.110614% |
| C | 11166 | 82 | 0.734372% |
| D | 11165 | 107 | 0.958352% |
Noise dominated data is calculated using 1-second bins in cleaned event files. If a bin has >2000 counts, and if more than 50% of those come from <1% of pixels, then it is considered to be noise-dominated and hence unusable.
| Quadrant | # 1 sec bins | Bins with >0 counts | Bins with >2000 counts | High rate bins dominated by noise | Noise dominated (total time) | Noise dominated (detector-on time) | Marked lightcurve |
|---|---|---|---|---|---|---|---|
| A | 13527 | 11169 | 24 | 24 | 0.18% | 0.21% | 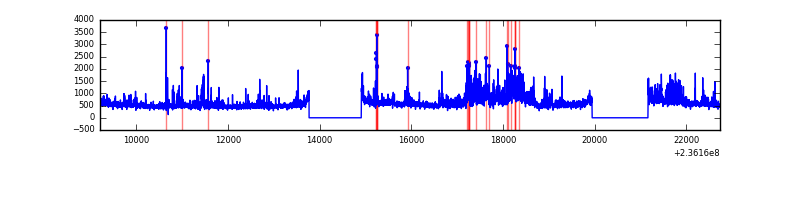 |
| B | 13527 | 11169 | 7 | 7 | 0.05% | 0.06% | 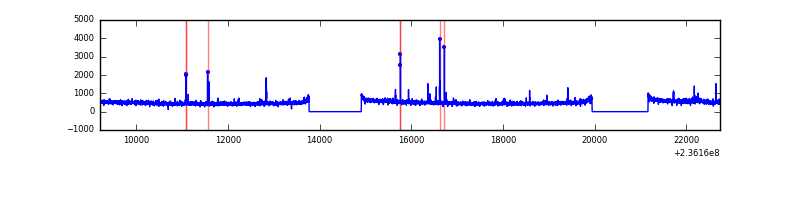 |
| C | 13527 | 11169 | 0 | 0 | 0.00% | 0.00% |  |
| D | 13527 | 11169 | 19 | 19 | 0.14% | 0.17% | 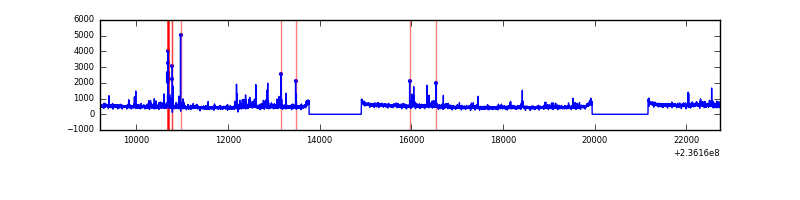 |
Top three noisy pixels from each quadrant. If the there are fewer than three noisy pixels in the level2.evt file, extra rows are filled as -1
| Pixel properties | Quadrant properties | ||||||
|---|---|---|---|---|---|---|---|
| Quadrant | DetID | PixID | Counts | Sigma | Mean | Median | Sigma |
| A | 8 | 5 | 1413255 | 5088.82 | 1384 | 1360 | 277.5 |
| A | 14 | 111 | 114309 | 407.1 | 1384 | 1360 | 277.5 |
| A | 1 | 162 | 55658 | 195.7 | 1384 | 1360 | 277.5 |
| B | 0 | 214 | 62586 | 235.96 | 1369 | 1341 | 259.6 |
| B | 0 | 219 | 42058 | 156.87 | 1369 | 1341 | 259.6 |
| B | 0 | 246 | 38171 | 141.89 | 1369 | 1341 | 259.6 |
| C | 9 | 68 | 59183 | 192.7 | 1319 | 1325 | 300.2 |
| C | 14 | 234 | 19462 | 60.41 | 1319 | 1325 | 300.2 |
| C | 13 | 61 | 10050 | 29.06 | 1319 | 1325 | 300.2 |
| D | 8 | 195 | 260442 | 761.45 | 1335 | 1301 | 340.3 |
| D | 1 | 52 | 201427 | 588.04 | 1335 | 1301 | 340.3 |
| D | 7 | 71 | 107730 | 312.73 | 1335 | 1301 | 340.3 |
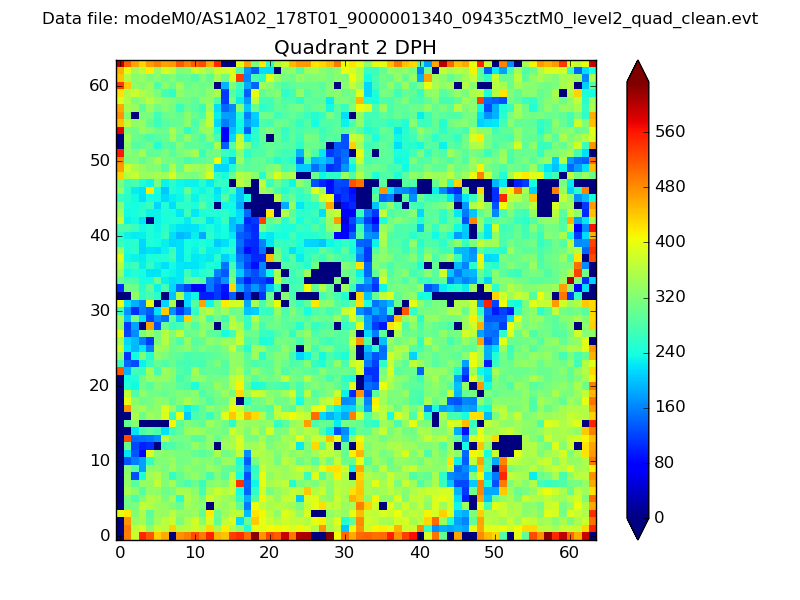
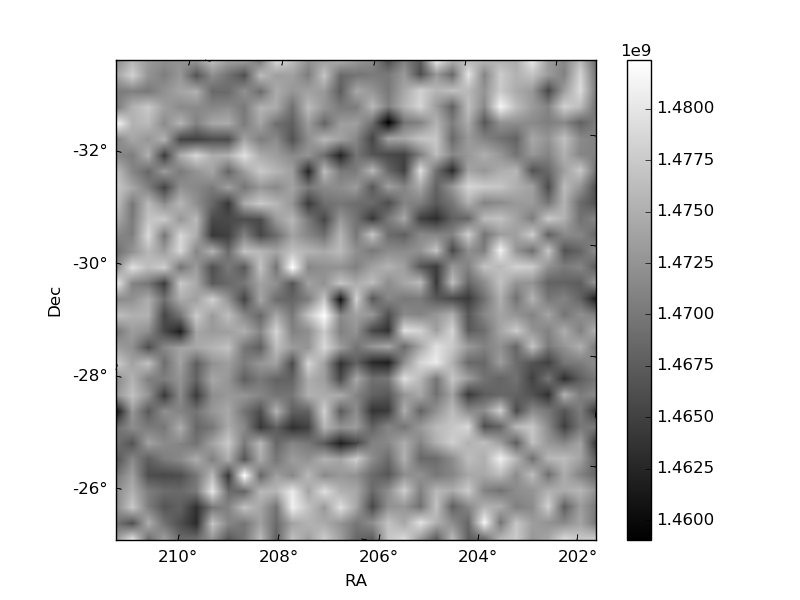
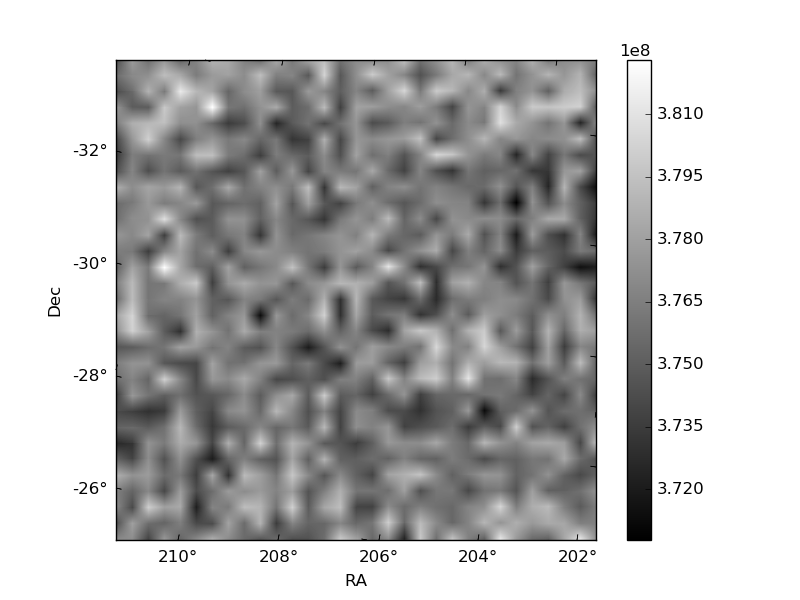
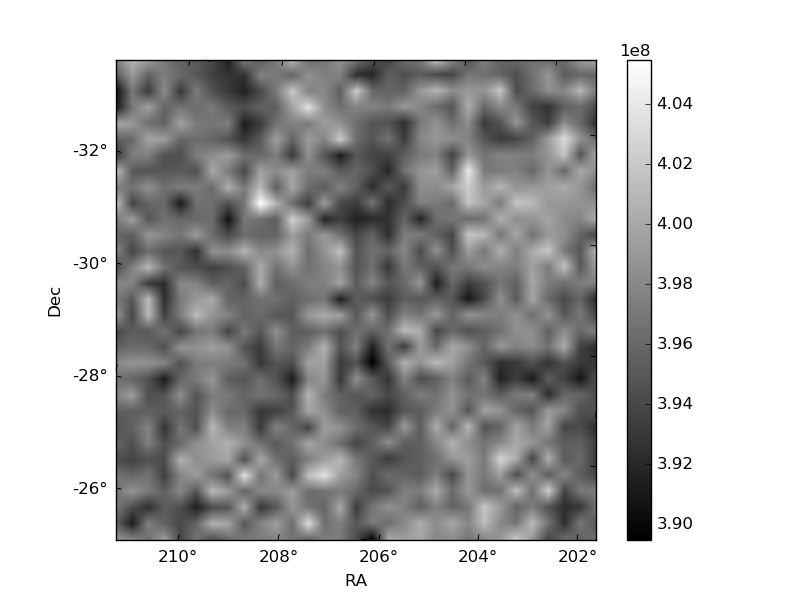
Histogram calculated using DETX and DETY for each event in the final _common_clean file
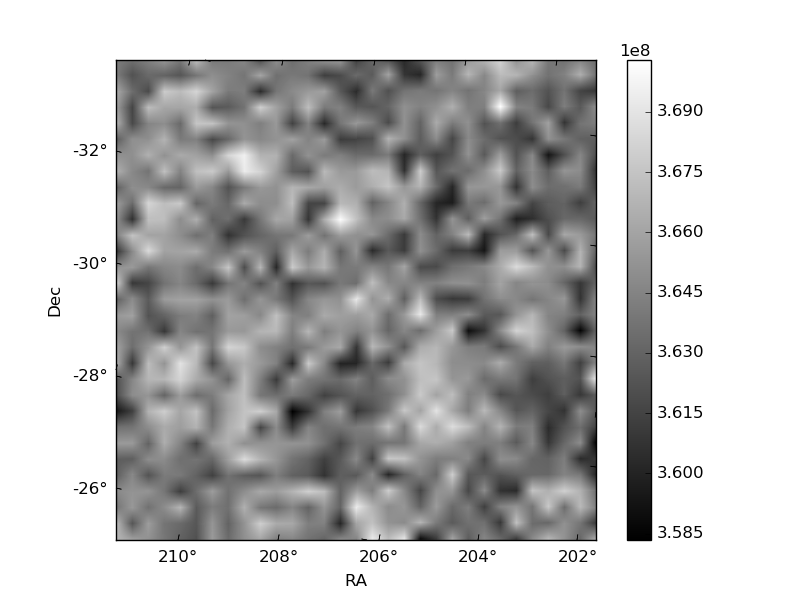
| Quadrant A | 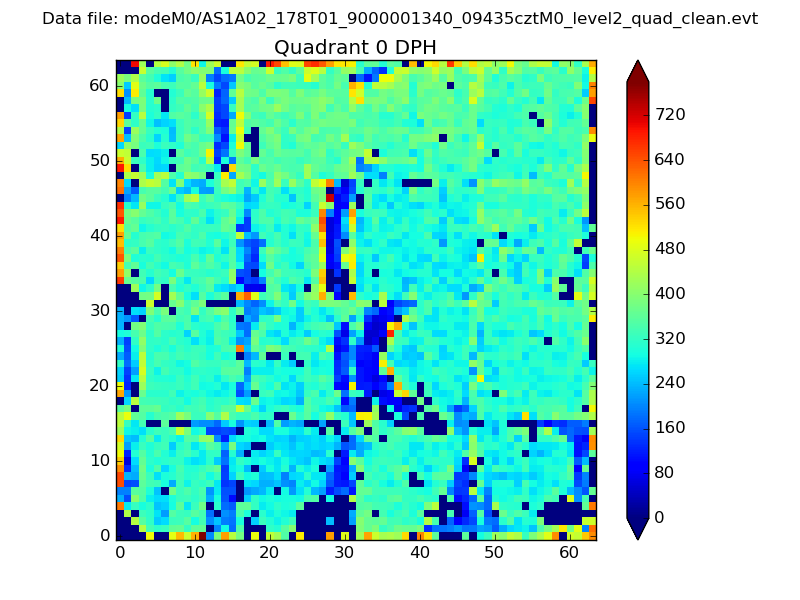 |
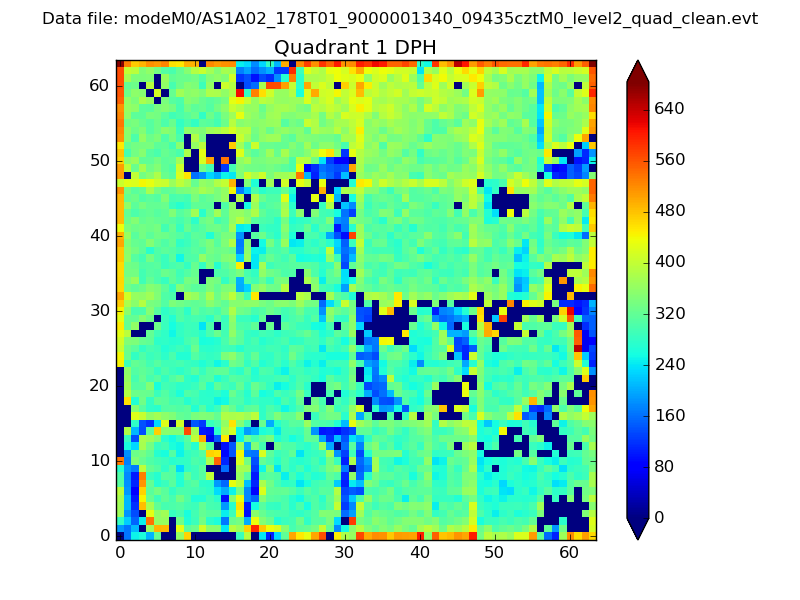 |
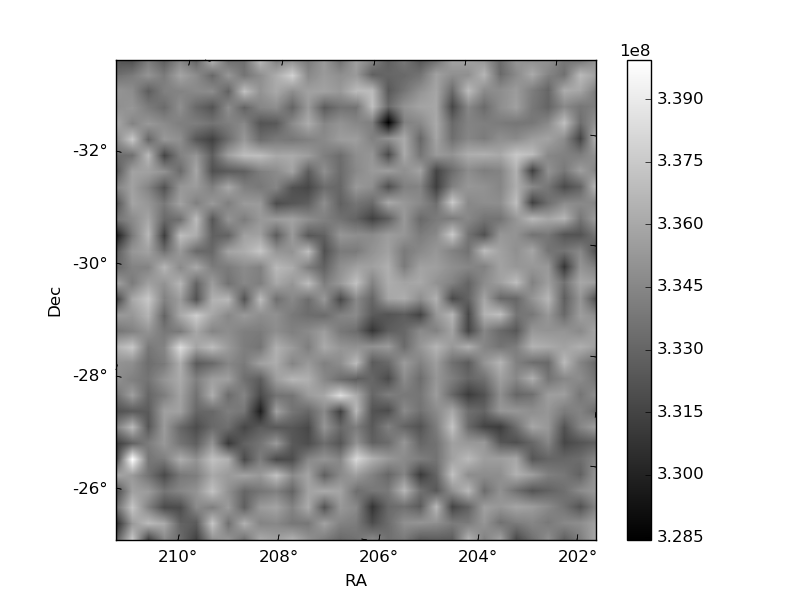
Quadrant B |
|---|---|---|---|
| Quadrant D | 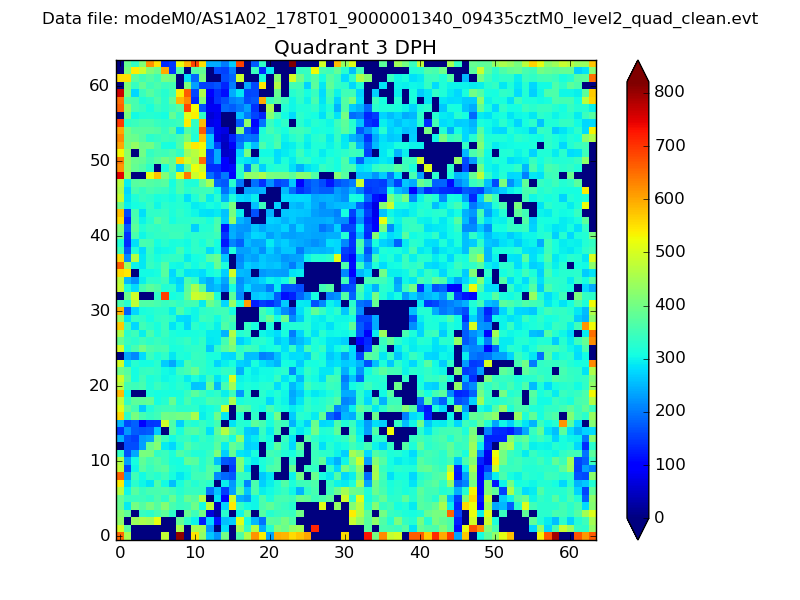 |
 |
Quadrant C |
| Plot type | Count rate plots | Images |
|---|---|---|
| Comparison with Poisson distribution Blue bars denote a histogram of data divided into 1 sec bins. Red curve is a Poisson curve with rate = median count rate of data. |
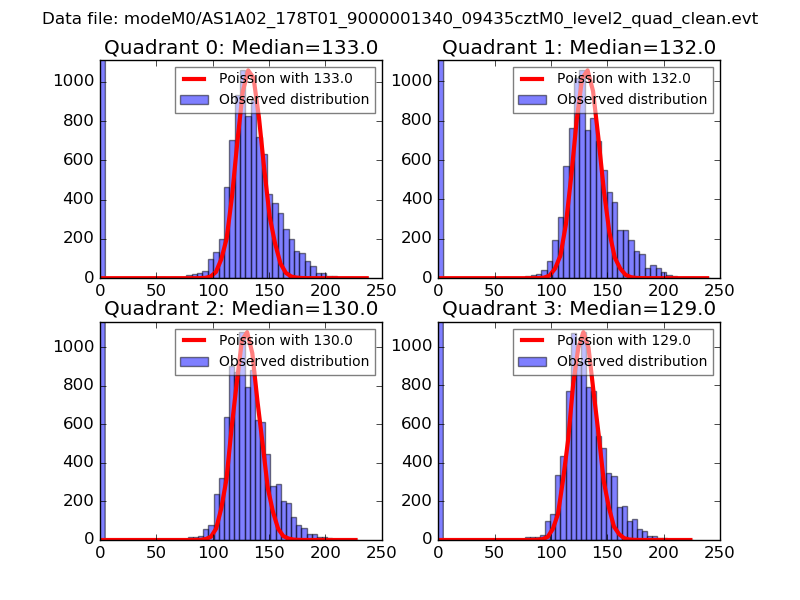 |
 |
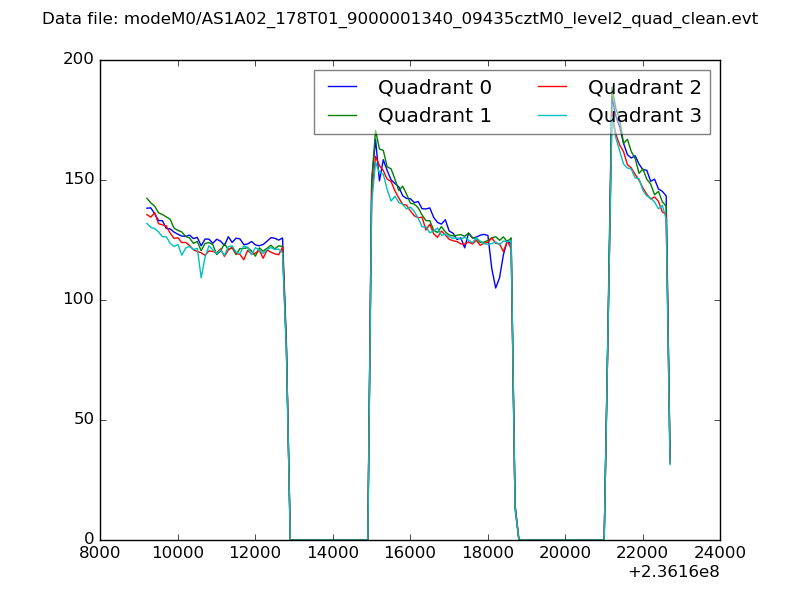
| Quadrant-wise count rates Data is divided into 100 sec bins |
 |
|
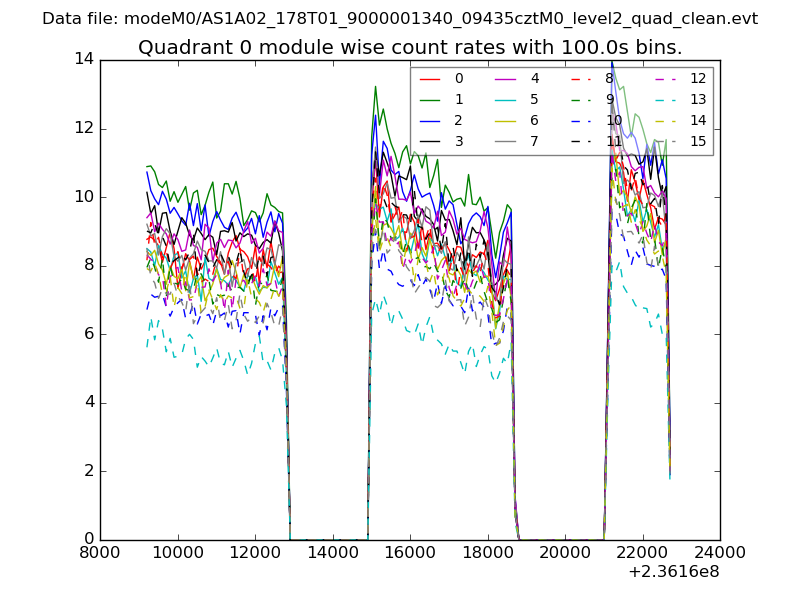
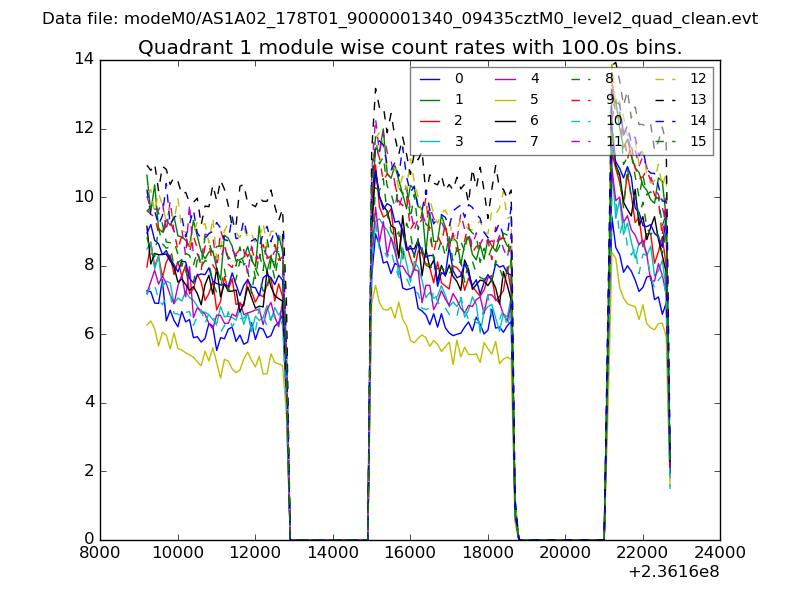
| Module-wise count rates for Quadrant A Data is divided into 100 sec bins |
 |
 |
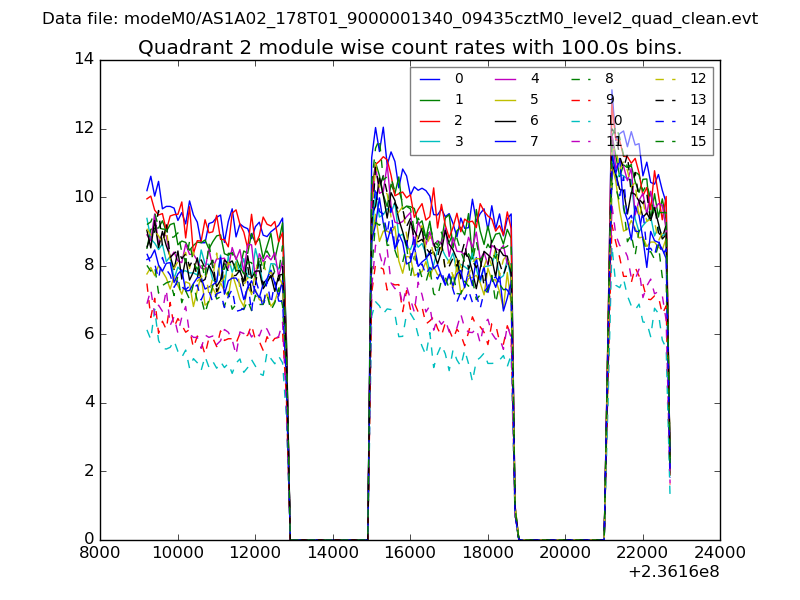
| Module-wise count rates for Quadrant B Data is divided into 100 sec bins |
 |
 |
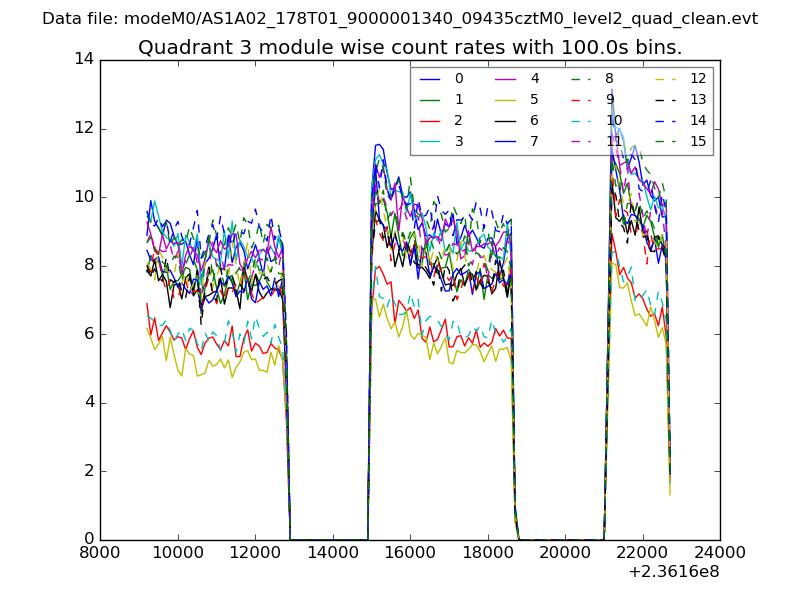
| Module-wise count rates for Quadrant C Data is divided into 100 sec bins |
 |
 |
| Module-wise count rates for Quadrant D Data is divided into 100 sec bins |
 |
 |
| Parameter | Plot |
|---|---|
| CZT HV Monitor | 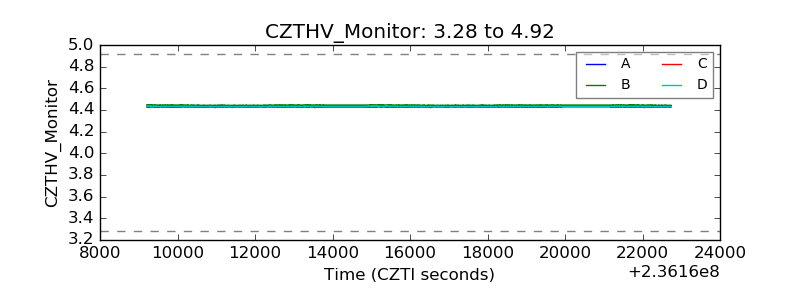 |
| D_VDD | 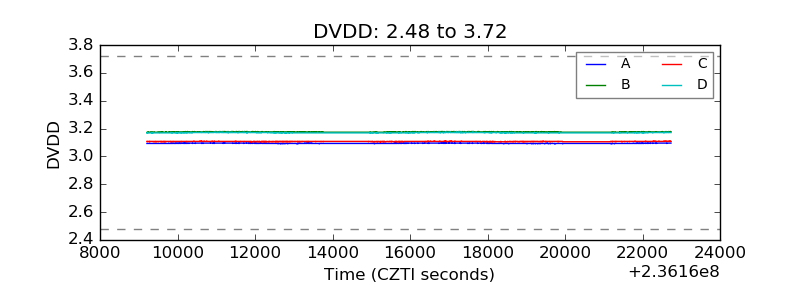 |
| Temperature 1 | 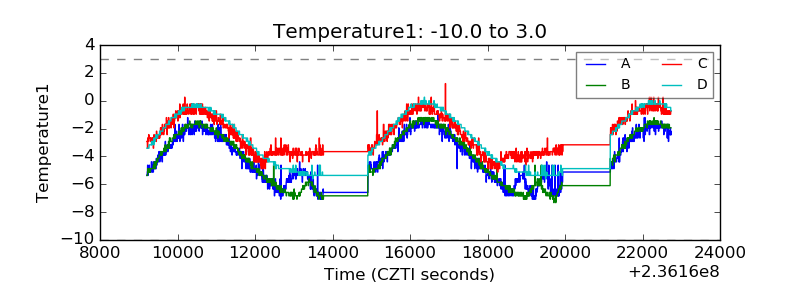 |
| Veto HV Monitor | 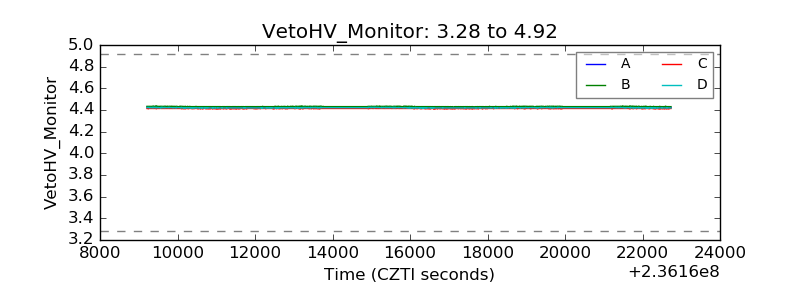 |
| Veto LLD | 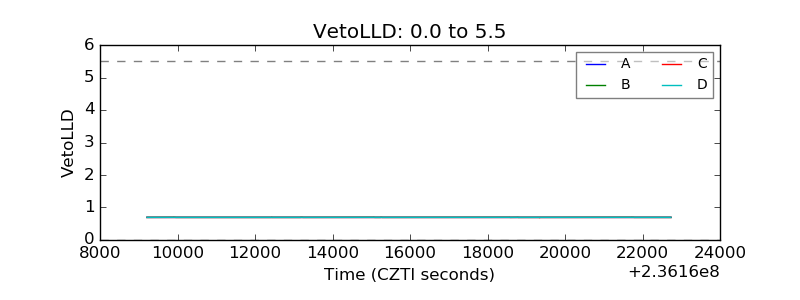 |
| Alpha Counter |  |
| _CPM_Rate | 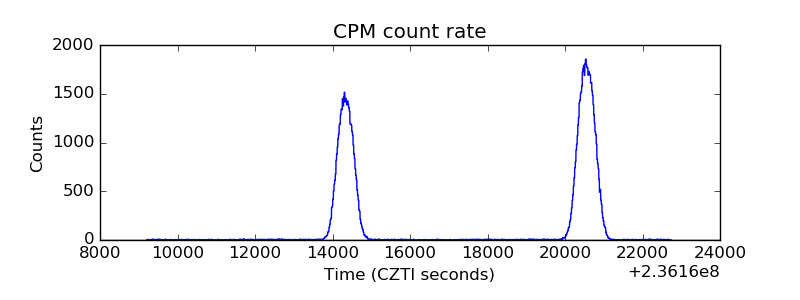 |
| CZT Counter | 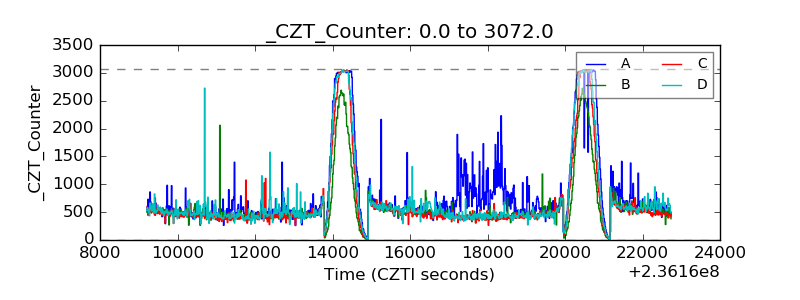 |
| +2.5 Volts monitor |  |
| +5 Volts monitor |  |
| _ROLL_ROT | 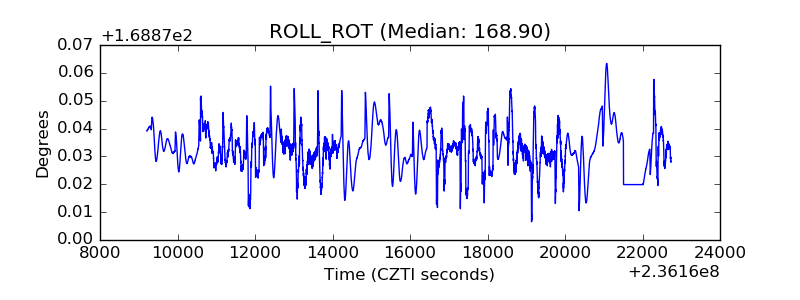 |
| _Roll_DEC | 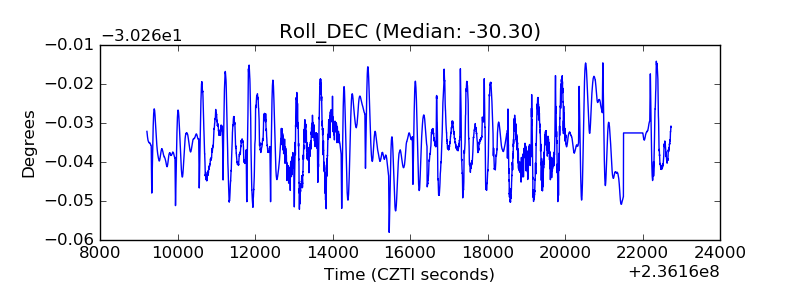 |
| _Roll_RA | 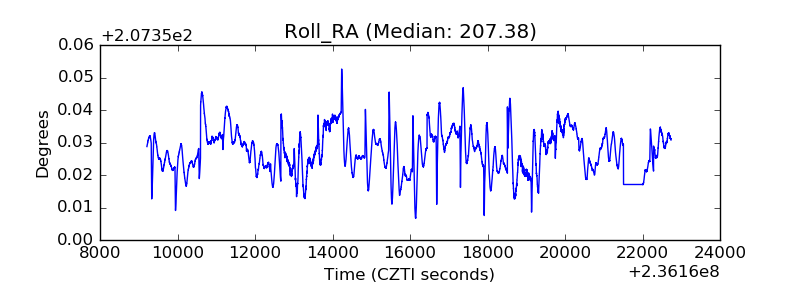 |
| Veto Counter | 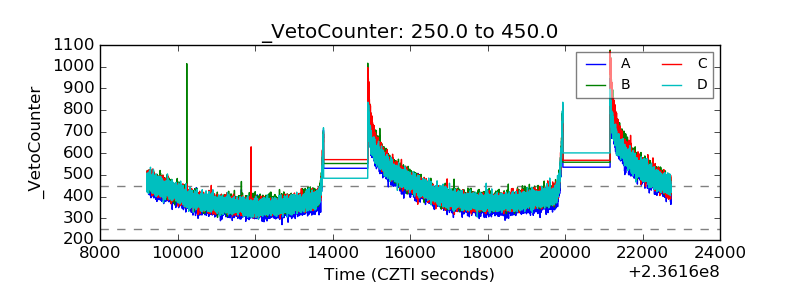 |