| Param | Original file | Final file |
|---|---|---|
| Filename | modeM0/AS1A02_178T01_9000001340_09436cztM0_level2.evt | modeM0/AS1A02_178T01_9000001340_09436cztM0_level2_quad_clean.evt |
| Size (bytes) | 480,991,680 | 109,051,200 |
| Size | 458.7 MB | 104.0 MB |
| Events in quadrant A | 4,016,341 | 731,222 |
| Events in quadrant B | 3,427,770 | 723,581 |
| Events in quadrant C | 3,164,679 | 699,308 |
| Events in quadrant D | 3,517,574 | 695,969 |
| Mode SS | |||
|---|---|---|---|
| Quadrant | BADHDUFLAG | Total packets | Discarded packets |
| A | 0 | 132 | 0 |
| B | 0 | 132 | 0 |
| C | 0 | 132 | 0 |
| D | 0 | 132 | 0 |
| Mode M0 | |||
|---|---|---|---|
| Quadrant | BADHDUFLAG | Total packets | Discarded packets |
| A | 0 | 16109 | 3 |
| B | 0 | 14441 | 2 |
| C | 0 | 13727 | 2 |
| D | 0 | 14593 | 2 |
| Mode M9 | |||
|---|---|---|---|
| Quadrant | BADHDUFLAG | Total packets | Discarded packets |
| A | 0 | 13 | 0 |
| B | 0 | 13 | 0 |
| C | 0 | 13 | 0 |
| D | 0 | 13 | 0 |
| Quadrant | Total seconds | Saturated seconds | Saturation percentage |
|---|---|---|---|
| A | 6490 | 114 | 1.756549% |
| B | 6490 | 81 | 1.248074% |
| C | 6490 | 46 | 0.708783% |
| D | 6490 | 73 | 1.124807% |
Noise dominated data is calculated using 1-second bins in cleaned event files. If a bin has >2000 counts, and if more than 50% of those come from <1% of pixels, then it is considered to be noise-dominated and hence unusable.
| Quadrant | # 1 sec bins | Bins with >0 counts | Bins with >2000 counts | High rate bins dominated by noise | Noise dominated (total time) | Noise dominated (detector-on time) | Marked lightcurve |
|---|---|---|---|---|---|---|---|
| A | 7780 | 6491 | 8 | 8 | 0.10% | 0.12% | 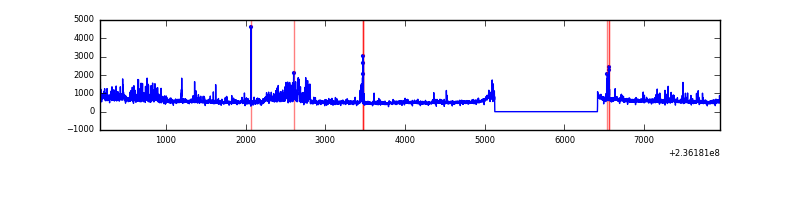 |
| B | 7780 | 6491 | 8 | 8 | 0.10% | 0.12% | 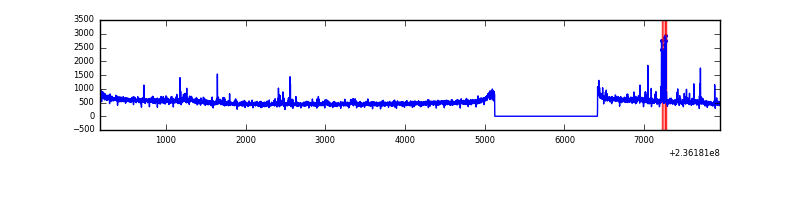 |
| C | 7780 | 6491 | 0 | 0 | 0.00% | 0.00% | 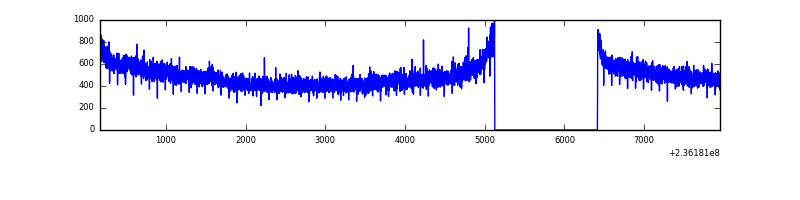 |
| D | 7780 | 6491 | 16 | 16 | 0.21% | 0.25% |  |
Top three noisy pixels from each quadrant. If the there are fewer than three noisy pixels in the level2.evt file, extra rows are filled as -1
| Pixel properties | Quadrant properties | ||||||
|---|---|---|---|---|---|---|---|
| Quadrant | DetID | PixID | Counts | Sigma | Mean | Median | Sigma |
| A | 8 | 5 | 641562 | 3723.91 | 846 | 831 | 172.1 |
| A | 1 | 162 | 56238 | 322.02 | 846 | 831 | 172.1 |
| A | 14 | 111 | 18223 | 101.08 | 846 | 831 | 172.1 |
| B | 0 | 246 | 46796 | 291.73 | 832 | 817 | 157.6 |
| B | 0 | 214 | 46790 | 291.7 | 832 | 817 | 157.6 |
| B | 0 | 219 | 34054 | 210.89 | 832 | 817 | 157.6 |
| C | 9 | 68 | 53297 | 288.57 | 796 | 801 | 181.9 |
| C | 13 | 61 | 6251 | 29.96 | 796 | 801 | 181.9 |
| C | 14 | 234 | 2669 | 10.27 | 796 | 801 | 181.9 |
| D | 8 | 195 | 274915 | 1305.2 | 810 | 791 | 210.0 |
| D | 7 | 71 | 46454 | 217.42 | 810 | 791 | 210.0 |
| D | 12 | 227 | 42381 | 198.02 | 810 | 791 | 210.0 |
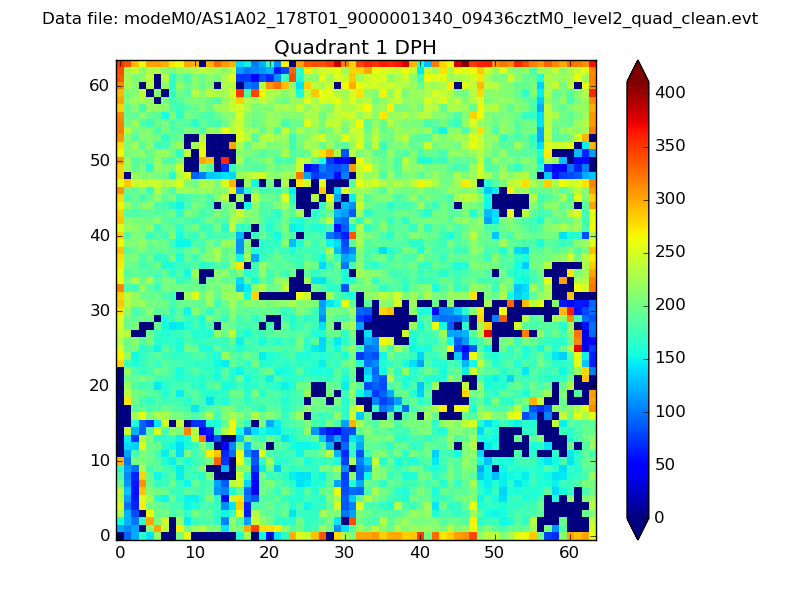
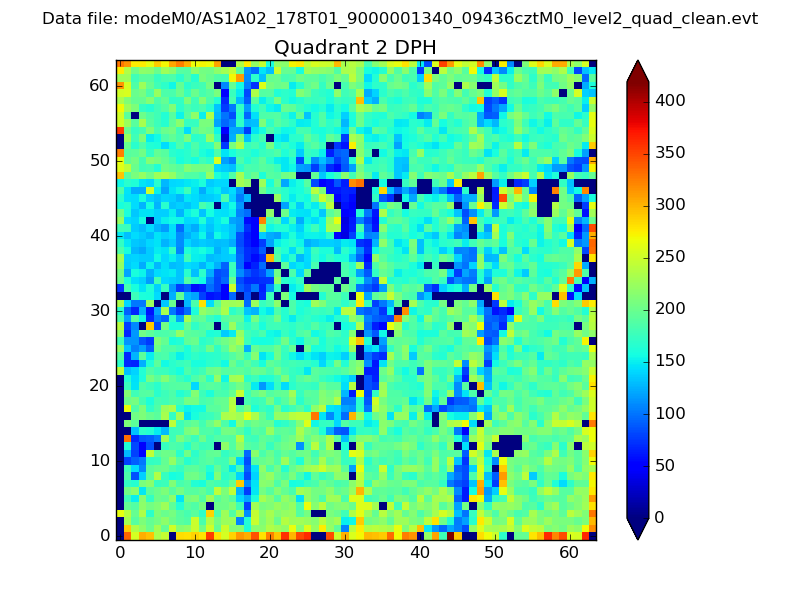
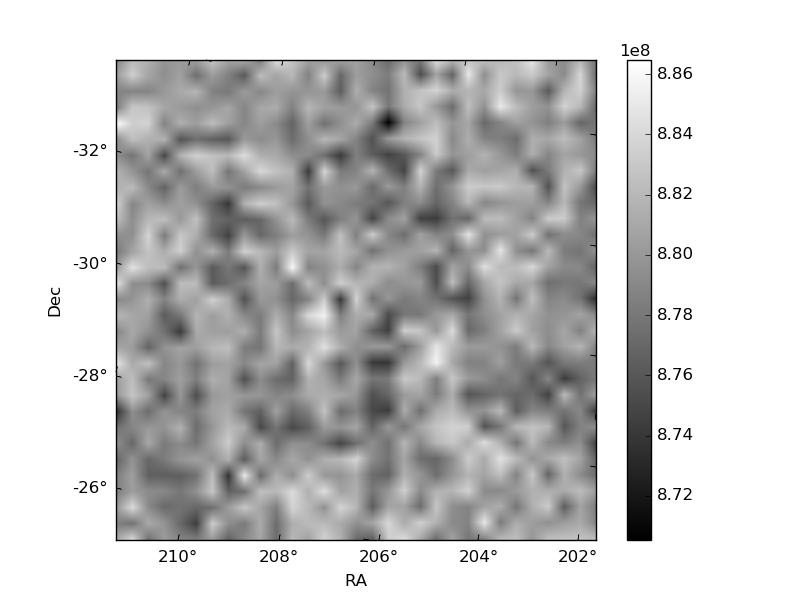
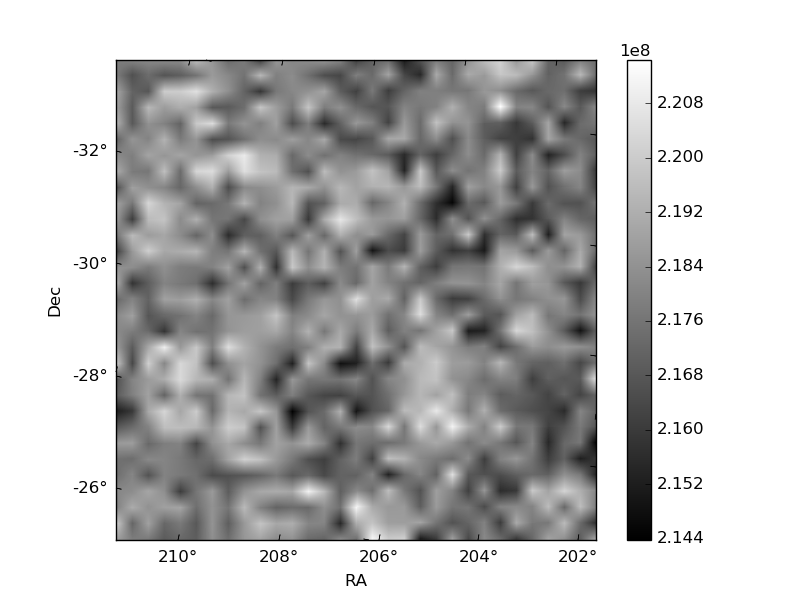
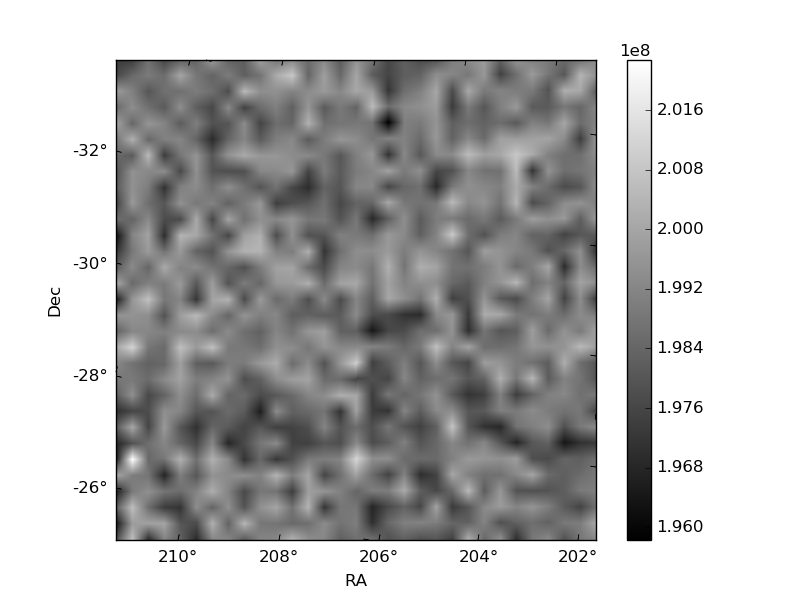
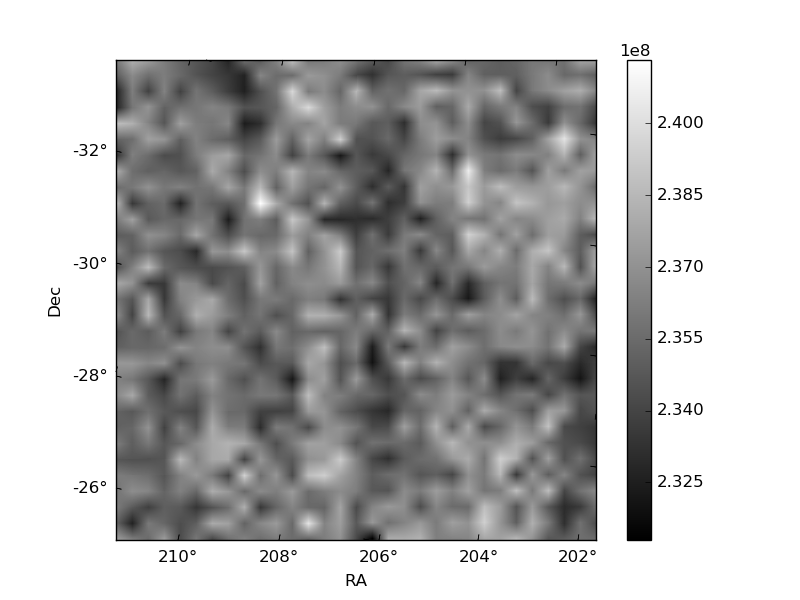
Histogram calculated using DETX and DETY for each event in the final _common_clean file
| Quadrant A | 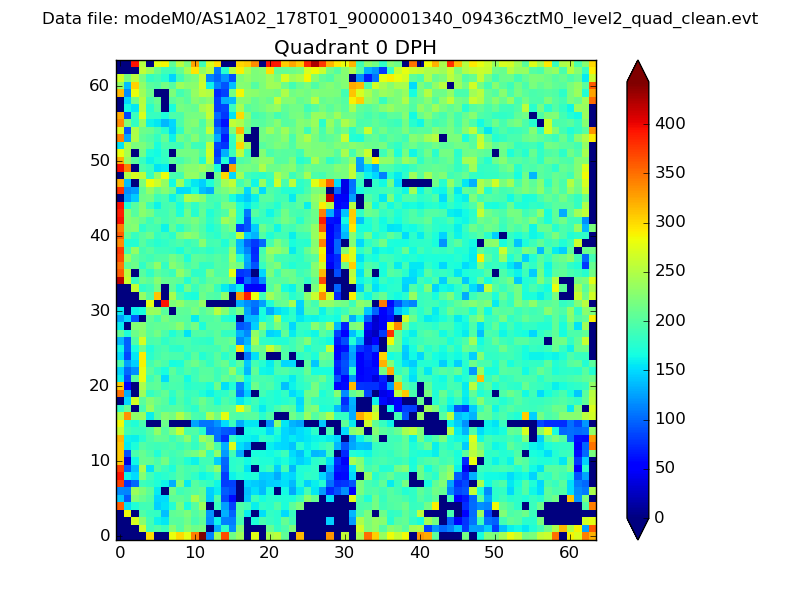 |
 |
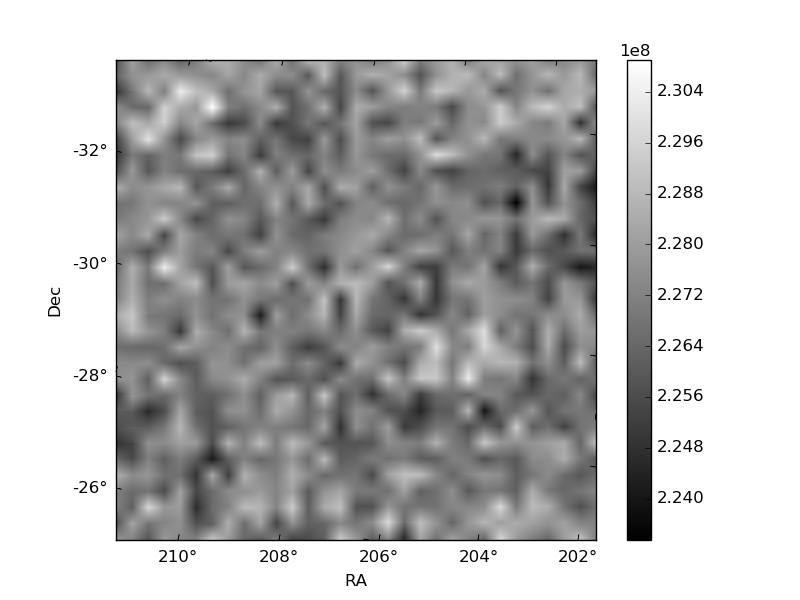
Quadrant B |
|---|---|---|---|
| Quadrant D | 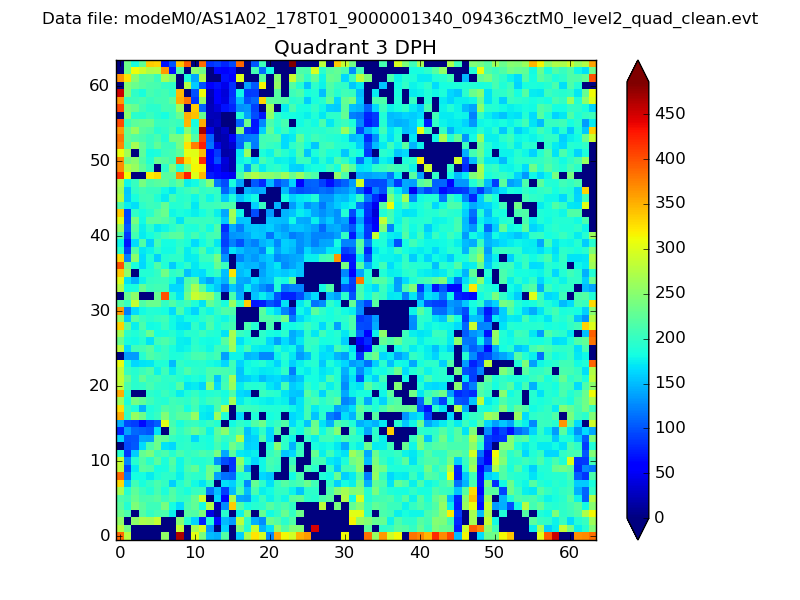 |
 |
Quadrant C |
| Plot type | Count rate plots | Images |
|---|---|---|
| Comparison with Poisson distribution Blue bars denote a histogram of data divided into 1 sec bins. Red curve is a Poisson curve with rate = median count rate of data. |
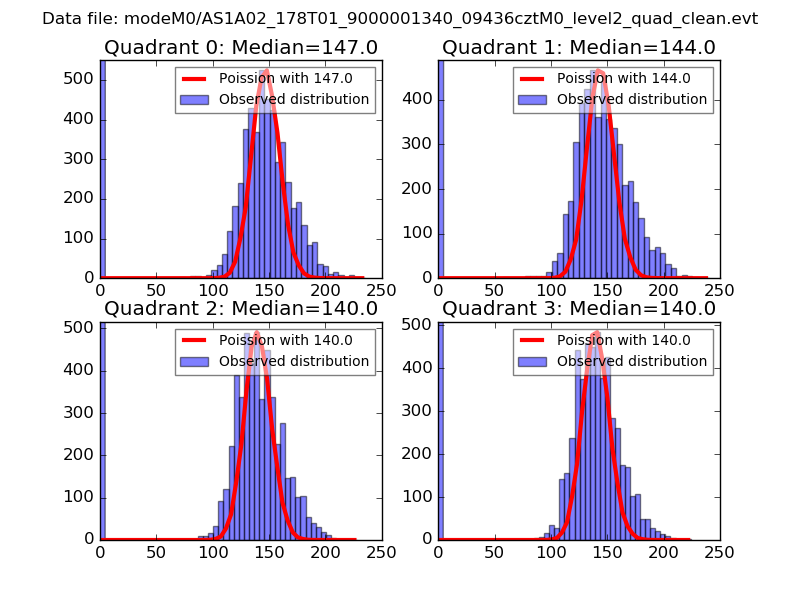 |
 |
| Quadrant-wise count rates Data is divided into 100 sec bins |
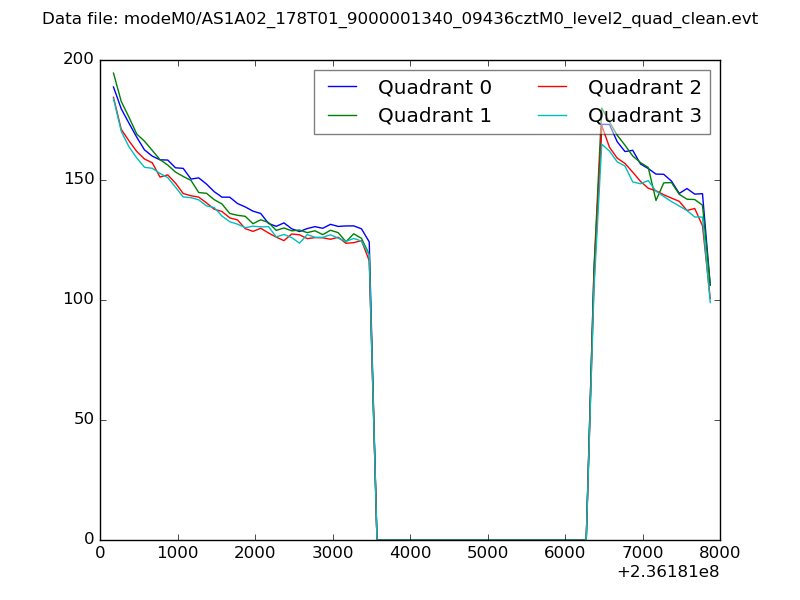 |
|
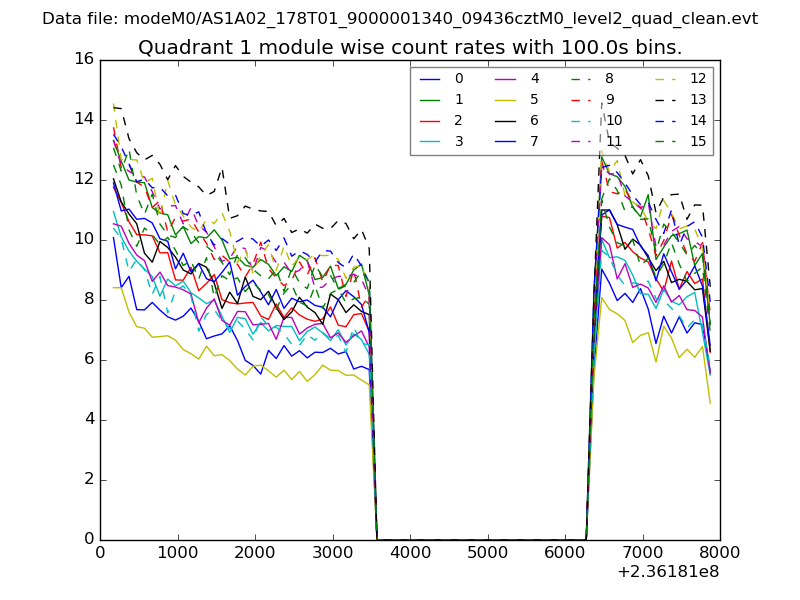
| Module-wise count rates for Quadrant A Data is divided into 100 sec bins |
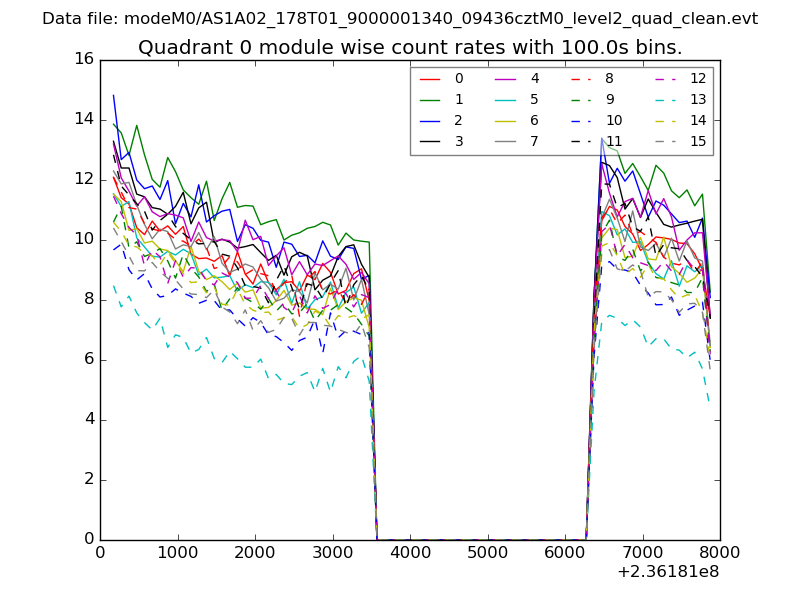 |
 |
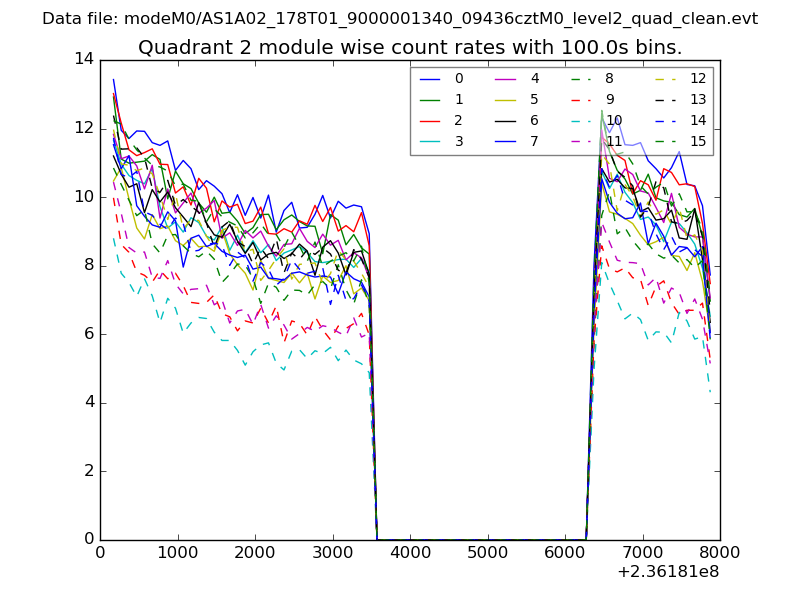
| Module-wise count rates for Quadrant B Data is divided into 100 sec bins |
 |
 |
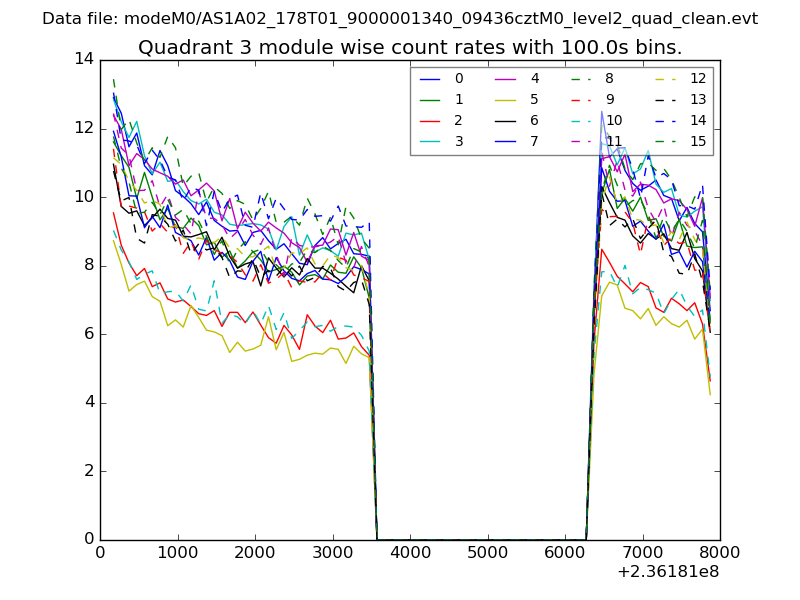
| Module-wise count rates for Quadrant C Data is divided into 100 sec bins |
 |
 |
| Module-wise count rates for Quadrant D Data is divided into 100 sec bins |
 |
 |
| Parameter | Plot |
|---|---|
| CZT HV Monitor | 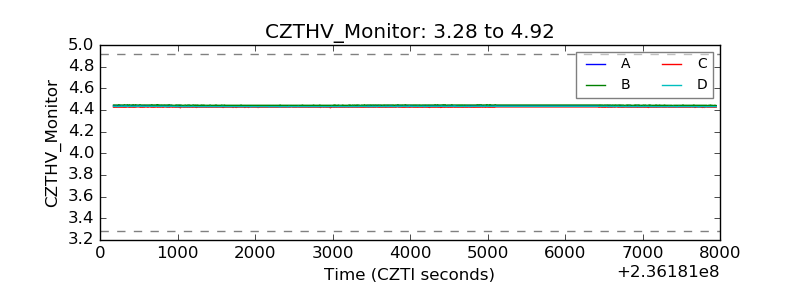 |
| D_VDD |  |
| Temperature 1 | 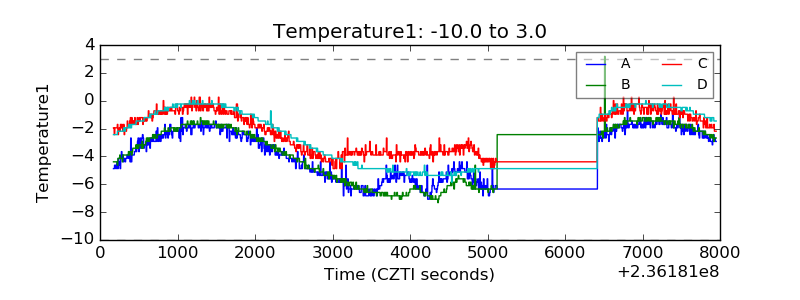 |
| Veto HV Monitor |  |
| Veto LLD | 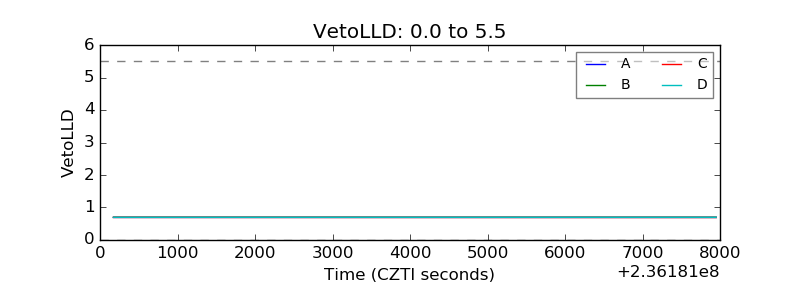 |
| Alpha Counter | 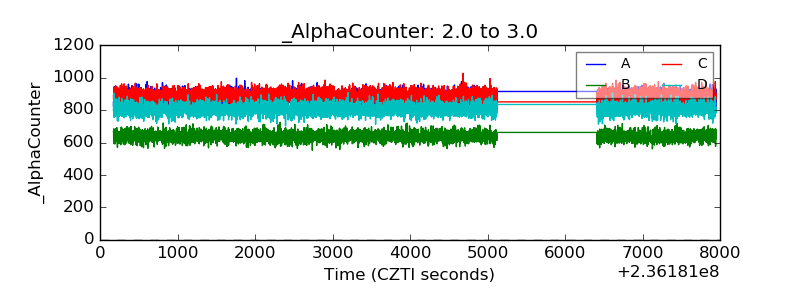 |
| _CPM_Rate | 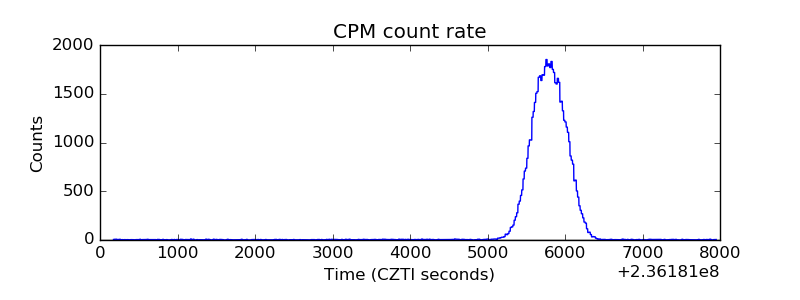 |
| CZT Counter | 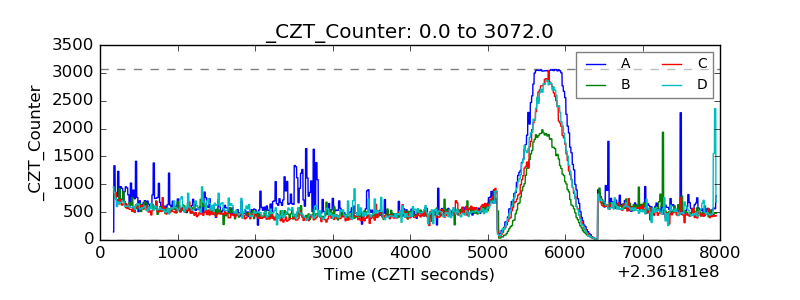 |
| +2.5 Volts monitor |  |
| +5 Volts monitor |  |
| _ROLL_ROT | 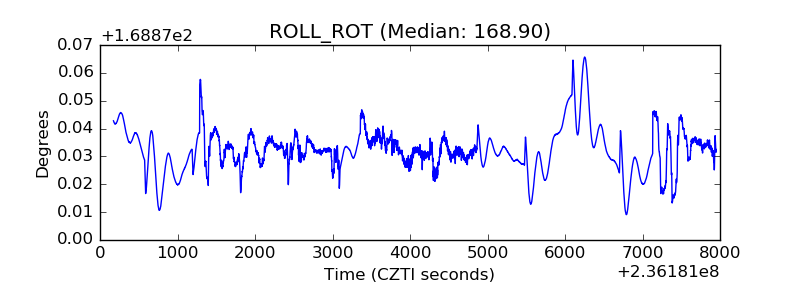 |
| _Roll_DEC | 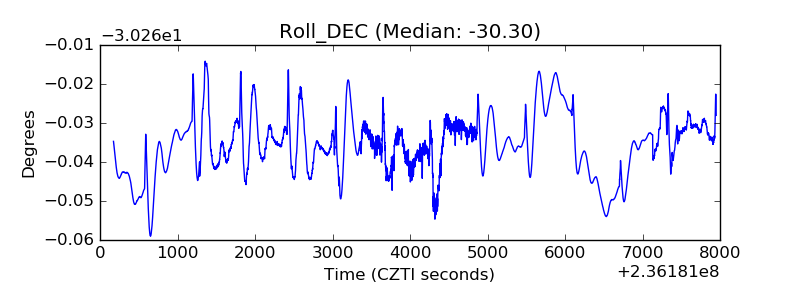 |
| _Roll_RA |  |
| Veto Counter | 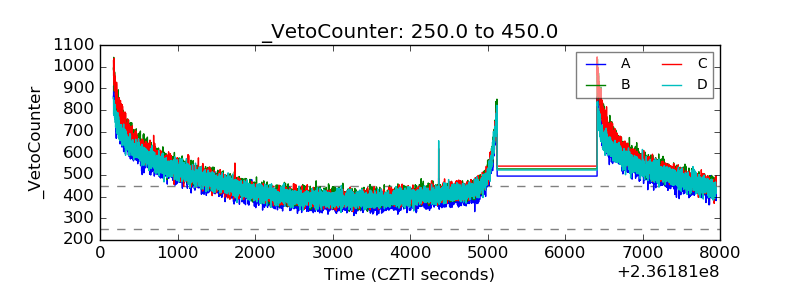 |