| Param | Original file | Final file |
|---|---|---|
| Filename | modeM0/AS1A02_178T01_9000001340_09438cztM0_level2.evt | modeM0/AS1A02_178T01_9000001340_09438cztM0_level2_quad_clean.evt |
| Size (bytes) | 437,094,720 | 88,318,080 |
| Size | 416.8 MB | 84.2 MB |
| Events in quadrant A | 3,477,589 | 573,019 |
| Events in quadrant B | 3,160,960 | 568,156 |
| Events in quadrant C | 2,949,734 | 555,310 |
| Events in quadrant D | 3,223,195 | 540,950 |
| Mode SS | |||
|---|---|---|---|
| Quadrant | BADHDUFLAG | Total packets | Discarded packets |
| A | 0 | 128 | 2 |
| B | 0 | 128 | 0 |
| C | 0 | 128 | 2 |
| D | 0 | 128 | 0 |
| Mode M0 | |||
|---|---|---|---|
| Quadrant | BADHDUFLAG | Total packets | Discarded packets |
| A | 0 | 14623 | 208 |
| B | 0 | 13701 | 207 |
| C | 0 | 13268 | 145 |
| D | 0 | 14043 | 185 |
| Mode M9 | |||
|---|---|---|---|
| Quadrant | BADHDUFLAG | Total packets | Discarded packets |
| A | 0 | 18 | 0 |
| B | 0 | 18 | 0 |
| C | 0 | 18 | 0 |
| D | 0 | 19 | 0 |
| Quadrant | Total seconds | Saturated seconds | Saturation percentage |
|---|---|---|---|
| A | 6255 | 110 | 1.758593% |
| B | 6250 | 108 | 1.728000% |
| C | 6273 | 70 | 1.115894% |
| D | 6264 | 109 | 1.740102% |
Noise dominated data is calculated using 1-second bins in cleaned event files. If a bin has >2000 counts, and if more than 50% of those come from <1% of pixels, then it is considered to be noise-dominated and hence unusable.
| Quadrant | # 1 sec bins | Bins with >0 counts | Bins with >2000 counts | High rate bins dominated by noise | Noise dominated (total time) | Noise dominated (detector-on time) | Marked lightcurve |
|---|---|---|---|---|---|---|---|
| A | 7534 | 6337 | 4 | 4 | 0.05% | 0.06% | 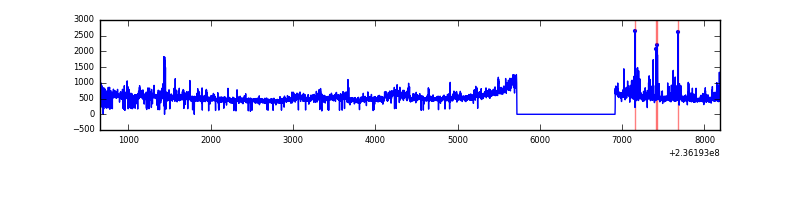 |
| B | 7534 | 6333 | 3 | 3 | 0.04% | 0.05% | 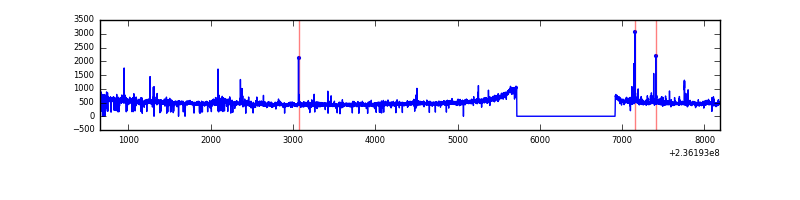 |
| C | 7534 | 6337 | 1 | 1 | 0.01% | 0.02% | 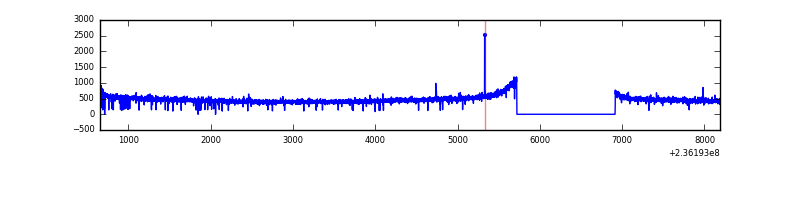 |
| D | 7534 | 6334 | 58 | 58 | 0.77% | 0.92% | 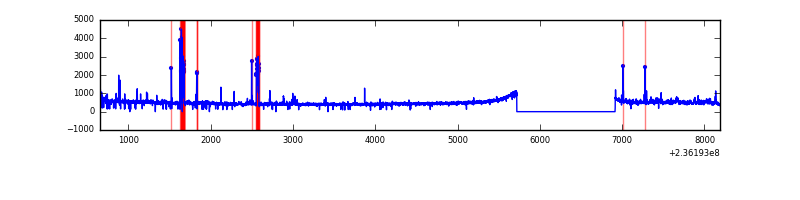 |
Top three noisy pixels from each quadrant. If the there are fewer than three noisy pixels in the level2.evt file, extra rows are filled as -1
| Pixel properties | Quadrant properties | ||||||
|---|---|---|---|---|---|---|---|
| Quadrant | DetID | PixID | Counts | Sigma | Mean | Median | Sigma |
| A | 8 | 5 | 428312 | 2711.54 | 779 | 765 | 157.7 |
| A | 1 | 162 | 19855 | 121.07 | 779 | 765 | 157.7 |
| A | 14 | 111 | 11713 | 69.43 | 779 | 765 | 157.7 |
| B | 0 | 229 | 68989 | 460.29 | 774 | 757 | 148.2 |
| B | 0 | 219 | 22032 | 143.52 | 774 | 757 | 148.2 |
| B | 0 | 246 | 20848 | 135.53 | 774 | 757 | 148.2 |
| C | 9 | 68 | 38825 | 218.63 | 743 | 749 | 174.2 |
| C | 13 | 61 | 5630 | 28.03 | 743 | 749 | 174.2 |
| C | 3 | 254 | 4092 | 19.2 | 743 | 749 | 174.2 |
| D | 8 | 195 | 115294 | 578.06 | 742 | 726 | 198.2 |
| D | 10 | 40 | 89864 | 449.75 | 742 | 726 | 198.2 |
| D | 12 | 227 | 82326 | 411.72 | 742 | 726 | 198.2 |
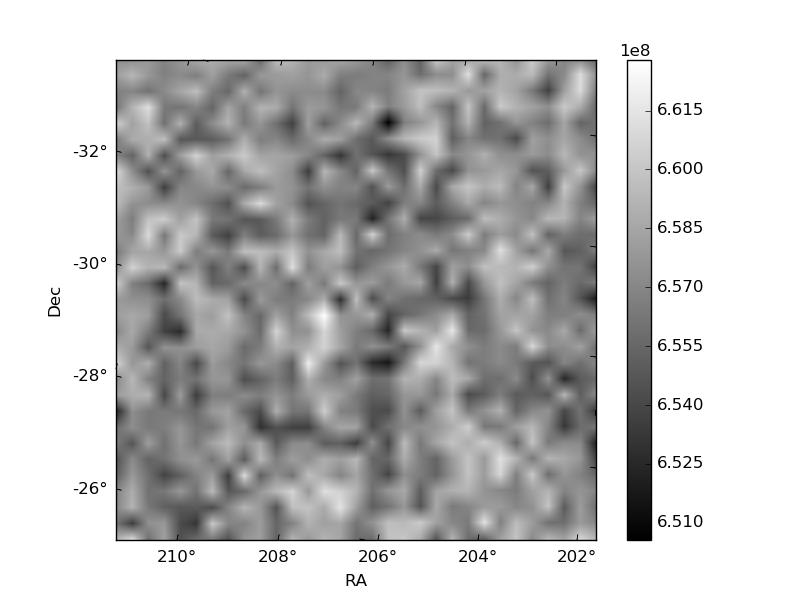
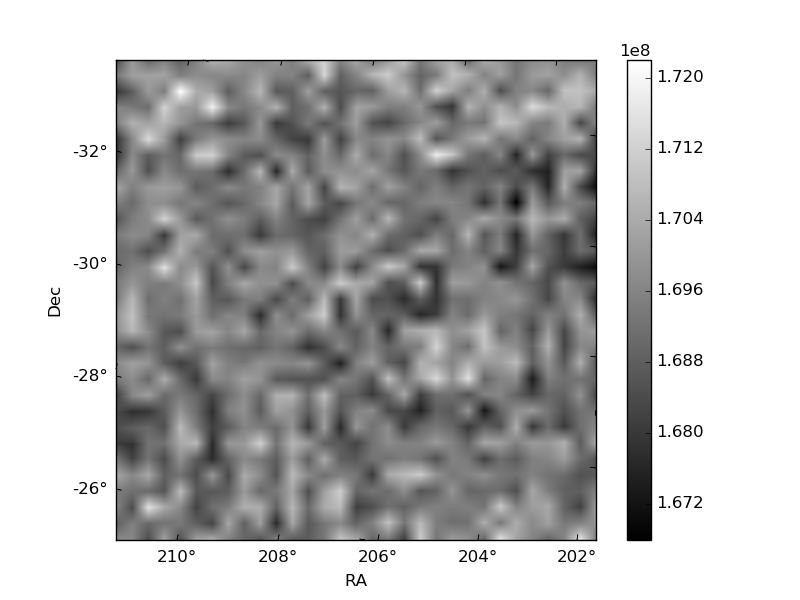
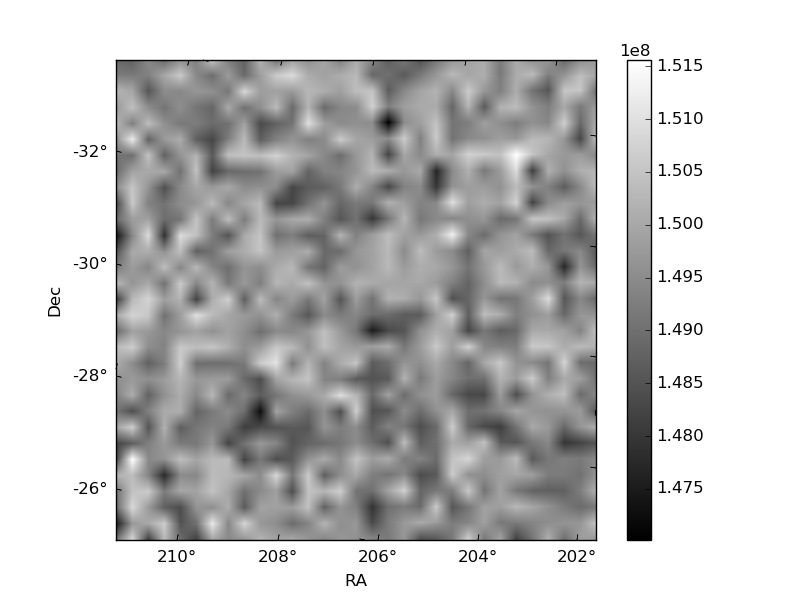
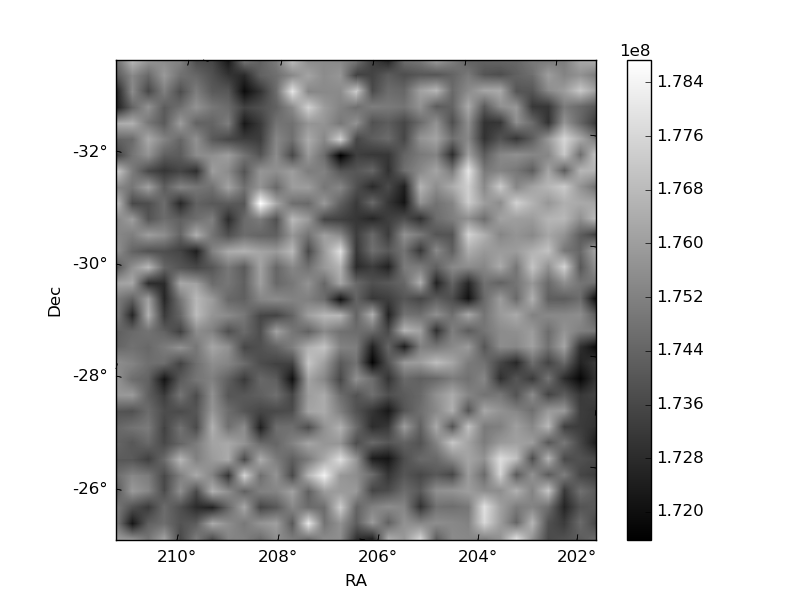
Histogram calculated using DETX and DETY for each event in the final _common_clean file
| Quadrant A | 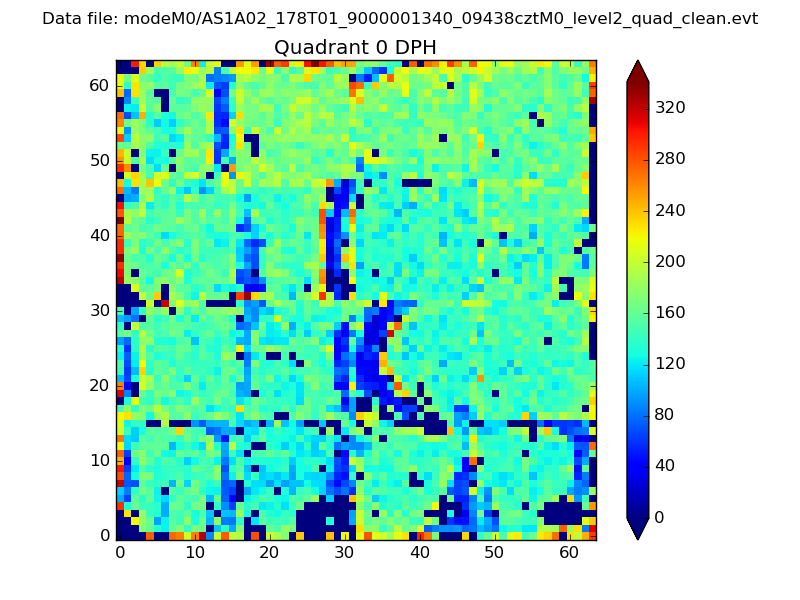 |
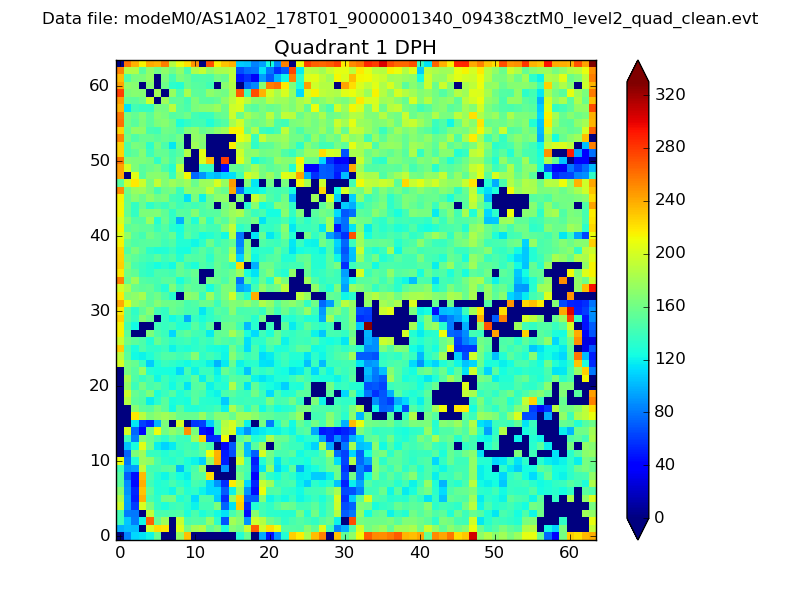 |
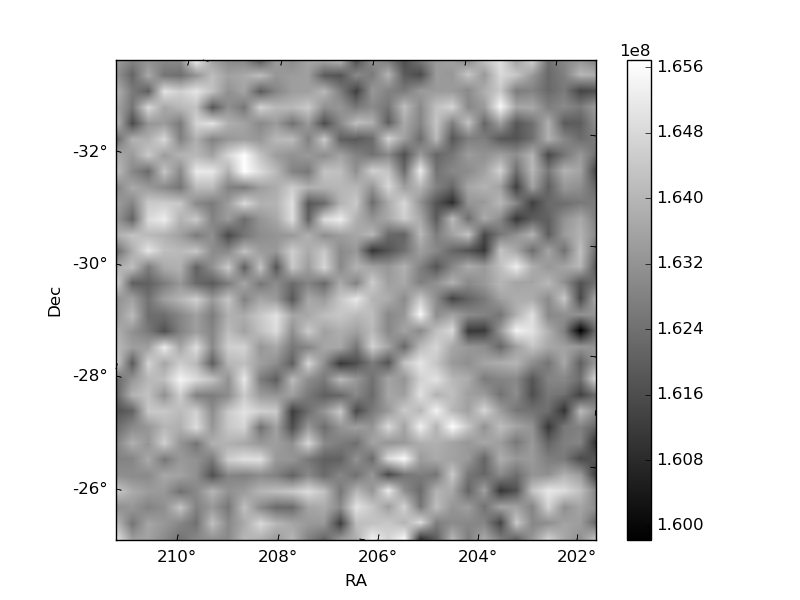
Quadrant B |
|---|---|---|---|
| Quadrant D | 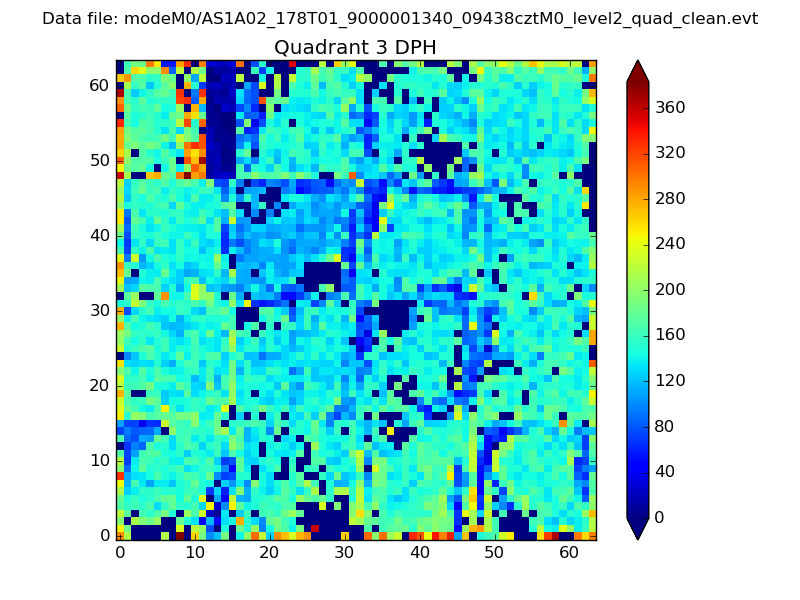 |
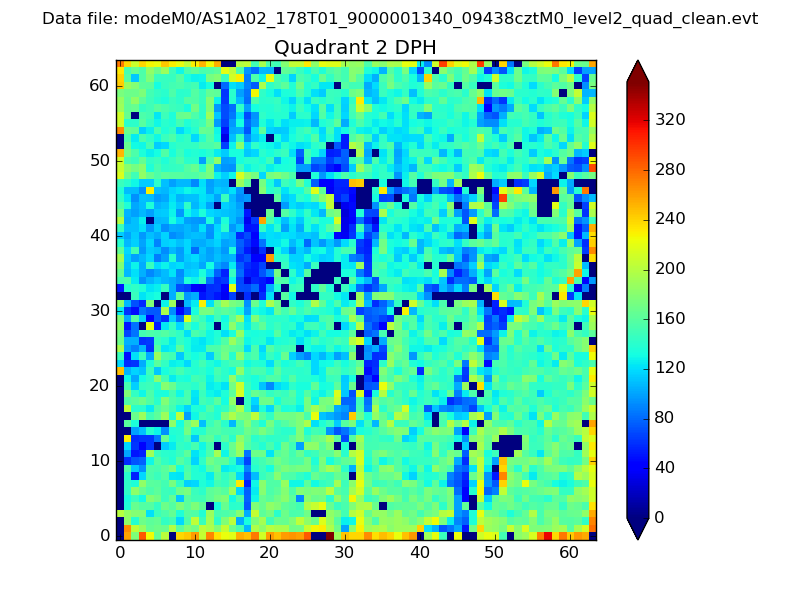 |
Quadrant C |
| Plot type | Count rate plots | Images |
|---|---|---|
| Comparison with Poisson distribution Blue bars denote a histogram of data divided into 1 sec bins. Red curve is a Poisson curve with rate = median count rate of data. |
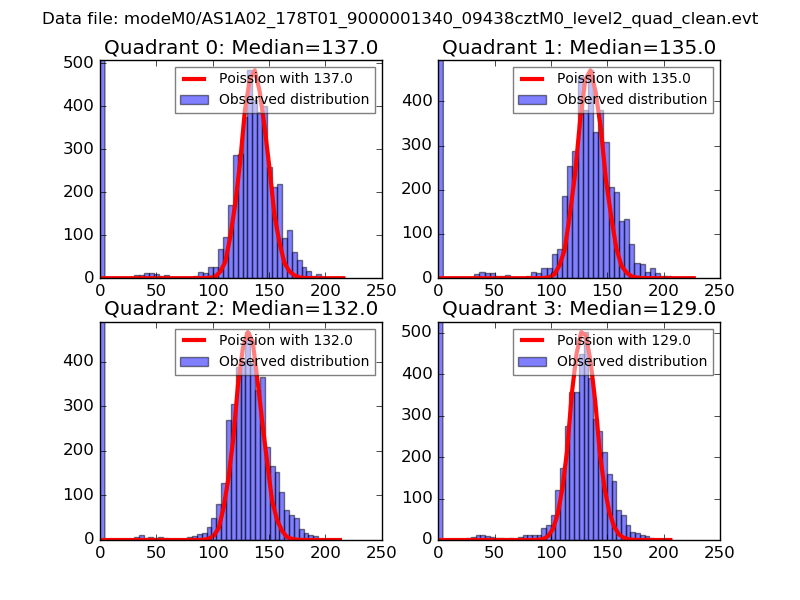 |
 |
| Quadrant-wise count rates Data is divided into 100 sec bins |
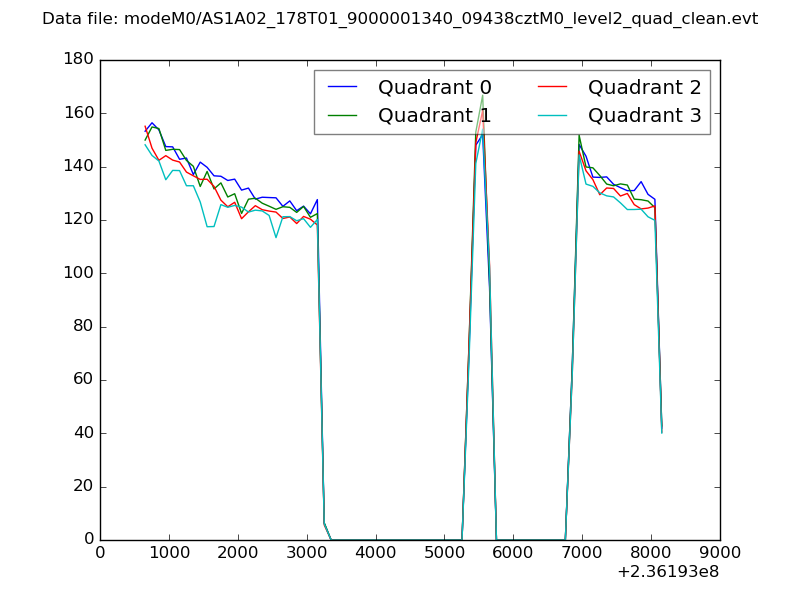 |
|
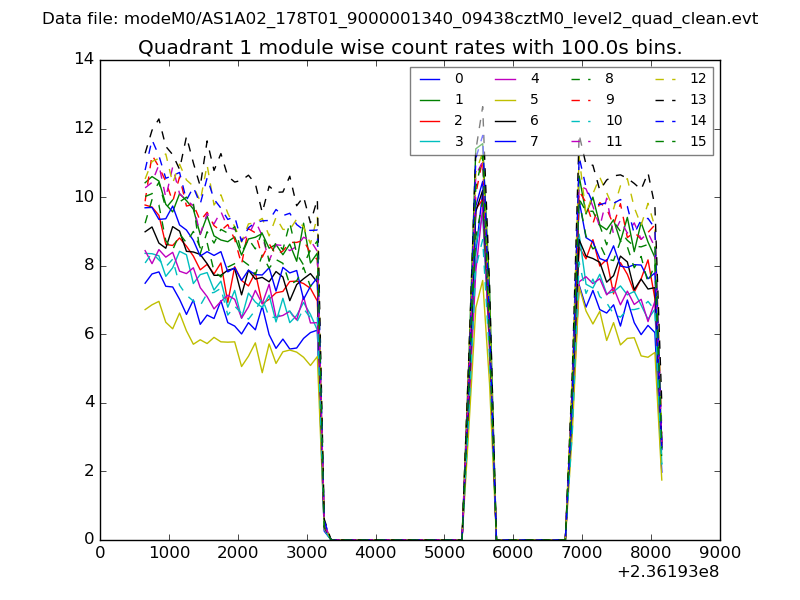
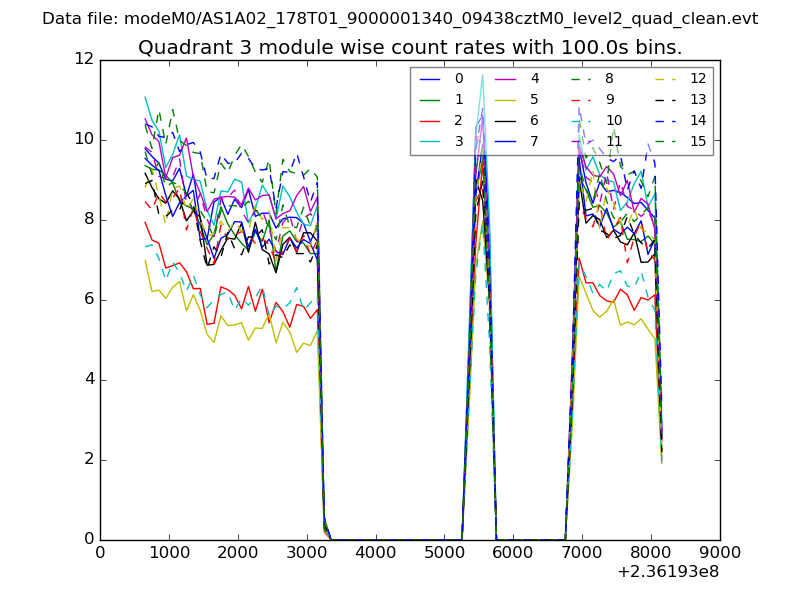
| Module-wise count rates for Quadrant A Data is divided into 100 sec bins |
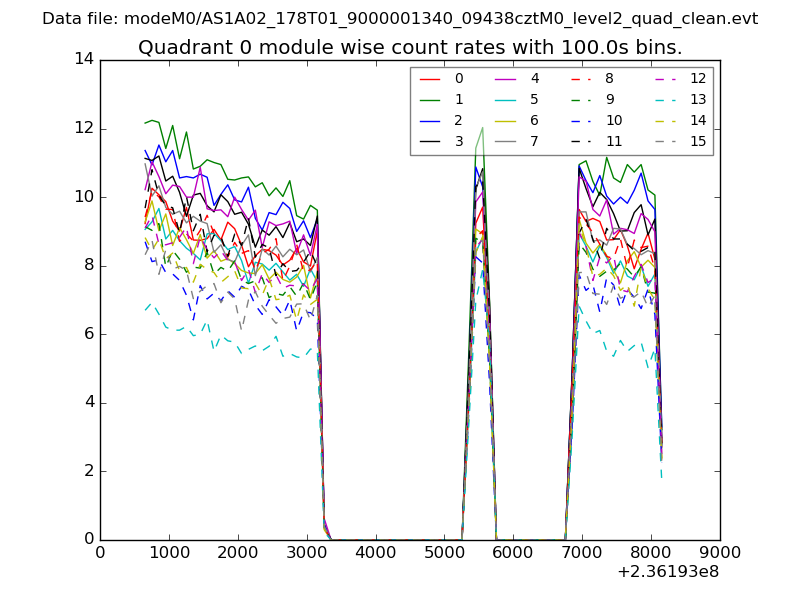 |
 |
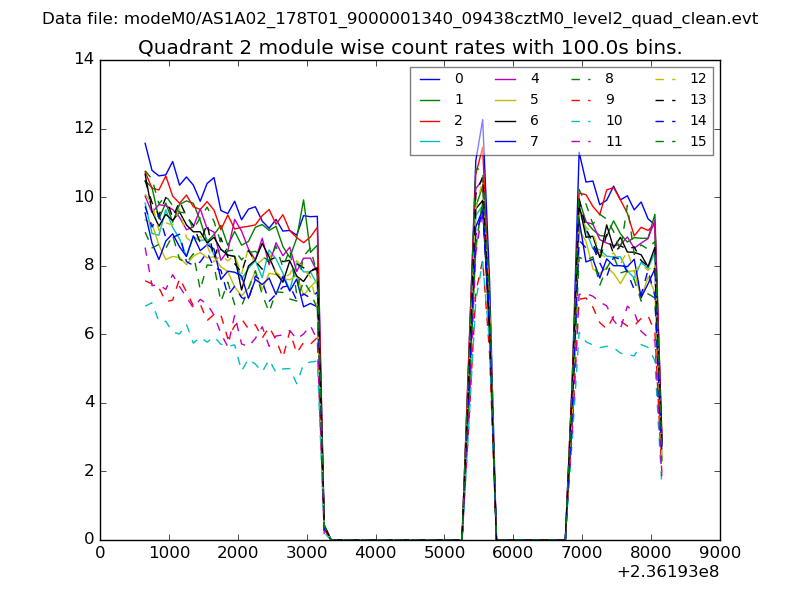
| Module-wise count rates for Quadrant B Data is divided into 100 sec bins |
 |
 |
| Module-wise count rates for Quadrant C Data is divided into 100 sec bins |
 |
 |
| Module-wise count rates for Quadrant D Data is divided into 100 sec bins |
 |
 |
| Parameter | Plot |
|---|---|
| CZT HV Monitor | 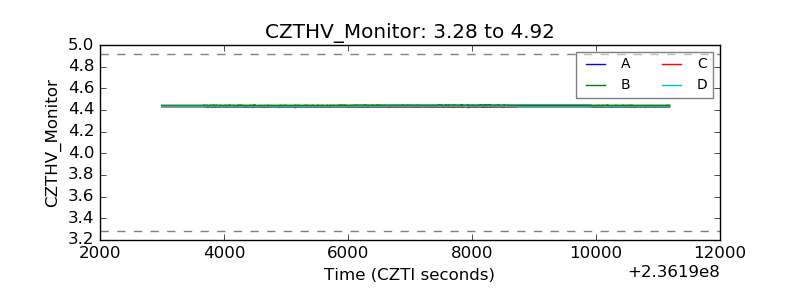 |
| D_VDD | 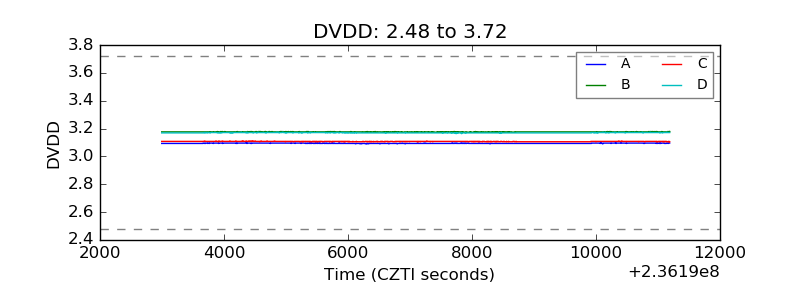 |
| Temperature 1 | 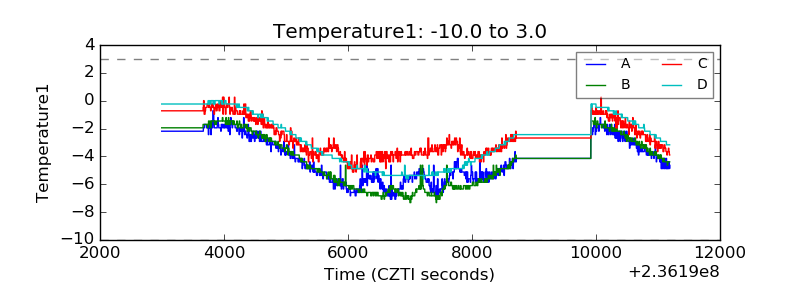 |
| Veto HV Monitor | 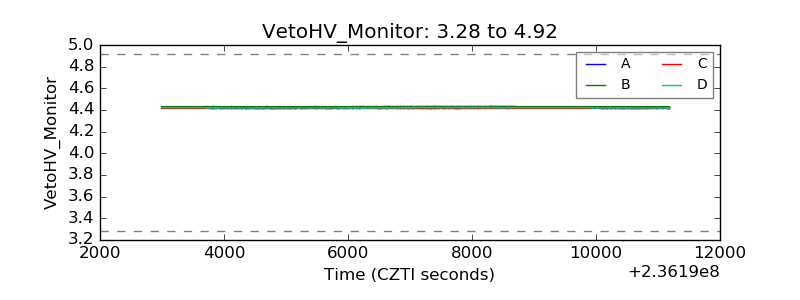 |
| Veto LLD | 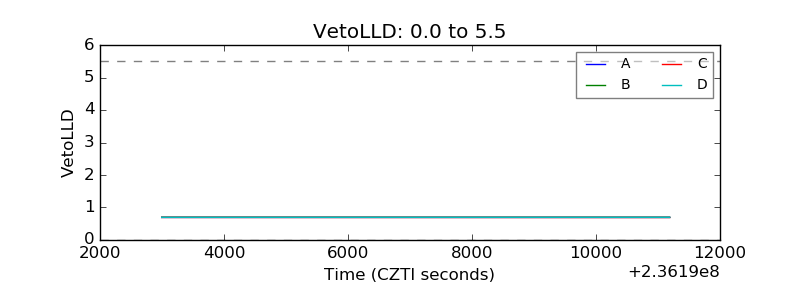 |
| Alpha Counter | 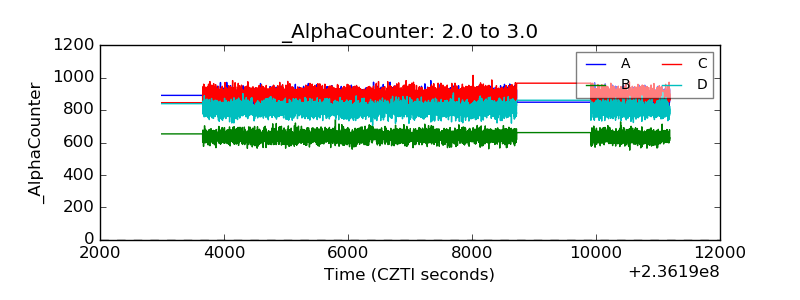 |
| _CPM_Rate | 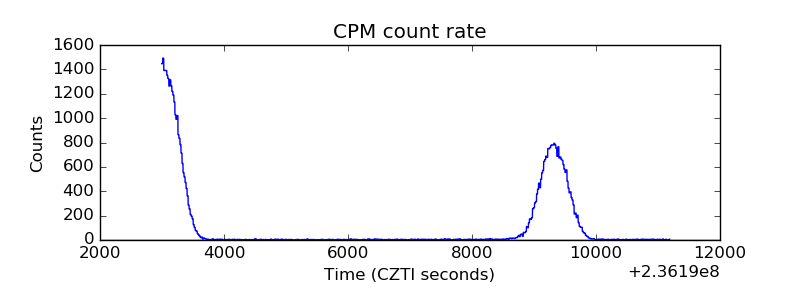 |
| CZT Counter | 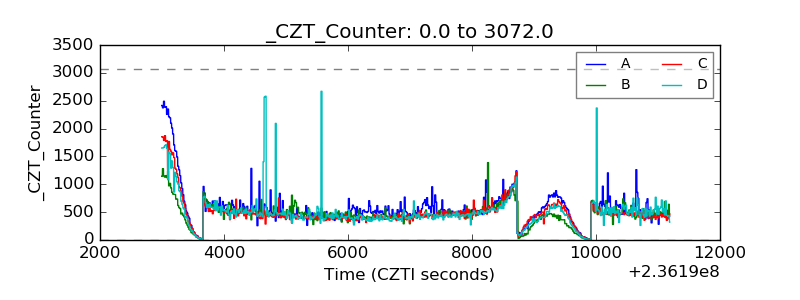 |
| +2.5 Volts monitor |  |
| +5 Volts monitor |  |
| _ROLL_ROT | 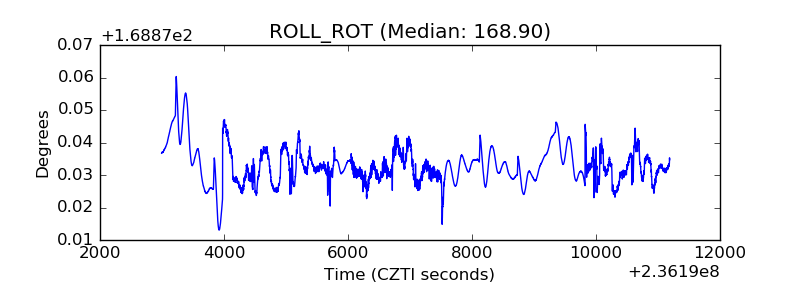 |
| _Roll_DEC | 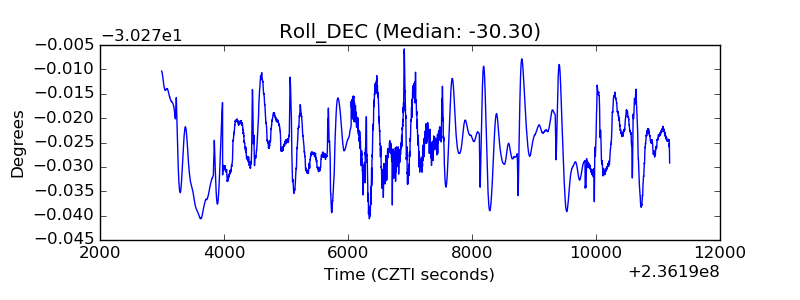 |
| _Roll_RA | 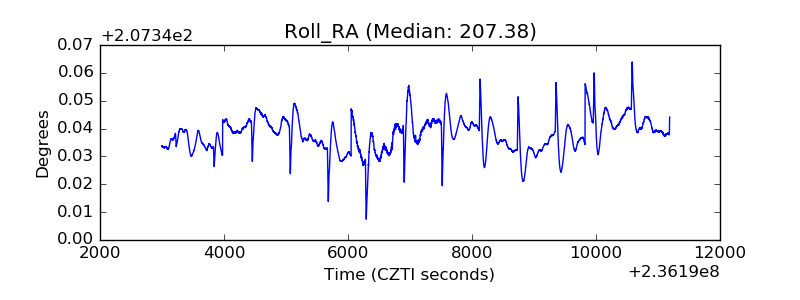 |
| Veto Counter | 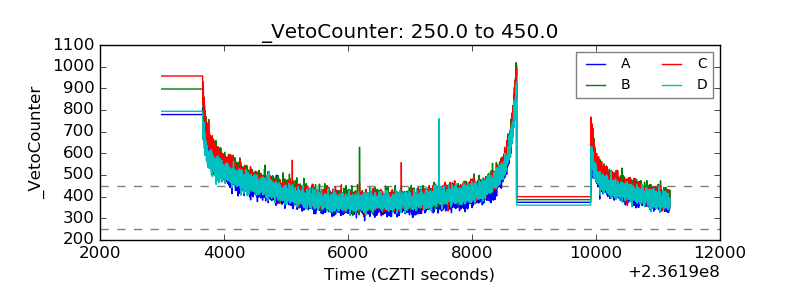 |