| Param | Original file | Final file |
|---|---|---|
| Filename | modeM0/AS1A02_178T01_9000001340_09441cztM0_level2.evt | modeM0/AS1A02_178T01_9000001340_09441cztM0_level2_quad_clean.evt |
| Size (bytes) | 352,405,440 | 72,408,960 |
| Size | 336.1 MB | 69.1 MB |
| Events in quadrant A | 2,835,971 | 457,086 |
| Events in quadrant B | 2,565,029 | 454,232 |
| Events in quadrant C | 2,398,345 | 462,275 |
| Events in quadrant D | 2,510,495 | 447,452 |
| Mode SS | |||
|---|---|---|---|
| Quadrant | BADHDUFLAG | Total packets | Discarded packets |
| A | 0 | 160 | 34 |
| B | 0 | 158 | 64 |
| C | 0 | 160 | 38 |
| D | 0 | 160 | 56 |
| Mode M0 | |||
|---|---|---|---|
| Quadrant | BADHDUFLAG | Total packets | Discarded packets |
| A | 0 | 17474 | 5827 |
| B | 0 | 16539 | 5403 |
| C | 0 | 15959 | 4953 |
| D | 0 | 16898 | 5592 |
| Mode M9 | |||
|---|---|---|---|
| Quadrant | BADHDUFLAG | Total packets | Discarded packets |
| A | 0 | 9 | 3 |
| B | 0 | 9 | 2 |
| C | 0 | 9 | 2 |
| D | 0 | 9 | 4 |
| Quadrant | Total seconds | Saturated seconds | Saturation percentage |
|---|---|---|---|
| A | 5184 | 39 | 0.752315% |
| B | 5263 | 36 | 0.684021% |
| C | 5369 | 6 | 0.111753% |
| D | 5278 | 15 | 0.284199% |
Noise dominated data is calculated using 1-second bins in cleaned event files. If a bin has >2000 counts, and if more than 50% of those come from <1% of pixels, then it is considered to be noise-dominated and hence unusable.
| Quadrant | # 1 sec bins | Bins with >0 counts | Bins with >2000 counts | High rate bins dominated by noise | Noise dominated (total time) | Noise dominated (detector-on time) | Marked lightcurve |
|---|---|---|---|---|---|---|---|
| A | 8680 | 6387 | 3 | 3 | 0.03% | 0.05% | 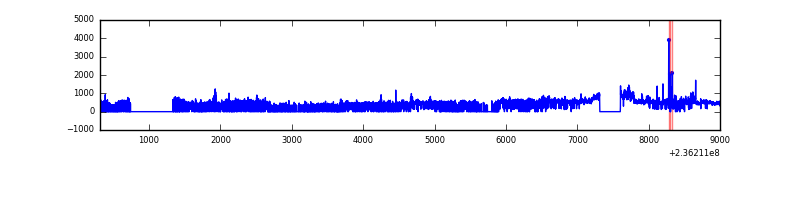 |
| B | 8682 | 6429 | 1 | 1 | 0.01% | 0.02% | 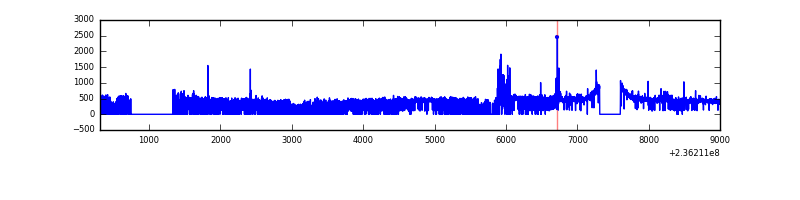 |
| C | 8682 | 6571 | 0 | 0 | 0.00% | 0.00% | 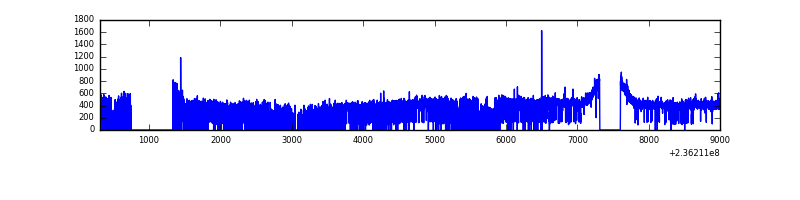 |
| D | 8680 | 6460 | 7 | 7 | 0.08% | 0.11% | 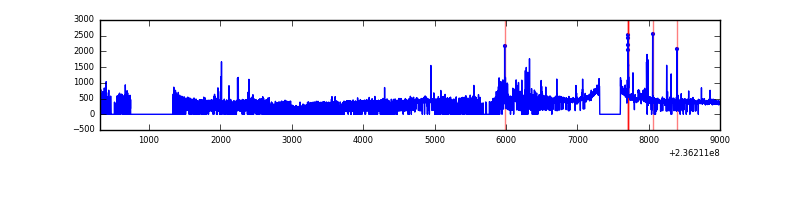 |
Top three noisy pixels from each quadrant. If the there are fewer than three noisy pixels in the level2.evt file, extra rows are filled as -1
| Pixel properties | Quadrant properties | ||||||
|---|---|---|---|---|---|---|---|
| Quadrant | DetID | PixID | Counts | Sigma | Mean | Median | Sigma |
| A | 8 | 5 | 324257 | 2564.35 | 614 | 600 | 126.2 |
| A | 1 | 162 | 48924 | 382.87 | 614 | 600 | 126.2 |
| A | 4 | 2 | 28154 | 218.31 | 614 | 600 | 126.2 |
| B | 0 | 229 | 86011 | 702.58 | 620 | 604 | 121.6 |
| B | 0 | 219 | 14531 | 114.57 | 620 | 604 | 121.6 |
| B | 12 | 111 | 12900 | 101.15 | 620 | 604 | 121.6 |
| C | 9 | 68 | 16629 | 111.56 | 608 | 612 | 143.6 |
| C | 14 | 234 | 5220 | 32.1 | 608 | 612 | 143.6 |
| C | 13 | 61 | 4686 | 28.38 | 608 | 612 | 143.6 |
| D | 1 | 52 | 67664 | 422.68 | 596 | 580 | 158.7 |
| D | 12 | 233 | 57363 | 357.78 | 596 | 580 | 158.7 |
| D | 8 | 195 | 42718 | 265.5 | 596 | 580 | 158.7 |
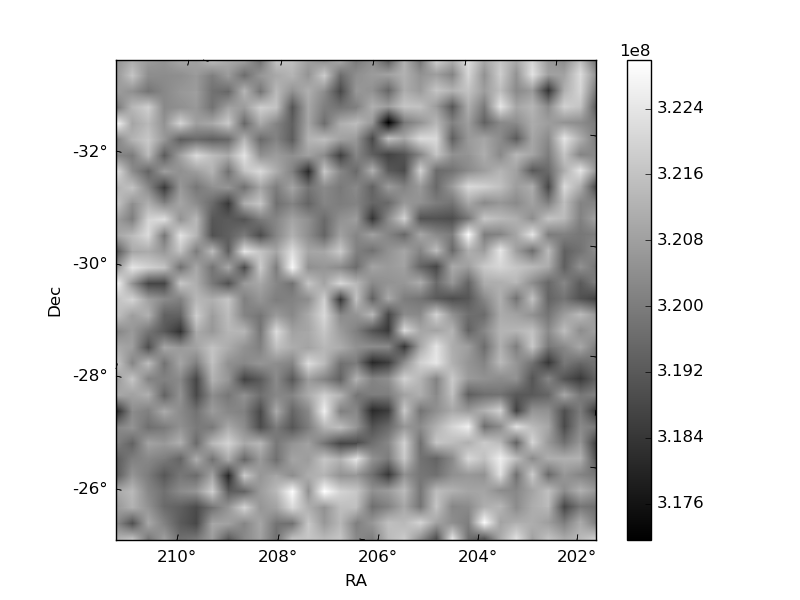
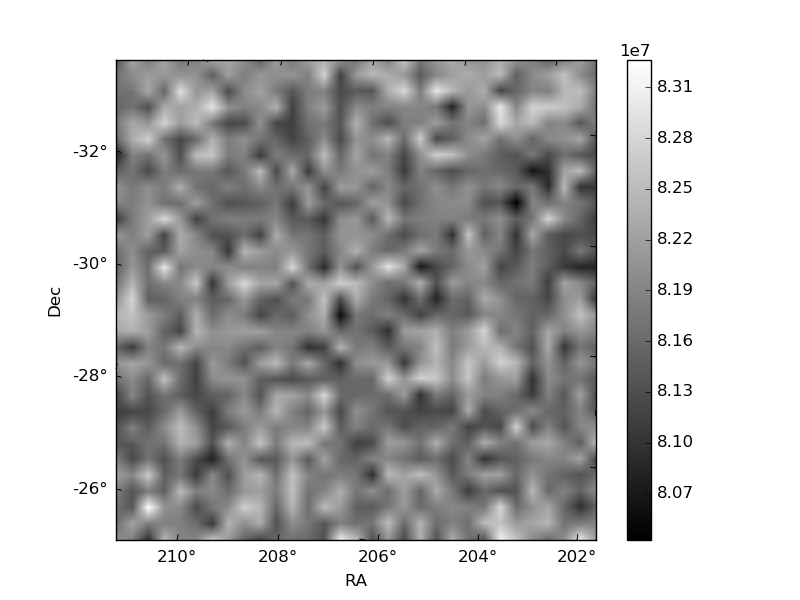
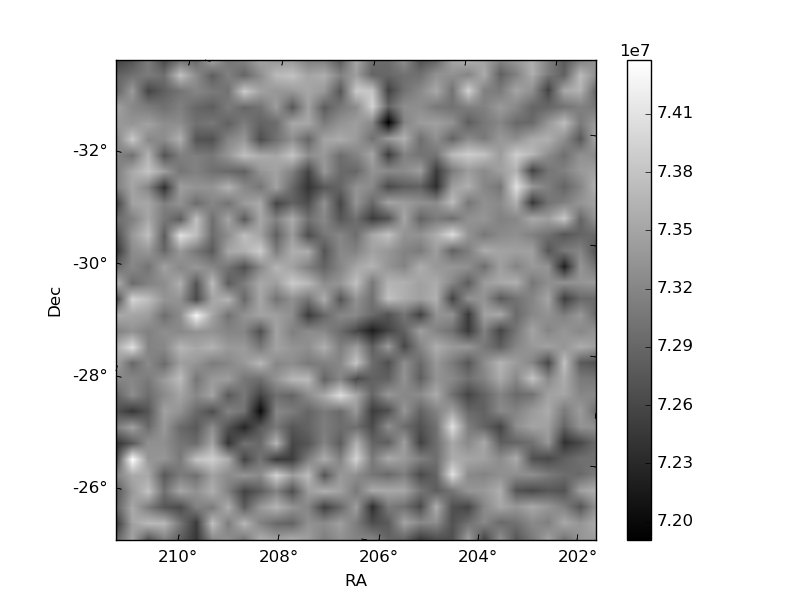
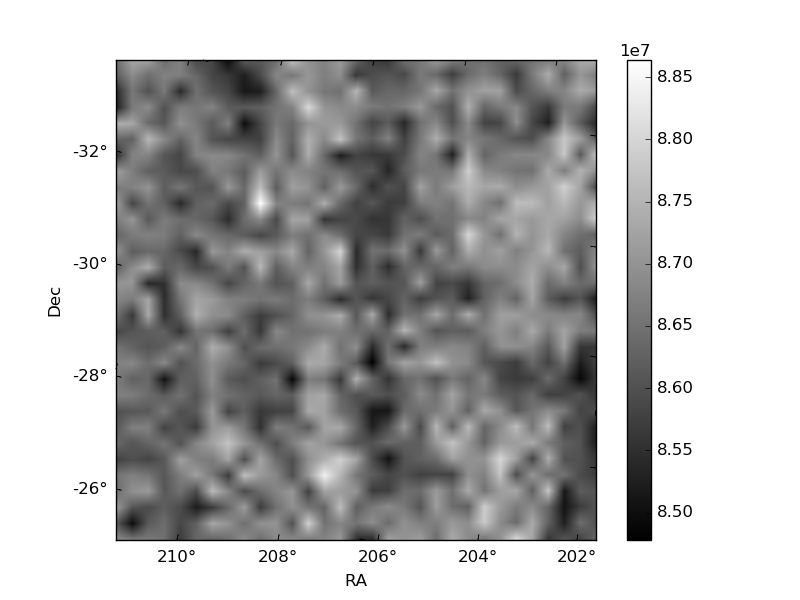
Histogram calculated using DETX and DETY for each event in the final _common_clean file
| Quadrant A | 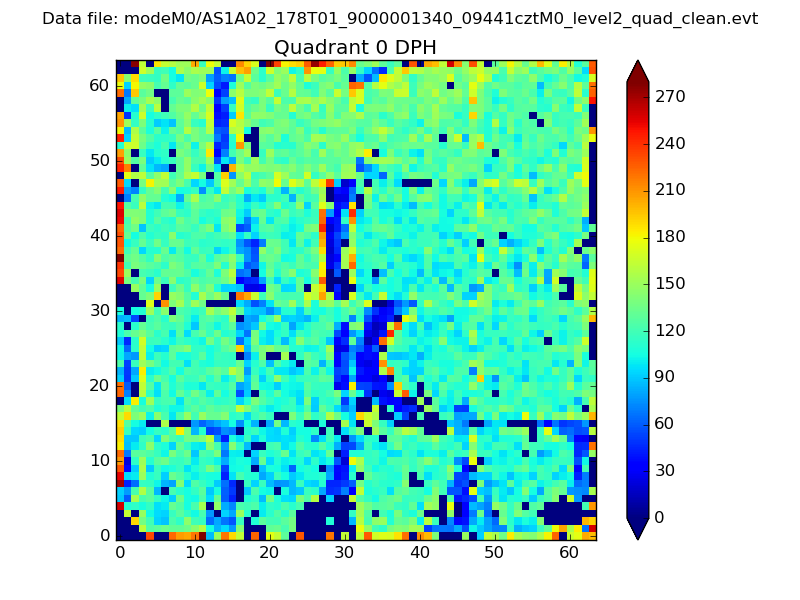 |
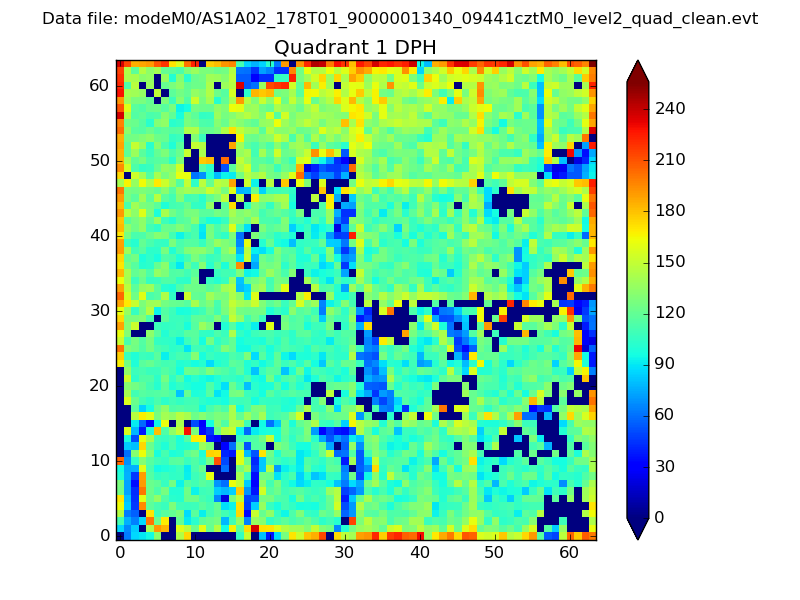 |
Quadrant B |
|---|---|---|---|
| Quadrant D | 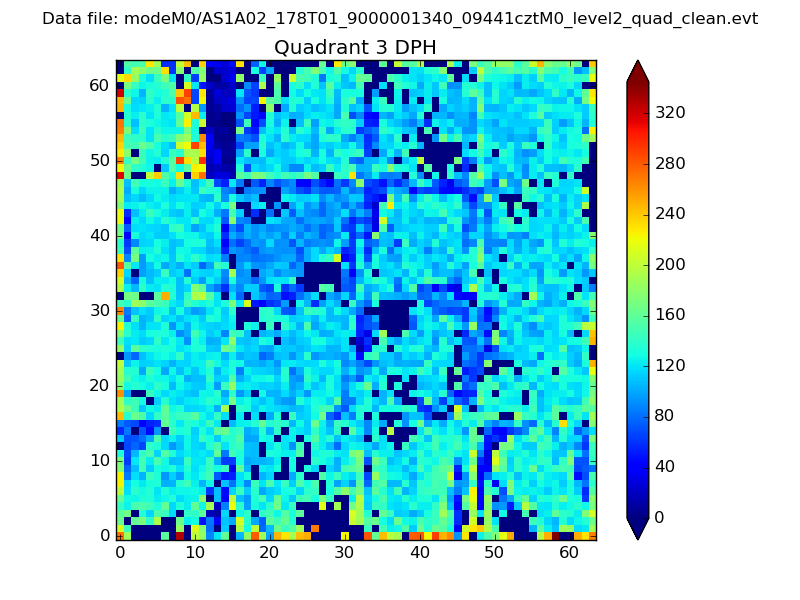 |
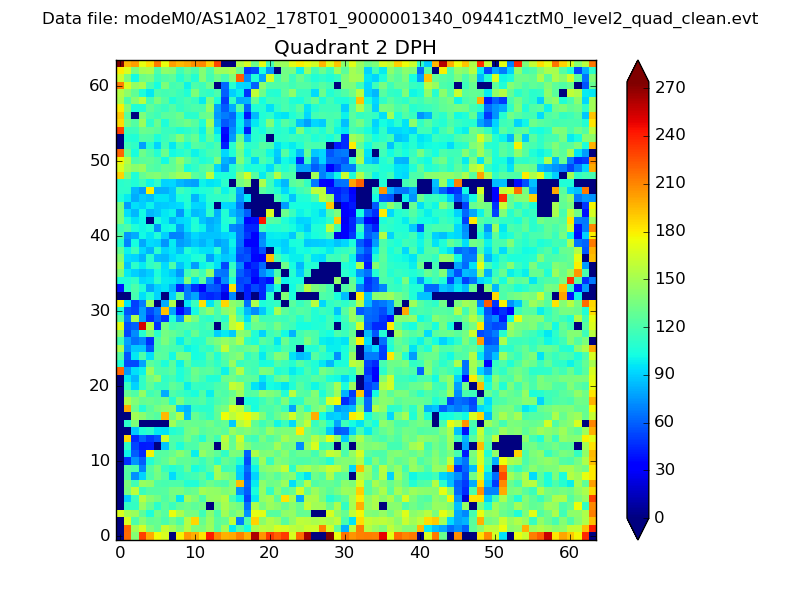 |
Quadrant C |
| Plot type | Count rate plots | Images |
|---|---|---|
| Comparison with Poisson distribution Blue bars denote a histogram of data divided into 1 sec bins. Red curve is a Poisson curve with rate = median count rate of data. |
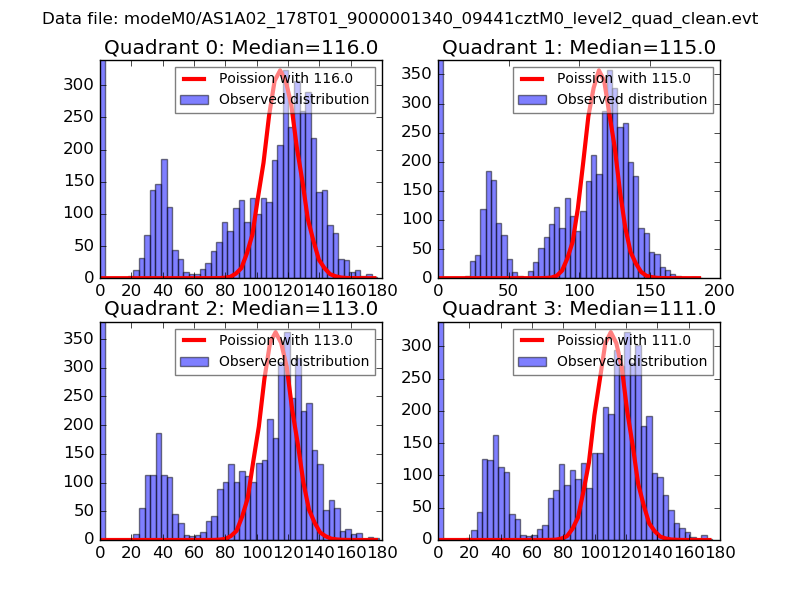 |
 |
| Quadrant-wise count rates Data is divided into 100 sec bins |
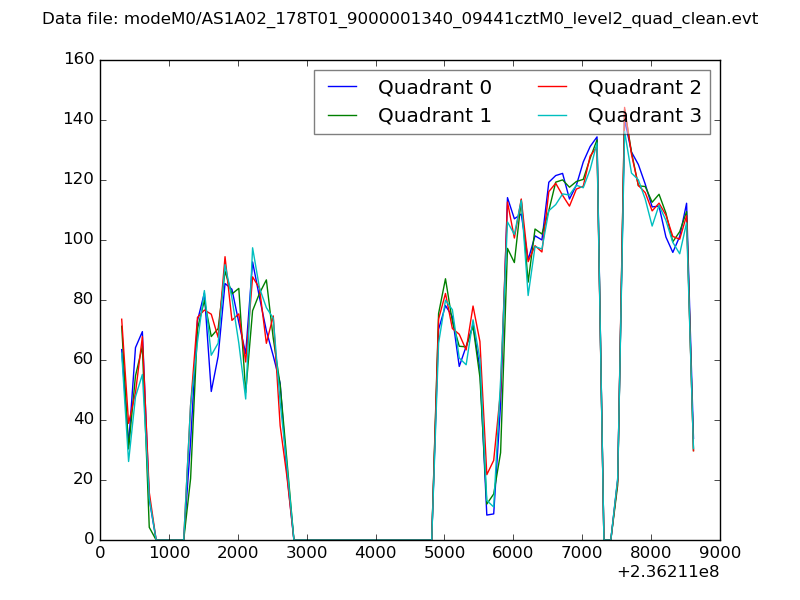 |
|
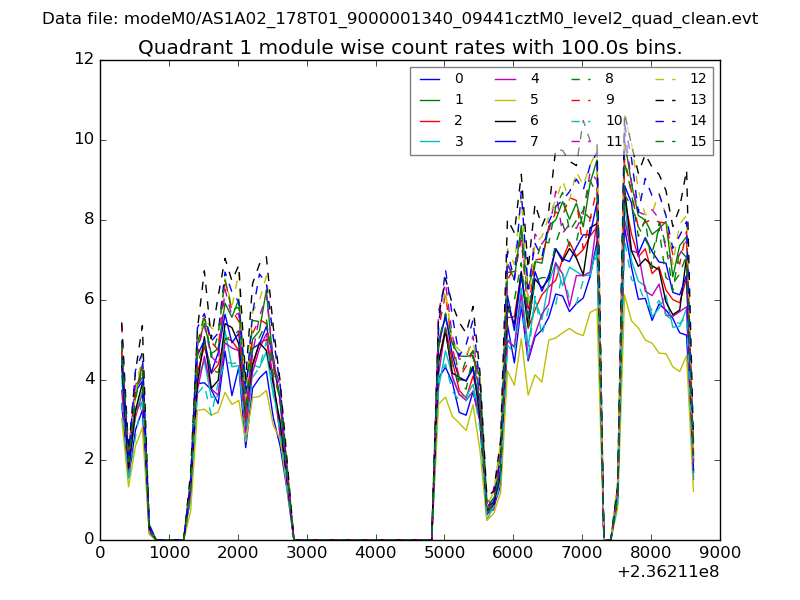
| Module-wise count rates for Quadrant A Data is divided into 100 sec bins |
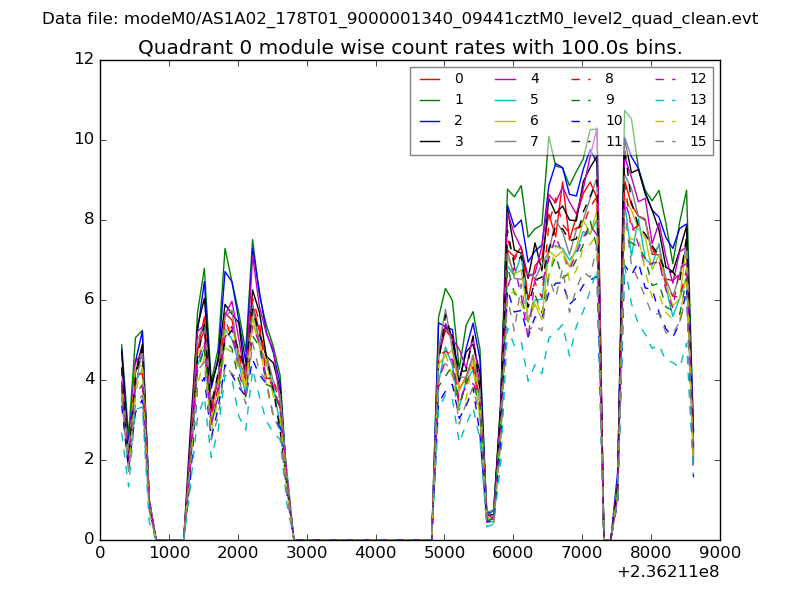 |
 |
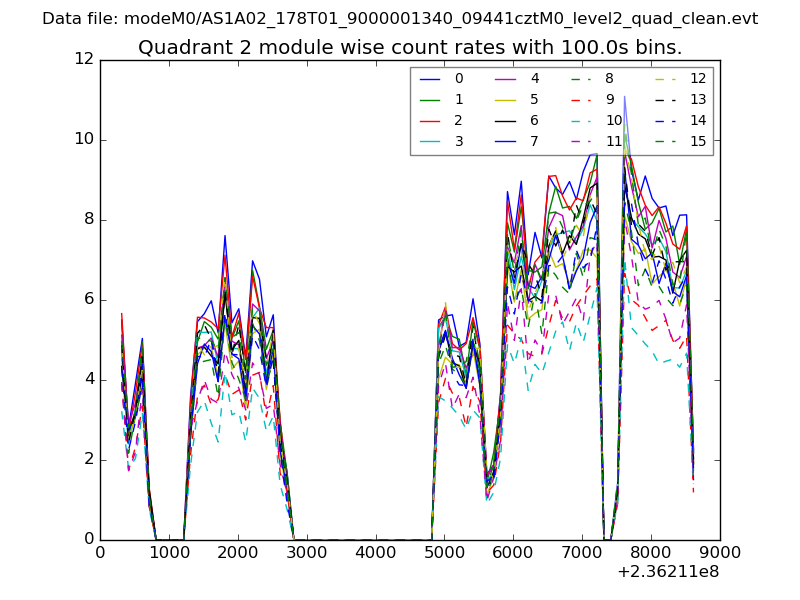
| Module-wise count rates for Quadrant B Data is divided into 100 sec bins |
 |
 |
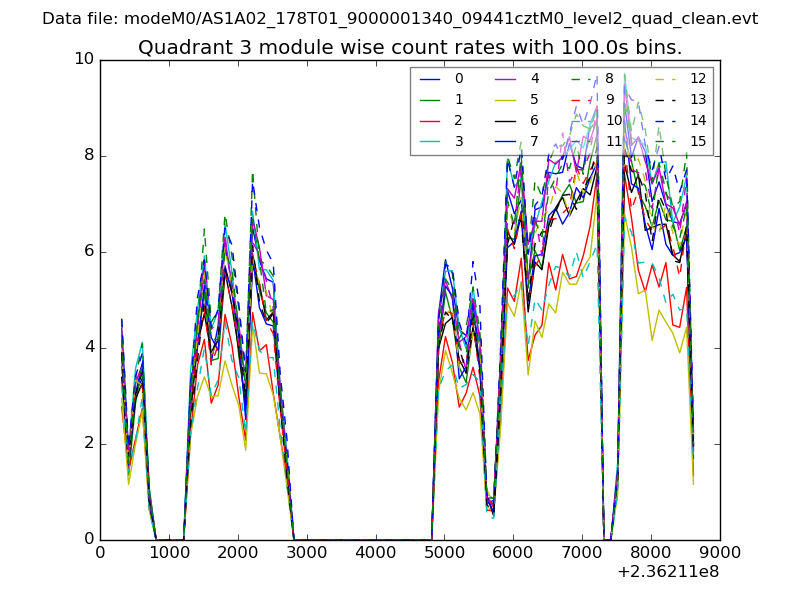
| Module-wise count rates for Quadrant C Data is divided into 100 sec bins |
 |
 |
| Module-wise count rates for Quadrant D Data is divided into 100 sec bins |
 |
 |
| Parameter | Plot |
|---|---|
| CZT HV Monitor | 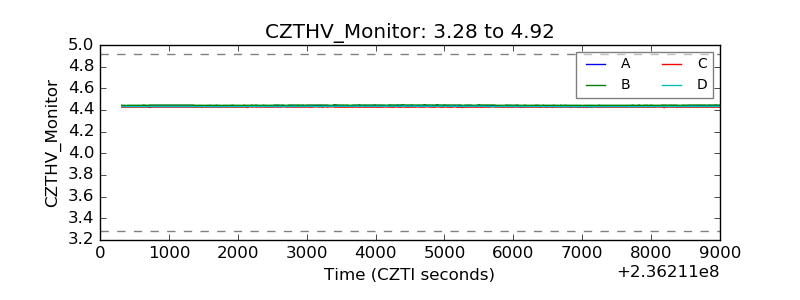 |
| D_VDD | 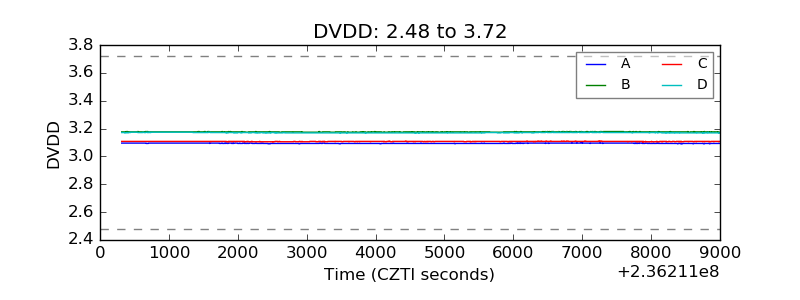 |
| Temperature 1 | 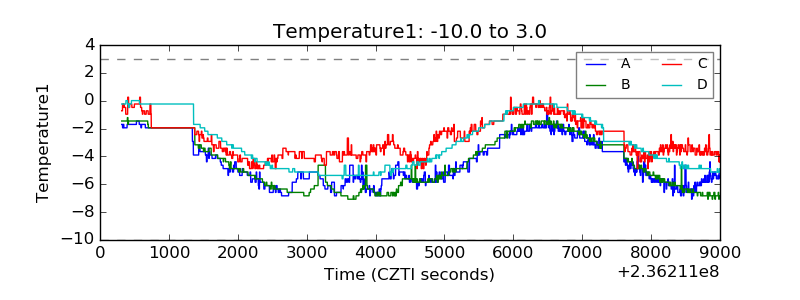 |
| Veto HV Monitor | 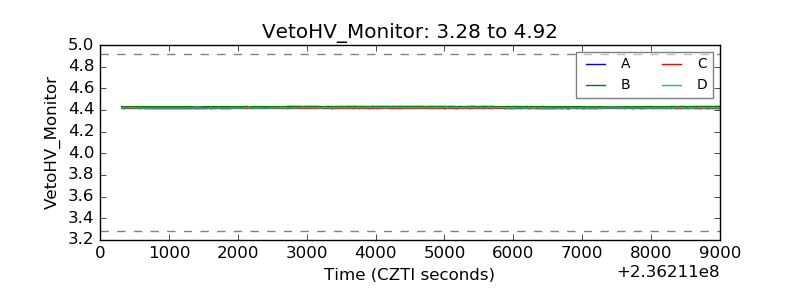 |
| Veto LLD | 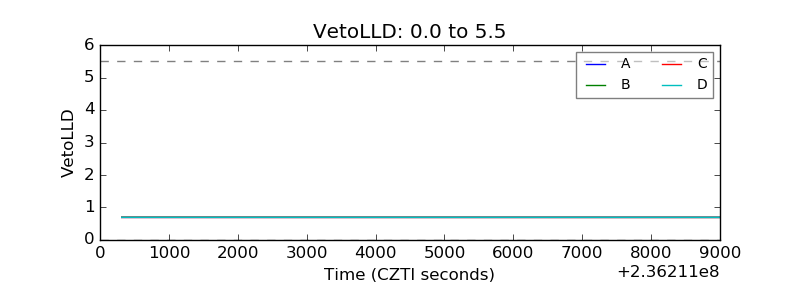 |
| Alpha Counter | 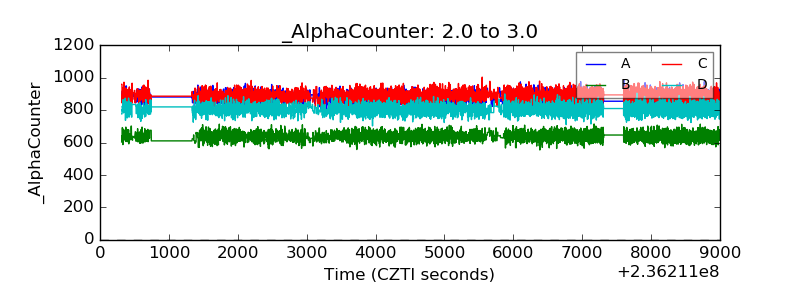 |
| _CPM_Rate | 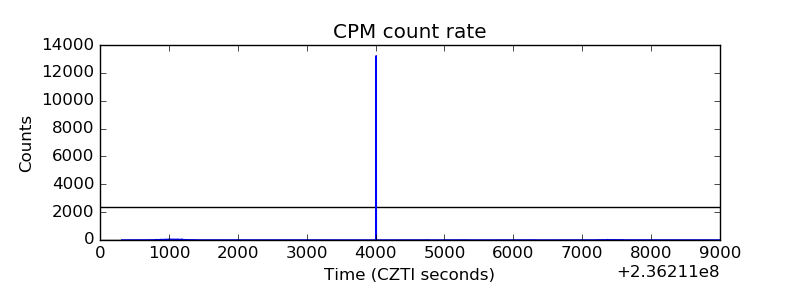 |
| CZT Counter | 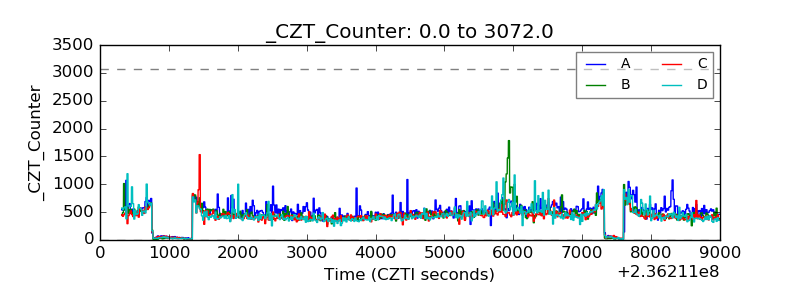 |
| +2.5 Volts monitor |  |
| +5 Volts monitor | 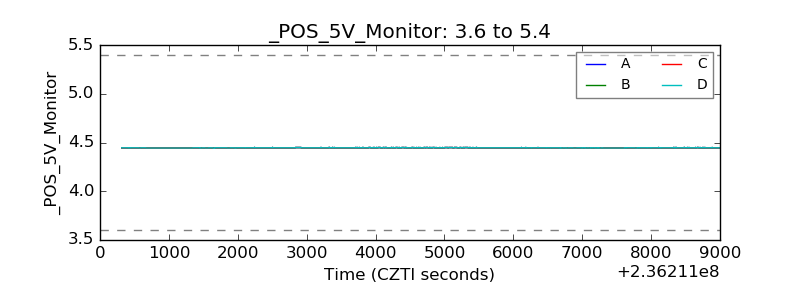 |
| _ROLL_ROT |  |
| _Roll_DEC | 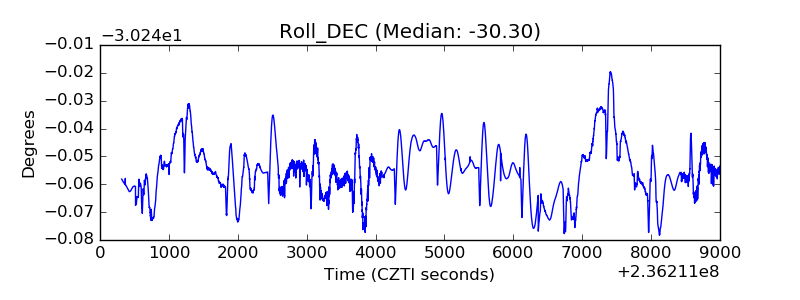 |
| _Roll_RA | 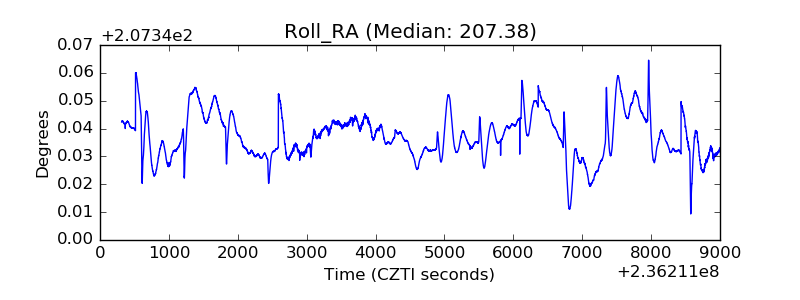 |
| Veto Counter | 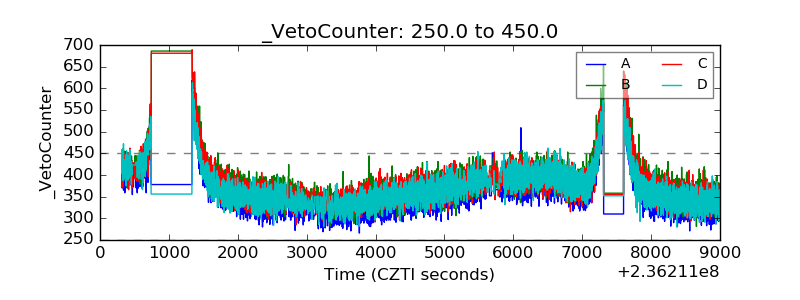 |