| Param | Original file | Final file |
|---|---|---|
| Filename | modeM0/AS1A02_178T01_9000001340_09442cztM0_level2.evt | modeM0/AS1A02_178T01_9000001340_09442cztM0_level2_quad_clean.evt |
| Size (bytes) | 1,068,782,400 | 198,192,960 |
| Size | 1019.3 MB | 189.0 MB |
| Events in quadrant A | 9,289,888 | 1,379,570 |
| Events in quadrant B | 8,674,588 | 1,380,993 |
| Events in quadrant C | 4,735,426 | 774,424 |
| Events in quadrant D | 8,554,299 | 1,333,416 |
| Mode SS | |||
|---|---|---|---|
| Quadrant | BADHDUFLAG | Total packets | Discarded packets |
| A | 0 | 390 | 18 |
| B | 0 | 390 | 28 |
| C | 0 | 390 | 20 |
| D | 0 | 390 | 16 |
| Mode M0 | |||
|---|---|---|---|
| Quadrant | BADHDUFLAG | Total packets | Discarded packets |
| A | 0 | 41576 | 2315 |
| B | 0 | 40252 | 2003 |
| C | 0 | 40540 | 18811 |
| D | 0 | 41096 | 2191 |
| Mode M9 | |||
|---|---|---|---|
| Quadrant | BADHDUFLAG | Total packets | Discarded packets |
| A | 0 | 11 | 0 |
| B | 0 | 11 | 0 |
| C | 0 | 11 | 1 |
| D | 0 | 11 | 0 |
| Quadrant | Total seconds | Saturated seconds | Saturation percentage |
|---|---|---|---|
| A | 18228 | 118 | 0.647356% |
| B | 18271 | 118 | 0.645832% |
| C | 10529 | 61 | 0.579352% |
| D | 18236 | 95 | 0.520948% |
Noise dominated data is calculated using 1-second bins in cleaned event files. If a bin has >2000 counts, and if more than 50% of those come from <1% of pixels, then it is considered to be noise-dominated and hence unusable.
| Quadrant | # 1 sec bins | Bins with >0 counts | Bins with >2000 counts | High rate bins dominated by noise | Noise dominated (total time) | Noise dominated (detector-on time) | Marked lightcurve |
|---|---|---|---|---|---|---|---|
| A | 20263 | 18922 | 4 | 4 | 0.02% | 0.02% | 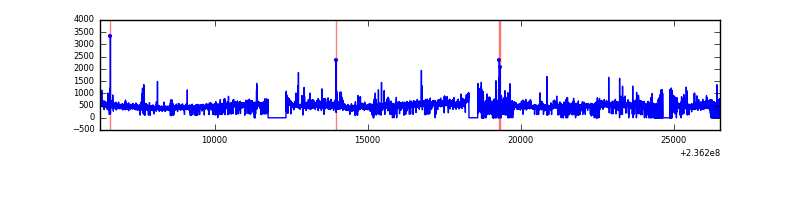 |
| B | 20261 | 18942 | 7 | 7 | 0.03% | 0.04% | 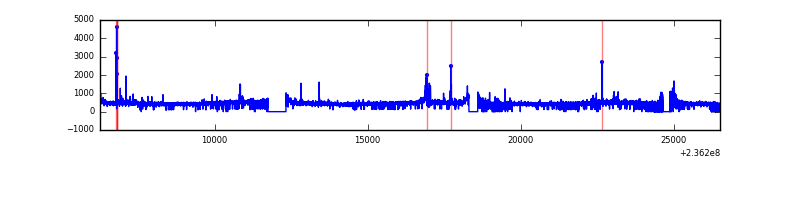 |
| C | 11280 | 10685 | 40 | 40 | 0.35% | 0.37% | 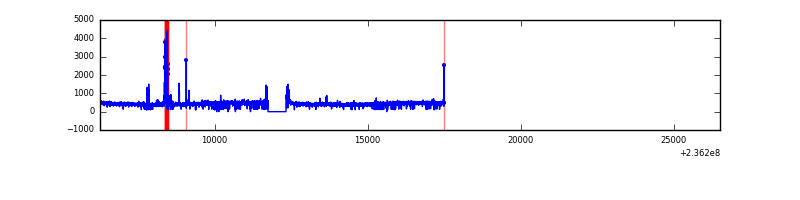 |
| D | 20262 | 18906 | 48 | 48 | 0.24% | 0.25% | 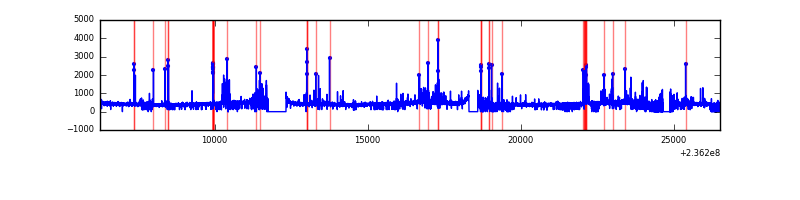 |
Top three noisy pixels from each quadrant. If the there are fewer than three noisy pixels in the level2.evt file, extra rows are filled as -1
| Pixel properties | Quadrant properties | ||||||
|---|---|---|---|---|---|---|---|
| Quadrant | DetID | PixID | Counts | Sigma | Mean | Median | Sigma |
| A | 8 | 5 | 729097 | 1696.09 | 2113 | 2064 | 428.7 |
| A | 1 | 162 | 162341 | 373.91 | 2113 | 2064 | 428.7 |
| A | 14 | 111 | 61485 | 138.62 | 2113 | 2064 | 428.7 |
| B | 0 | 229 | 160684 | 394.15 | 2115 | 2062 | 402.4 |
| B | 0 | 214 | 72929 | 176.09 | 2115 | 2062 | 402.4 |
| B | 0 | 219 | 67240 | 161.96 | 2115 | 2062 | 402.4 |
| C | 14 | 234 | 179649 | 661.56 | 1156 | 1161 | 269.8 |
| C | 9 | 68 | 44309 | 159.93 | 1156 | 1161 | 269.8 |
| C | 13 | 61 | 8866 | 28.56 | 1156 | 1161 | 269.8 |
| D | 12 | 233 | 322911 | 613.56 | 2028 | 1970 | 523.1 |
| D | 7 | 71 | 147086 | 277.43 | 2028 | 1970 | 523.1 |
| D | 1 | 52 | 135262 | 254.82 | 2028 | 1970 | 523.1 |
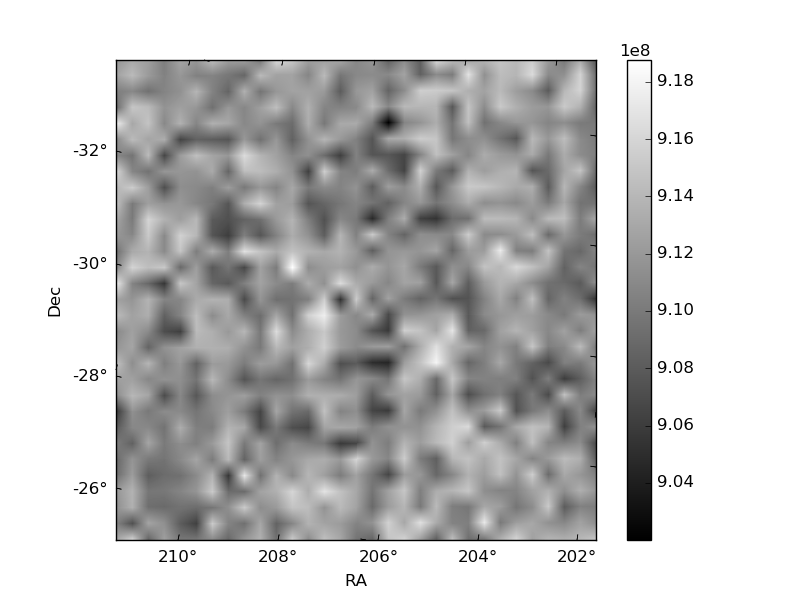
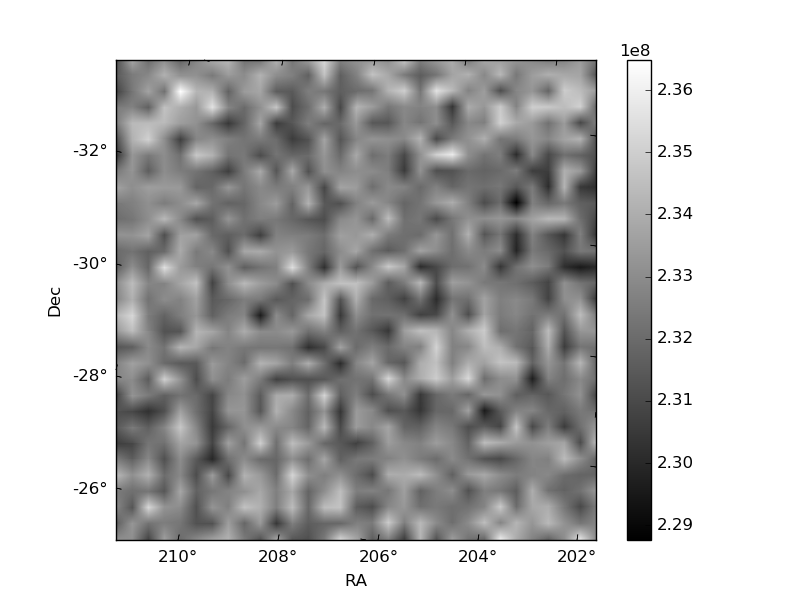
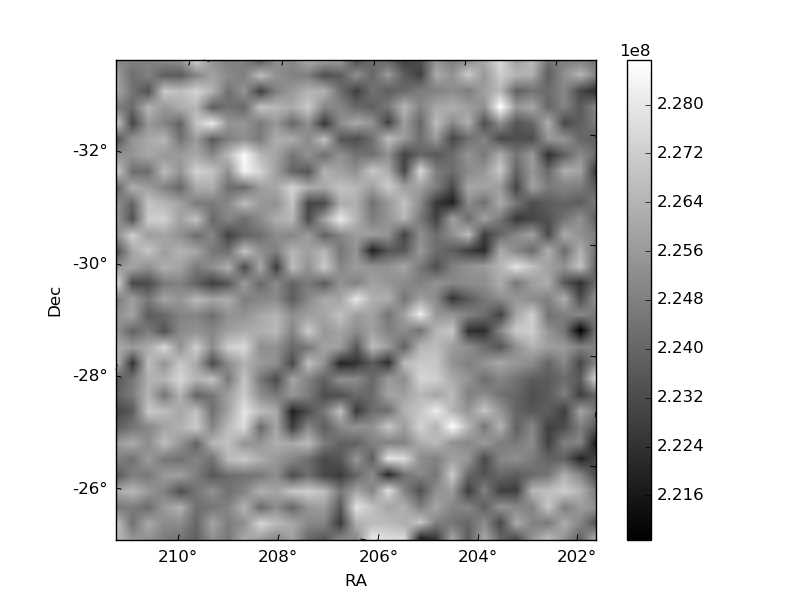
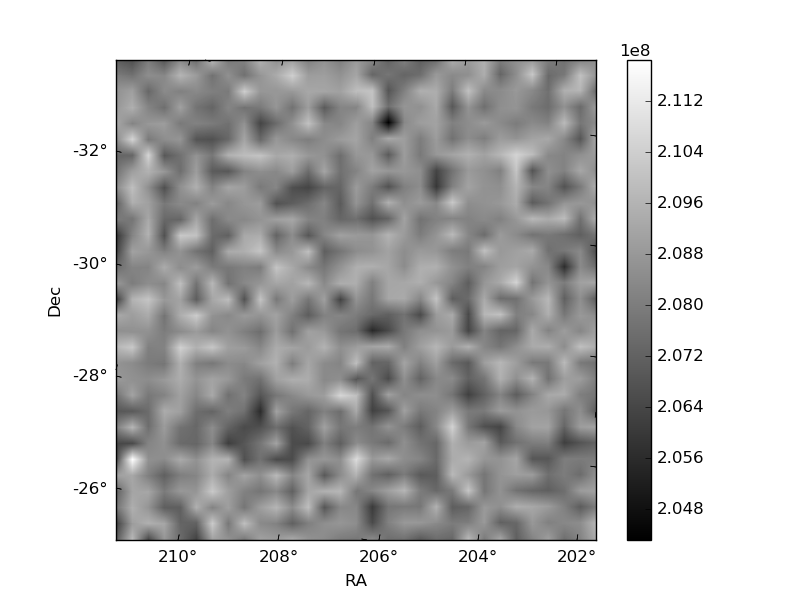
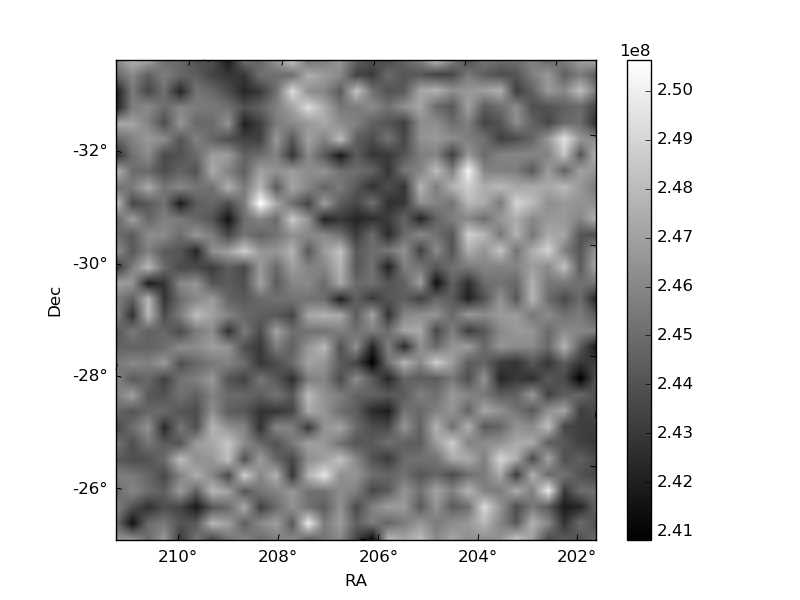
Histogram calculated using DETX and DETY for each event in the final _common_clean file
| Quadrant A | 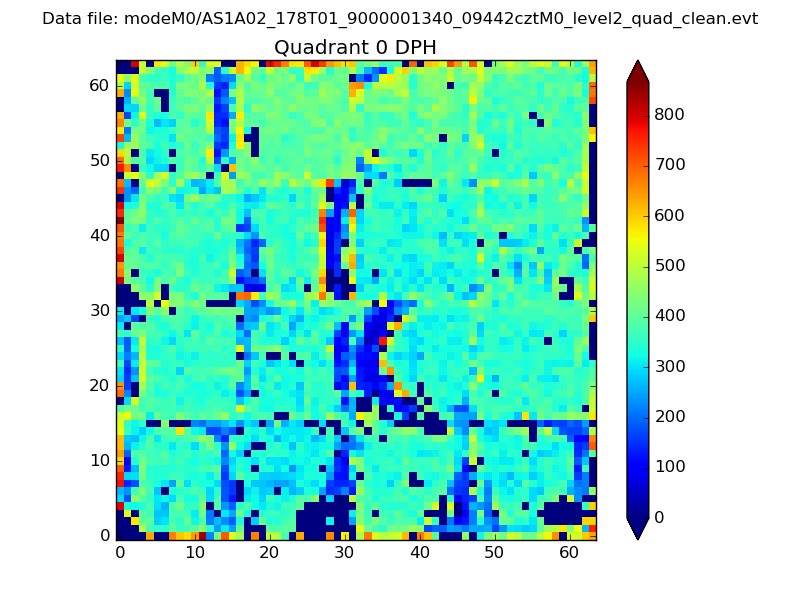 |
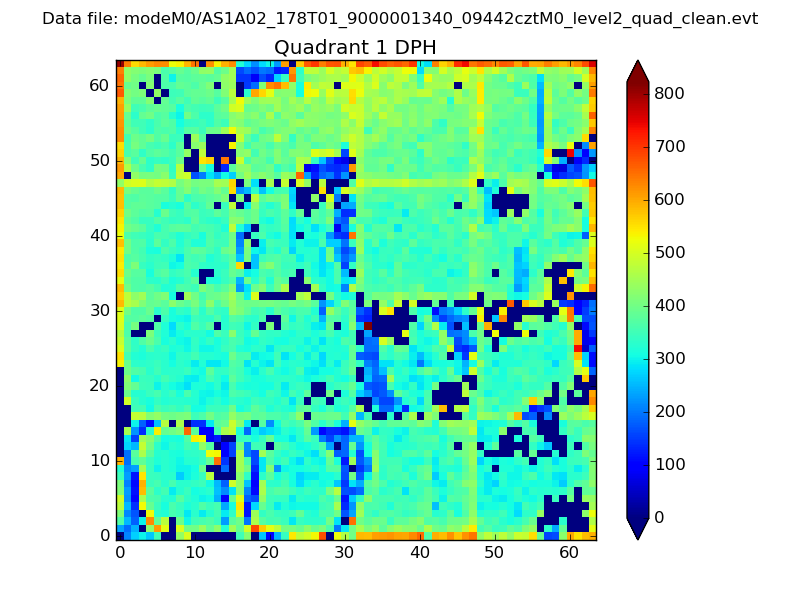 |
Quadrant B |
|---|---|---|---|
| Quadrant D | 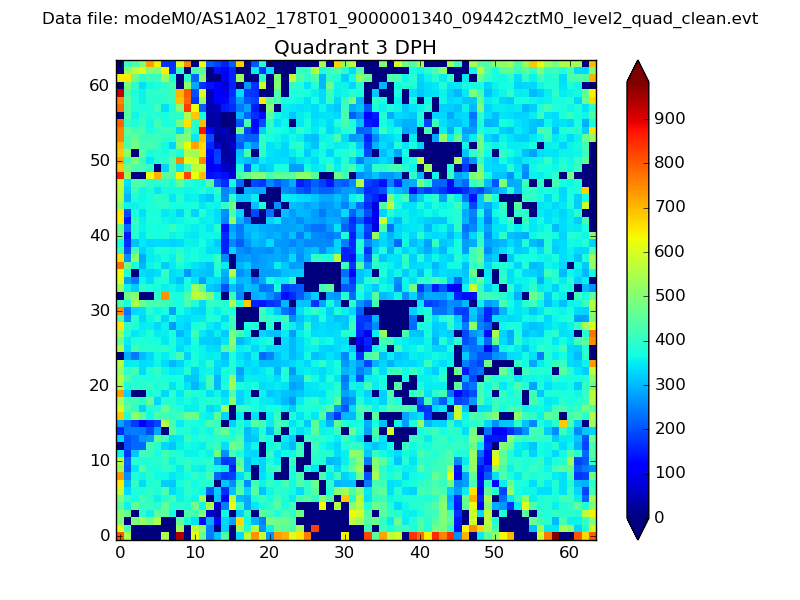 |
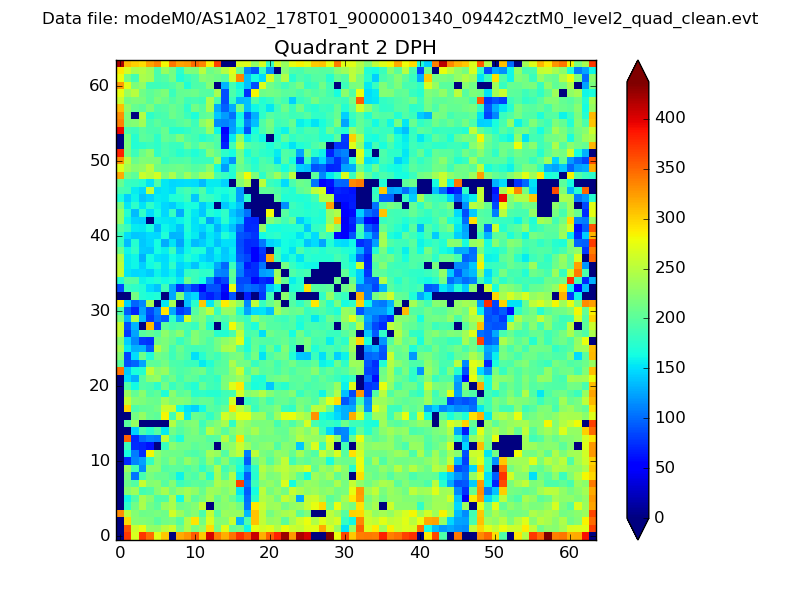 |
Quadrant C |
| Plot type | Count rate plots | Images |
|---|---|---|
| Comparison with Poisson distribution Blue bars denote a histogram of data divided into 1 sec bins. Red curve is a Poisson curve with rate = median count rate of data. |
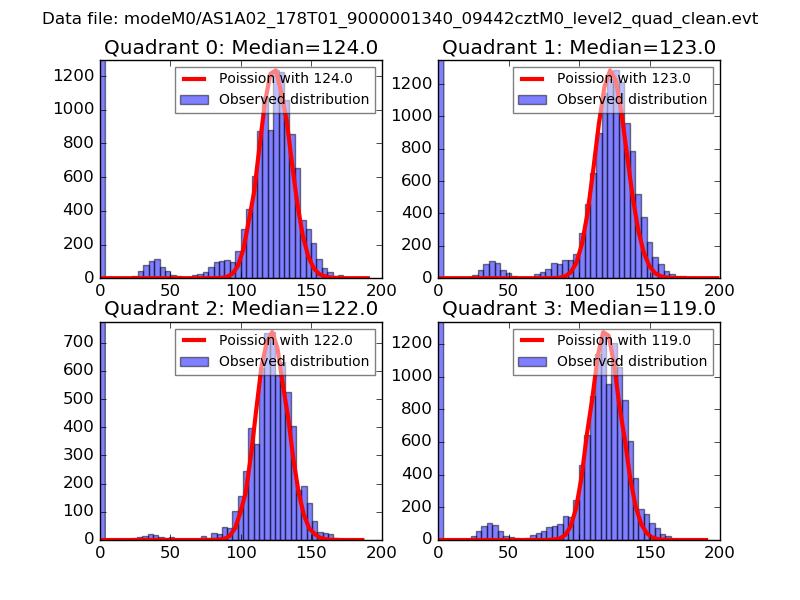 |
 |
| Quadrant-wise count rates Data is divided into 100 sec bins |
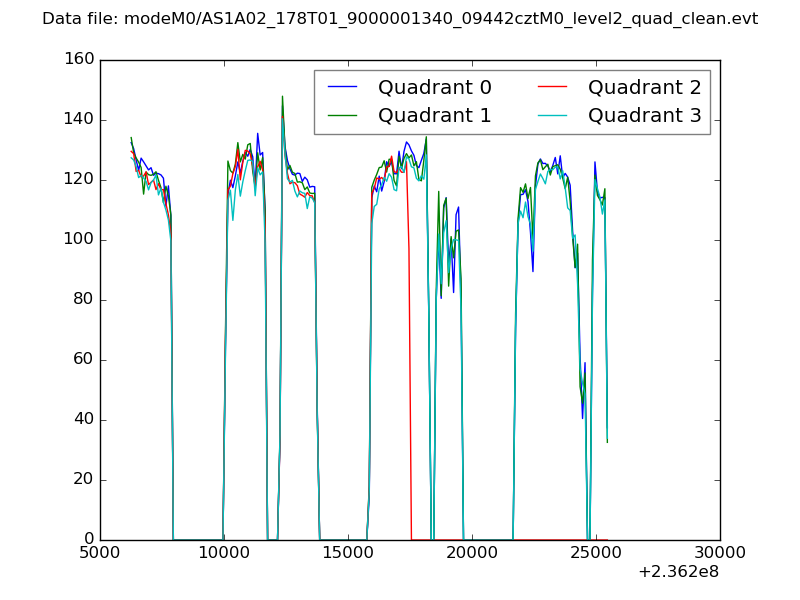 |
|
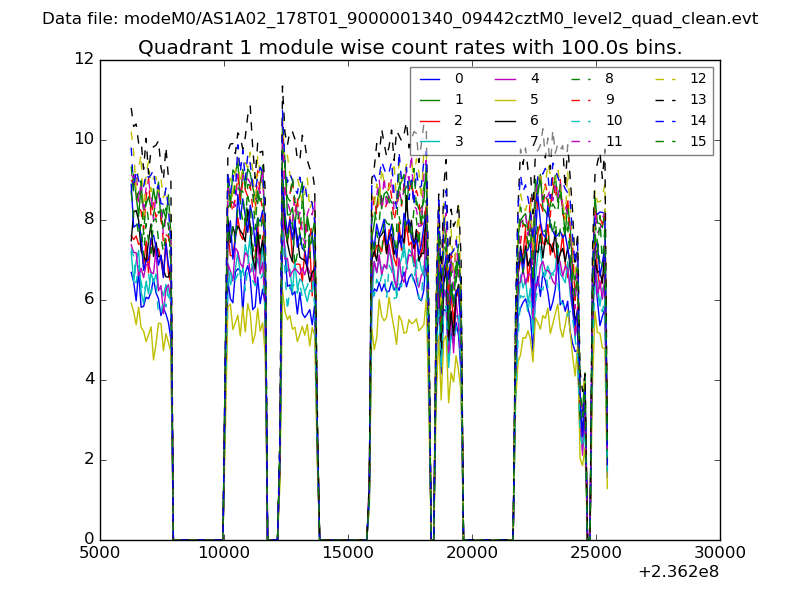
| Module-wise count rates for Quadrant A Data is divided into 100 sec bins |
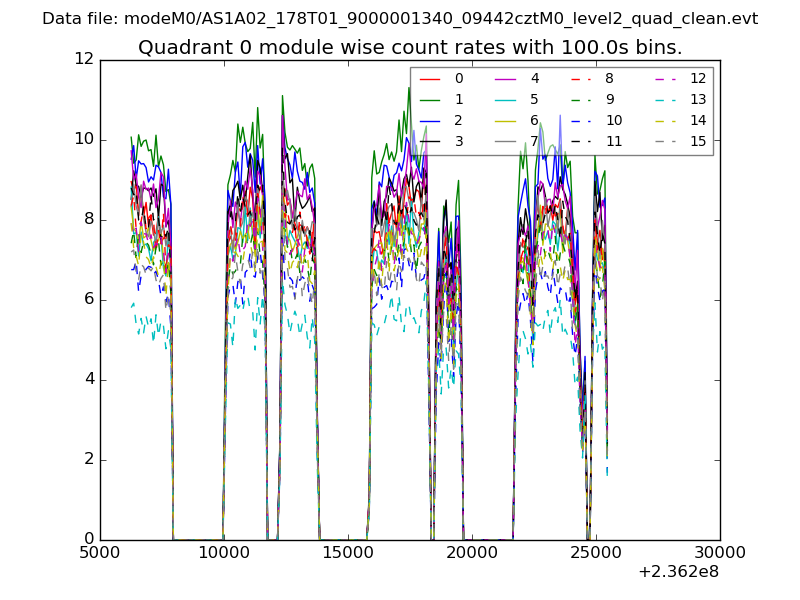 |
 |
| Module-wise count rates for Quadrant B Data is divided into 100 sec bins |
 |
 |
| Module-wise count rates for Quadrant C Data is divided into 100 sec bins |
 |
 |
| Module-wise count rates for Quadrant D Data is divided into 100 sec bins |
 |
 |
| Parameter | Plot |
|---|---|
| CZT HV Monitor | 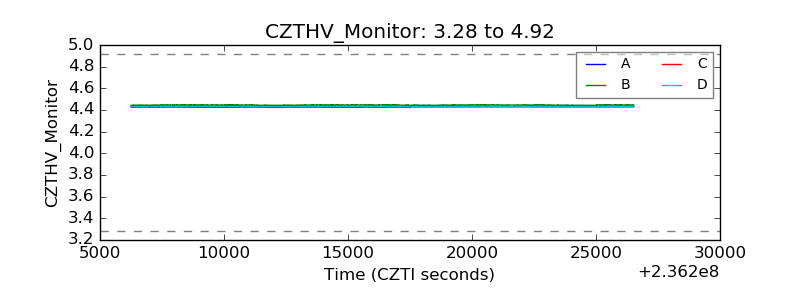 |
| D_VDD | 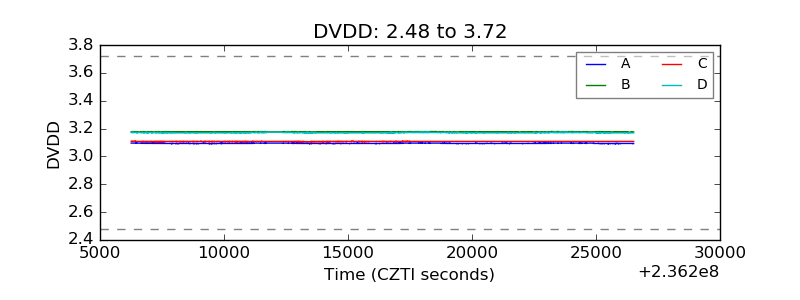 |
| Temperature 1 | 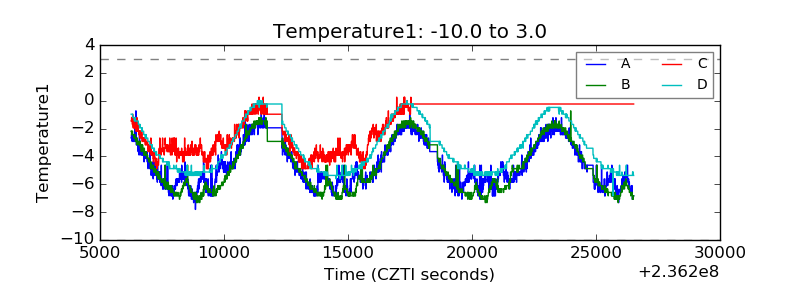 |
| Veto HV Monitor | 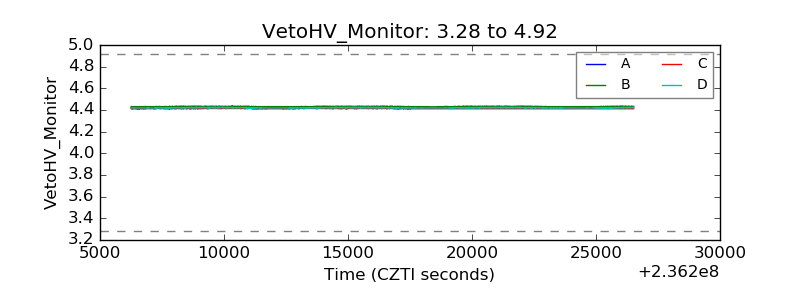 |
| Veto LLD | 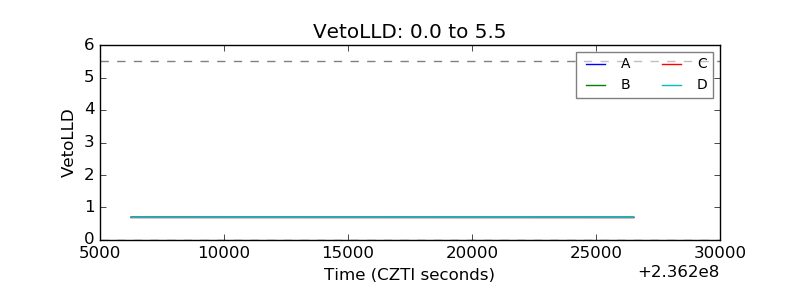 |
| Alpha Counter | 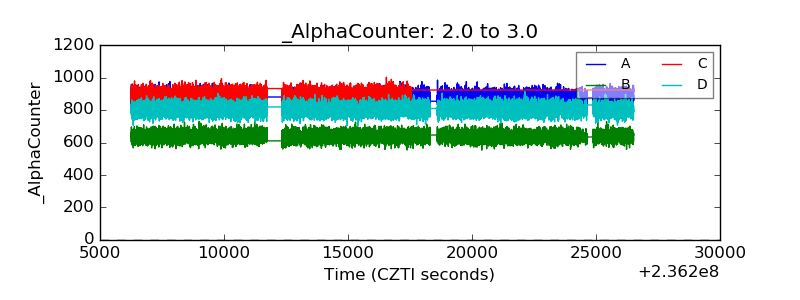 |
| _CPM_Rate | 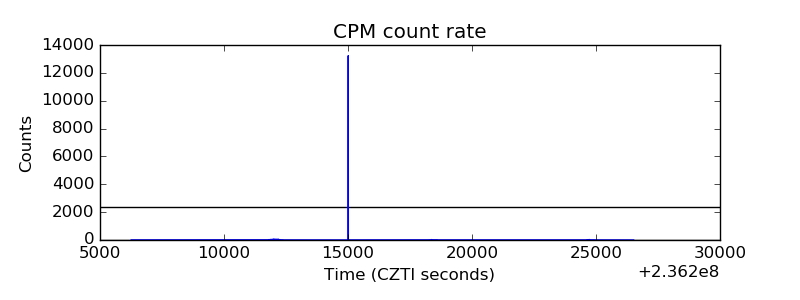 |
| CZT Counter | 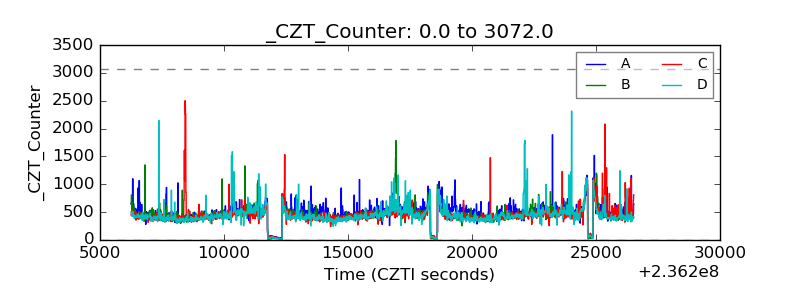 |
| +2.5 Volts monitor |  |
| +5 Volts monitor |  |
| _ROLL_ROT |  |
| _Roll_DEC | 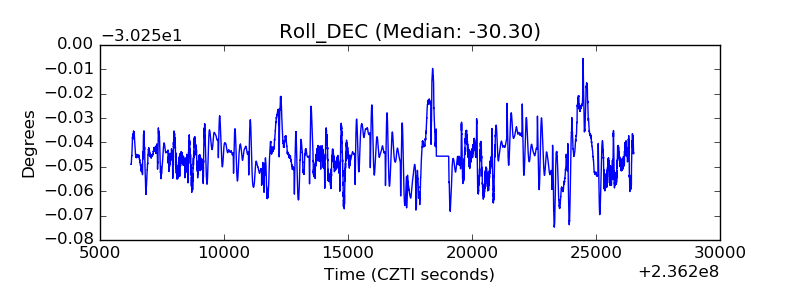 |
| _Roll_RA | 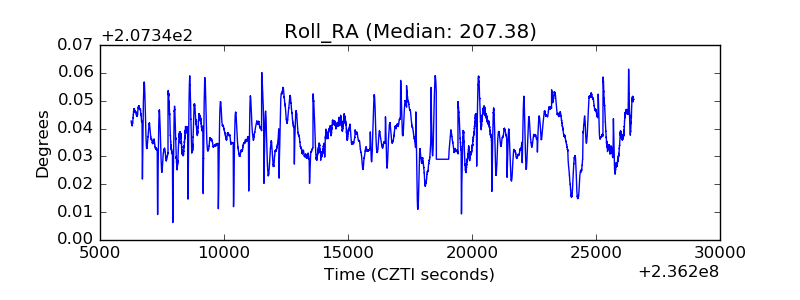 |
| Veto Counter |  |