| Param | Original file | Final file |
|---|---|---|
| Filename | modeM0/AS1A02_178T01_9000001340_09446cztM0_level2.evt | modeM0/AS1A02_178T01_9000001340_09446cztM0_level2_quad_clean.evt |
| Size (bytes) | 685,442,880 | 85,812,480 |
| Size | 653.7 MB | 81.8 MB |
| Events in quadrant A | 4,225,647 | 566,237 |
| Events in quadrant B | 3,785,236 | 570,642 |
| Events in quadrant C | 8,467,491 | 363,765 |
| Events in quadrant D | 3,749,795 | 553,899 |
| Mode SS | |||
|---|---|---|---|
| Quadrant | BADHDUFLAG | Total packets | Discarded packets |
| A | 0 | 220 | 46 |
| B | 0 | 220 | 42 |
| C | 0 | 220 | 54 |
| D | 0 | 220 | 54 |
| Mode M0 | |||
|---|---|---|---|
| Quadrant | BADHDUFLAG | Total packets | Discarded packets |
| A | 0 | 24487 | 6791 |
| B | 0 | 22461 | 5602 |
| C | 0 | 56541 | 26787 |
| D | 0 | 23029 | 5973 |
| Mode M9 | |||
|---|---|---|---|
| Quadrant | BADHDUFLAG | Total packets | Discarded packets |
| A | 0 | 7 | 0 |
| B | 0 | 7 | 0 |
| C | 0 | 7 | 0 |
| D | 0 | 7 | 0 |
| Quadrant | Total seconds | Saturated seconds | Saturation percentage |
|---|---|---|---|
| A | 8042 | 87 | 1.081820% |
| B | 8143 | 73 | 0.896476% |
| C | 6687 | 2110 | 31.553761% |
| D | 8155 | 57 | 0.698958% |
Noise dominated data is calculated using 1-second bins in cleaned event files. If a bin has >2000 counts, and if more than 50% of those come from <1% of pixels, then it is considered to be noise-dominated and hence unusable.
| Quadrant | # 1 sec bins | Bins with >0 counts | Bins with >2000 counts | High rate bins dominated by noise | Noise dominated (total time) | Noise dominated (detector-on time) | Marked lightcurve |
|---|---|---|---|---|---|---|---|
| A | 11240 | 9296 | 6 | 6 | 0.05% | 0.06% | 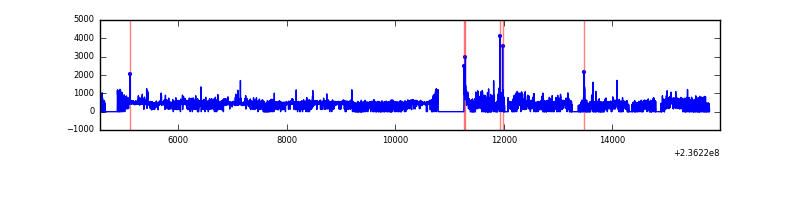 |
| B | 11432 | 9338 | 3 | 3 | 0.03% | 0.03% | 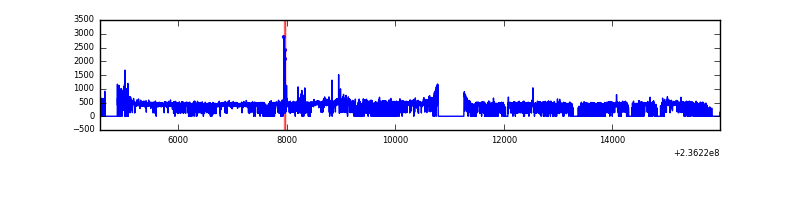 |
| C | 11167 | 7729 | 1557 | 1557 | 13.94% | 20.14% | 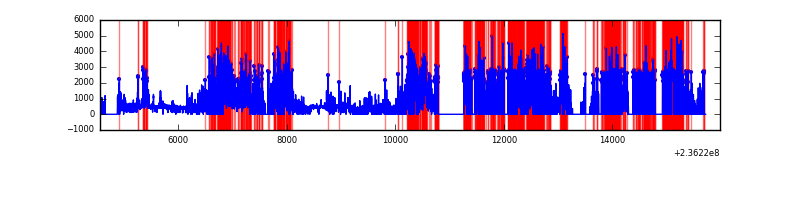 |
| D | 11265 | 9388 | 9 | 9 | 0.08% | 0.10% | 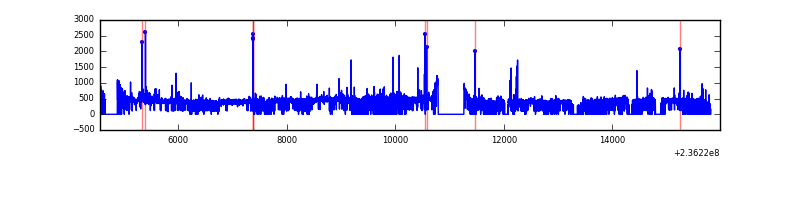 |
Top three noisy pixels from each quadrant. If the there are fewer than three noisy pixels in the level2.evt file, extra rows are filled as -1
| Pixel properties | Quadrant properties | ||||||
|---|---|---|---|---|---|---|---|
| Quadrant | DetID | PixID | Counts | Sigma | Mean | Median | Sigma |
| A | 8 | 5 | 386144 | 2024.41 | 926 | 906 | 190.3 |
| A | 1 | 162 | 112461 | 586.22 | 926 | 906 | 190.3 |
| A | 4 | 2 | 53674 | 277.29 | 926 | 906 | 190.3 |
| B | 0 | 214 | 51547 | 278.48 | 937 | 912 | 181.8 |
| B | 0 | 219 | 36136 | 193.73 | 937 | 912 | 181.8 |
| B | 4 | 80 | 27673 | 147.18 | 937 | 912 | 181.8 |
| C | 4 | 254 | 5934058 | 41846.13 | 606 | 609 | 141.8 |
| C | 9 | 68 | 162943 | 1144.87 | 606 | 609 | 141.8 |
| C | 13 | 61 | 4576 | 27.98 | 606 | 609 | 141.8 |
| D | 8 | 195 | 120356 | 524.7 | 905 | 880 | 227.7 |
| D | 1 | 52 | 114532 | 499.13 | 905 | 880 | 227.7 |
| D | 7 | 71 | 55285 | 238.93 | 905 | 880 | 227.7 |
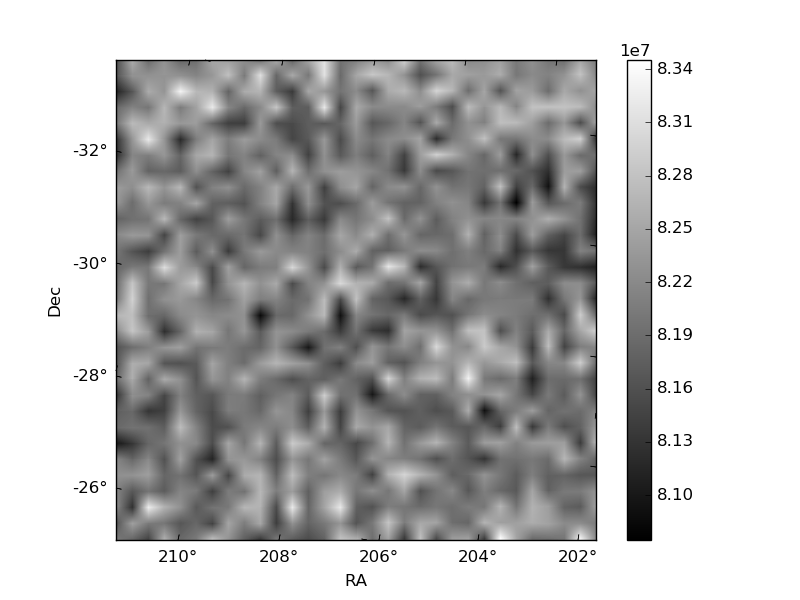
Histogram calculated using DETX and DETY for each event in the final _common_clean file
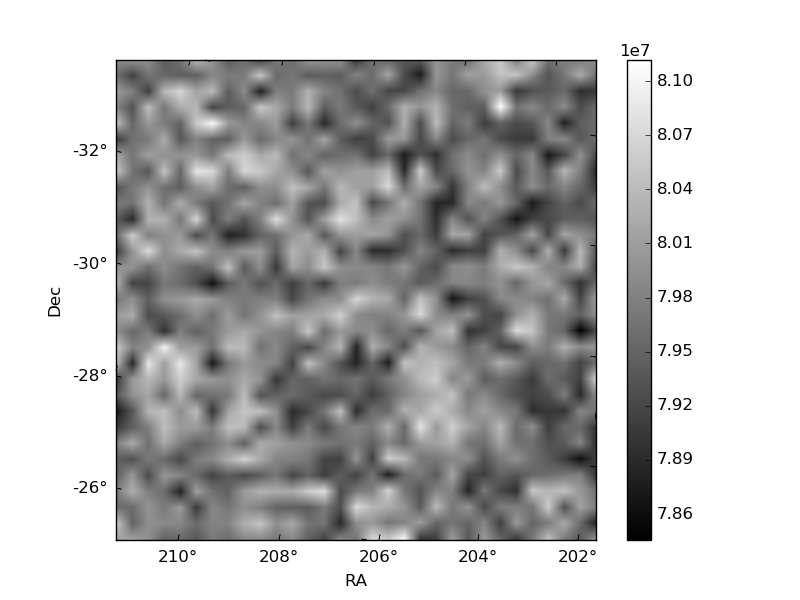
| Quadrant A | 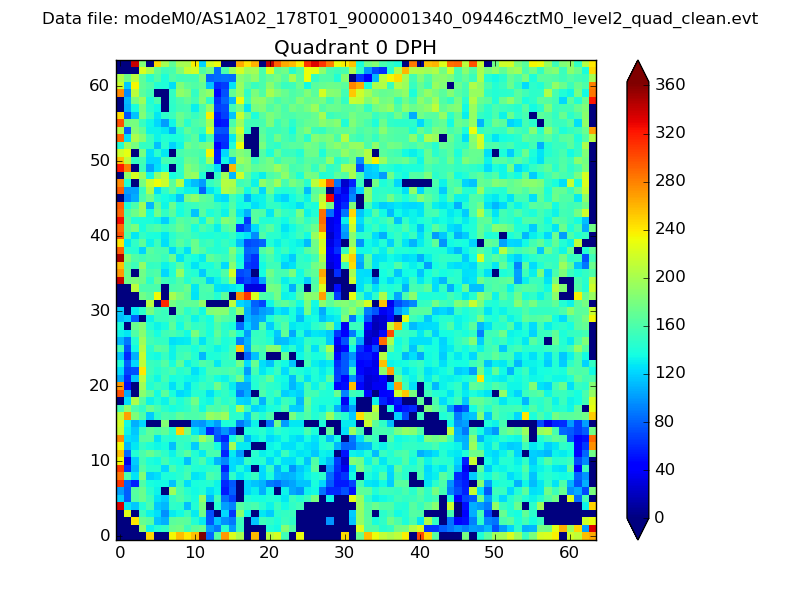 |
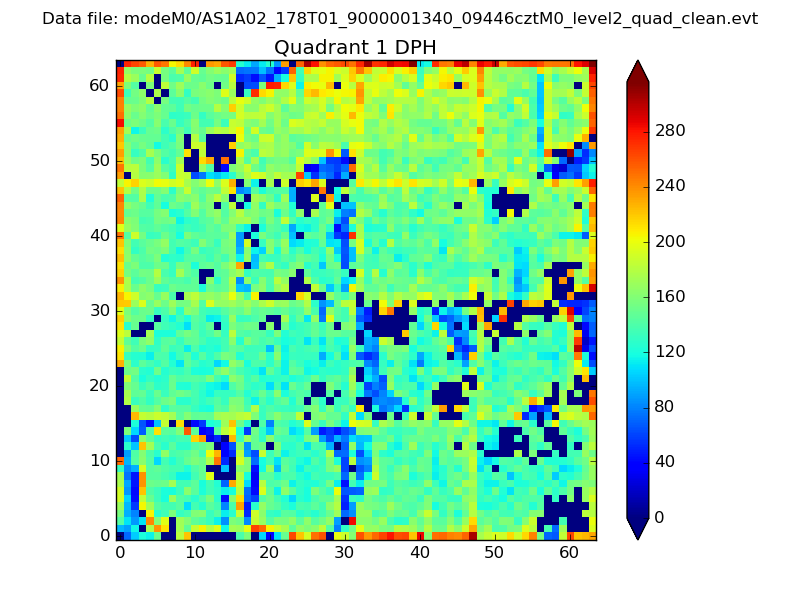 |
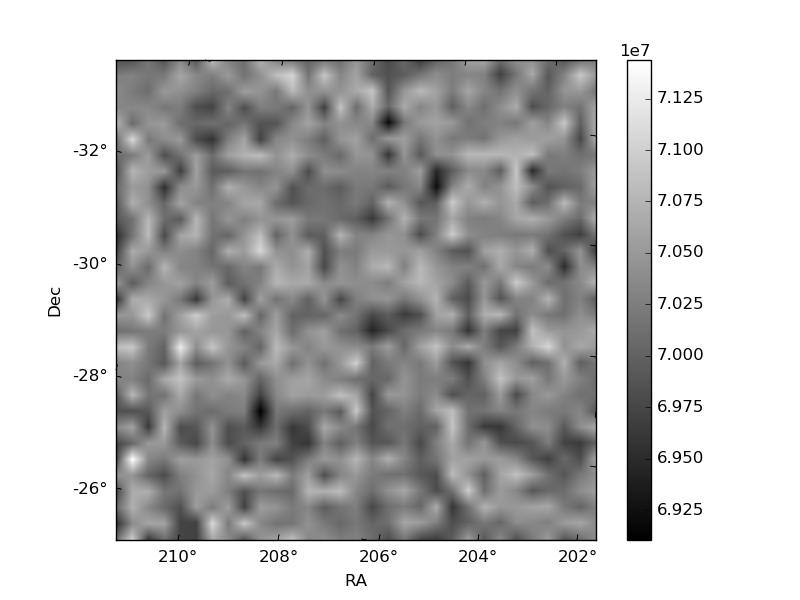
Quadrant B |
|---|---|---|---|
| Quadrant D | 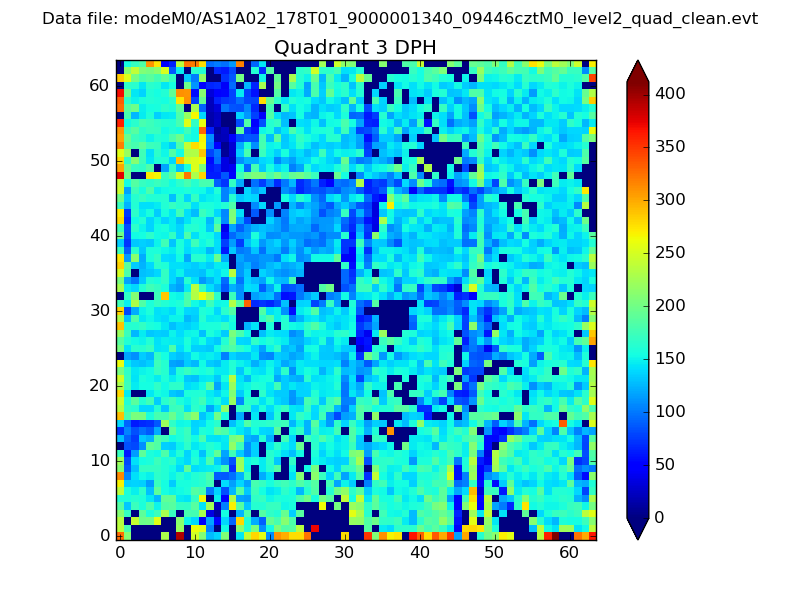 |
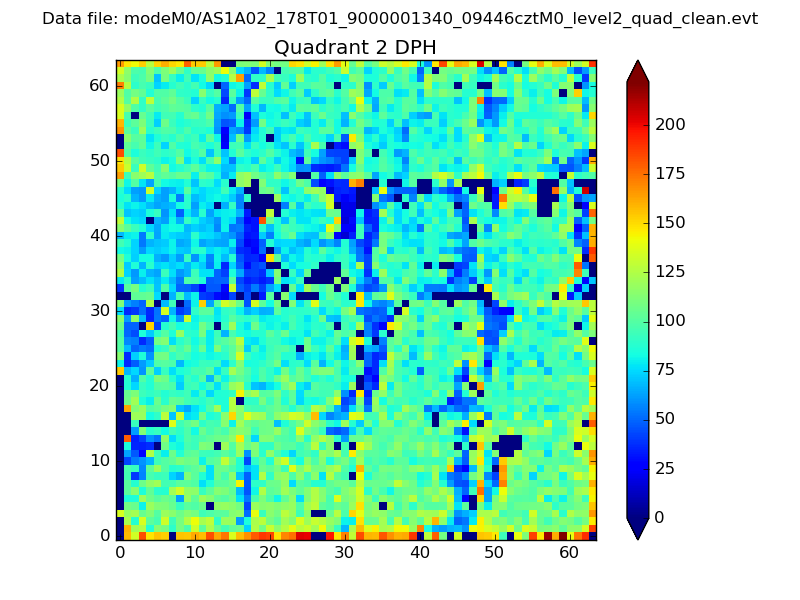 |
Quadrant C |
| Plot type | Count rate plots | Images |
|---|---|---|
| Comparison with Poisson distribution Blue bars denote a histogram of data divided into 1 sec bins. Red curve is a Poisson curve with rate = median count rate of data. |
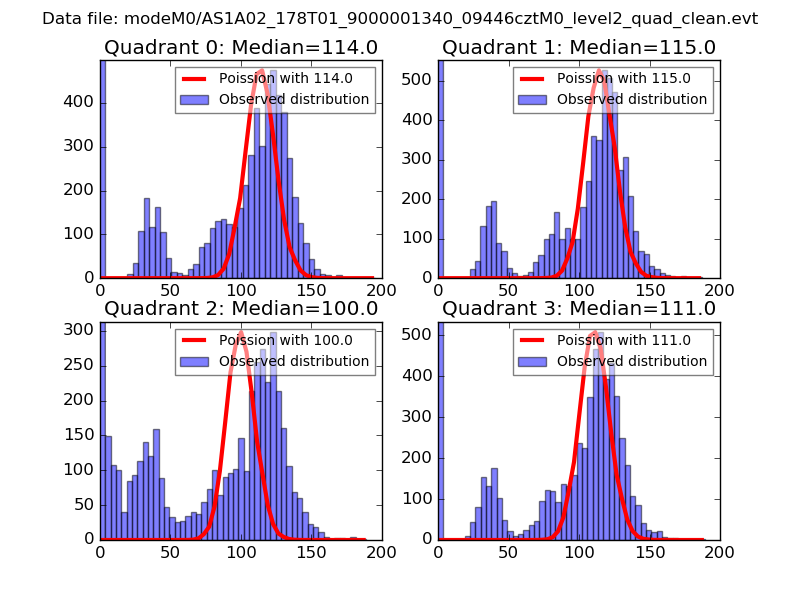 |
 |
| Quadrant-wise count rates Data is divided into 100 sec bins |
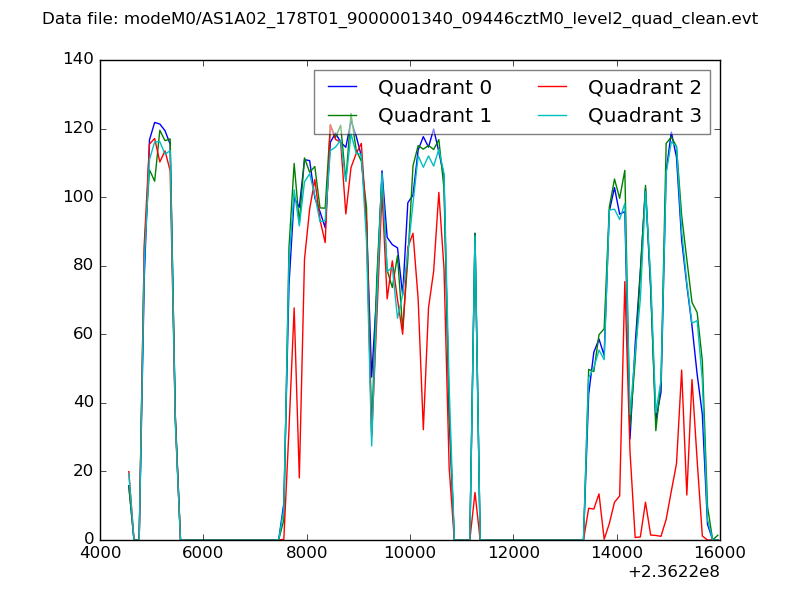 |
|
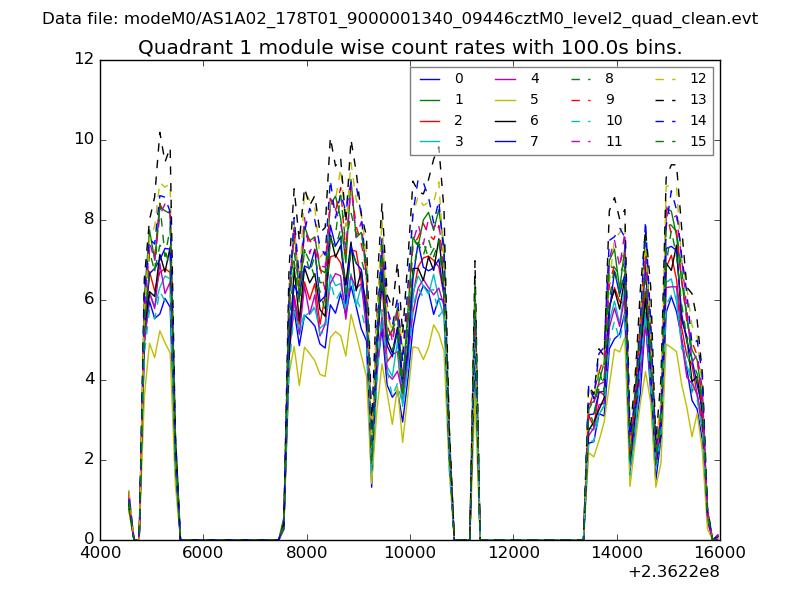
| Module-wise count rates for Quadrant A Data is divided into 100 sec bins |
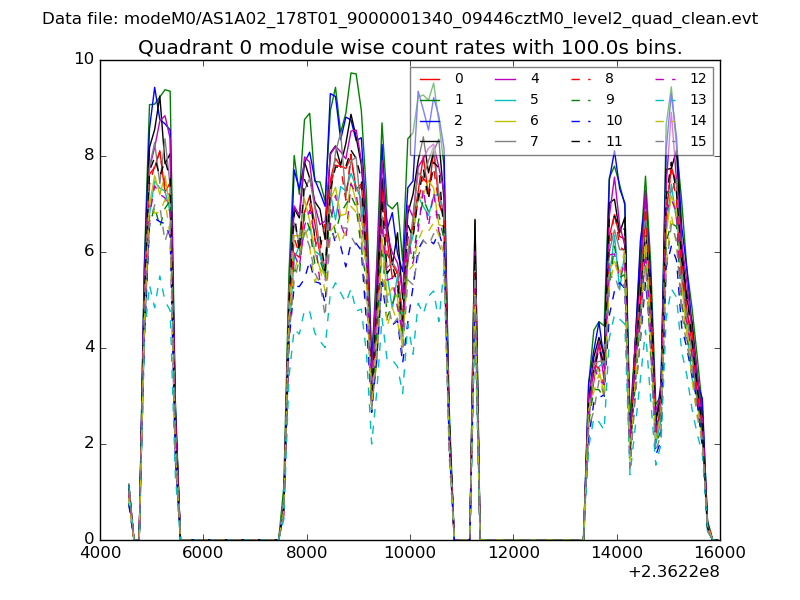 |
 |
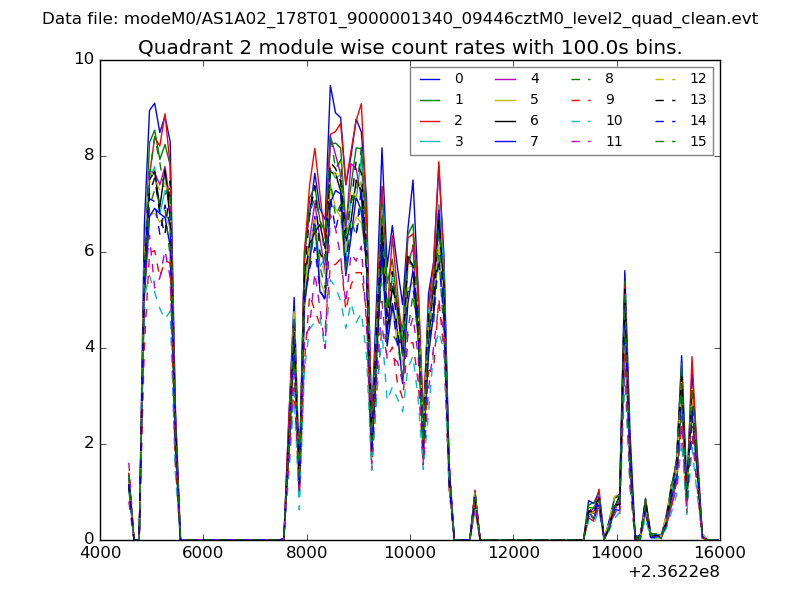
| Module-wise count rates for Quadrant B Data is divided into 100 sec bins |
 |
 |
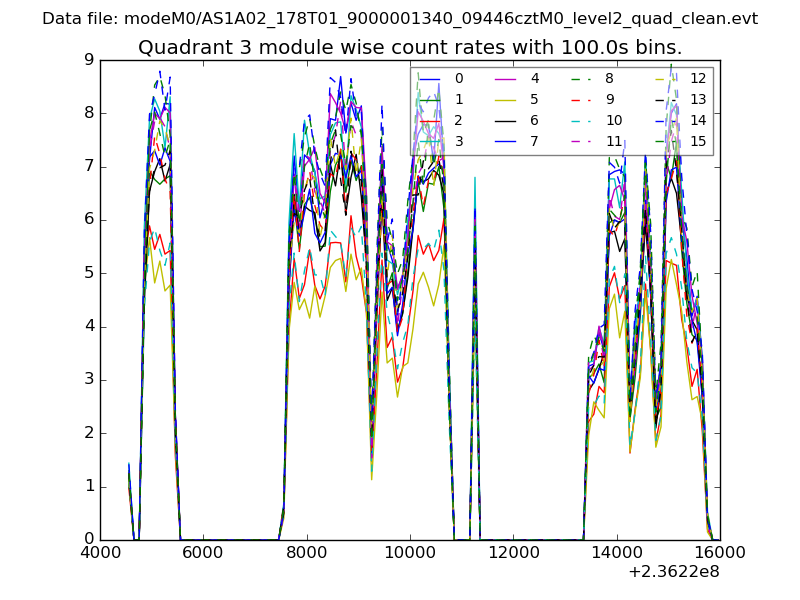
| Module-wise count rates for Quadrant C Data is divided into 100 sec bins |
 |
 |
| Module-wise count rates for Quadrant D Data is divided into 100 sec bins |
 |
 |
| Parameter | Plot |
|---|---|
| CZT HV Monitor | 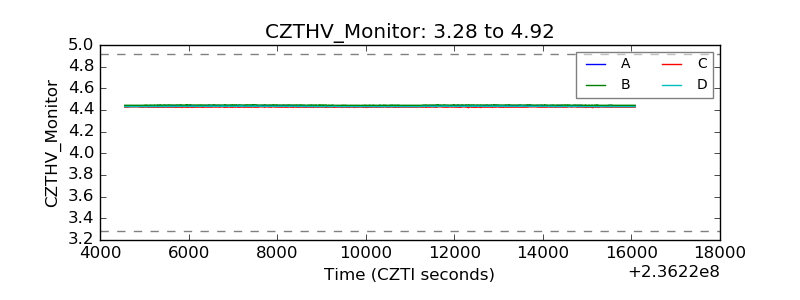 |
| D_VDD | 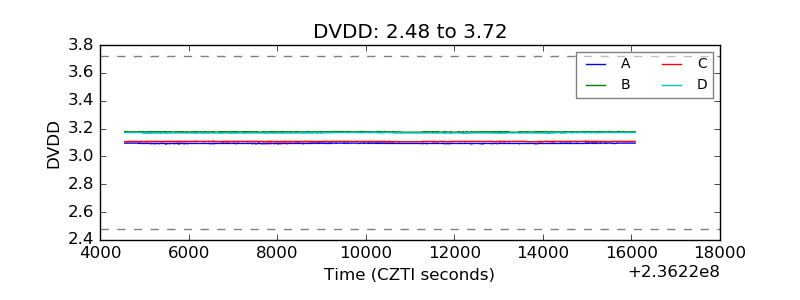 |
| Temperature 1 | 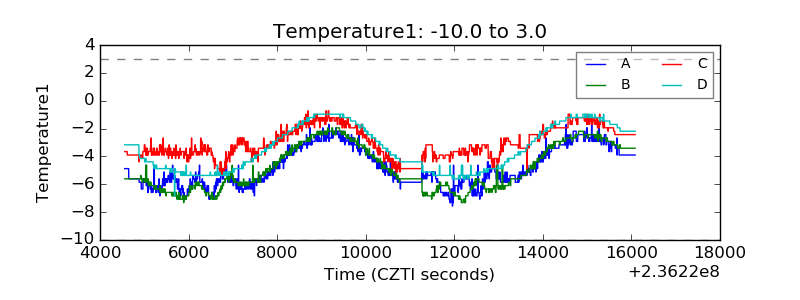 |
| Veto HV Monitor | 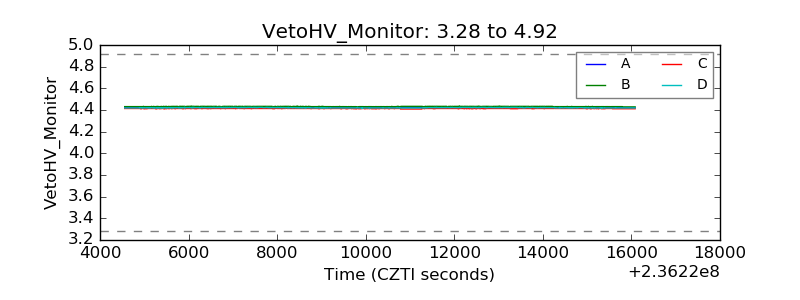 |
| Veto LLD | 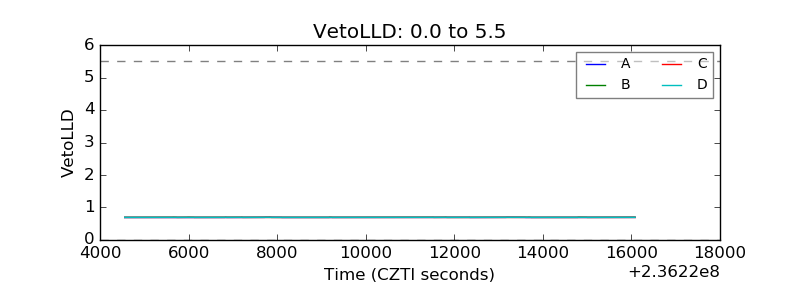 |
| Alpha Counter | 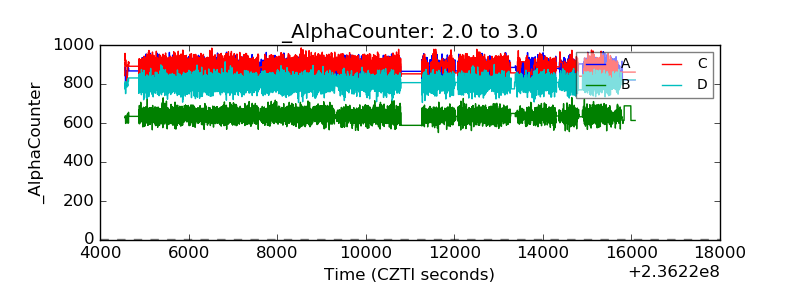 |
| _CPM_Rate | 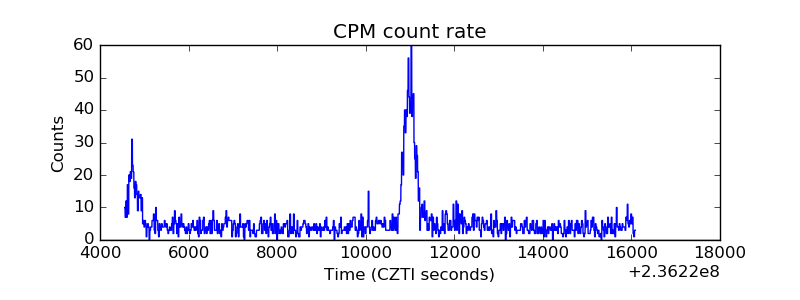 |
| CZT Counter | 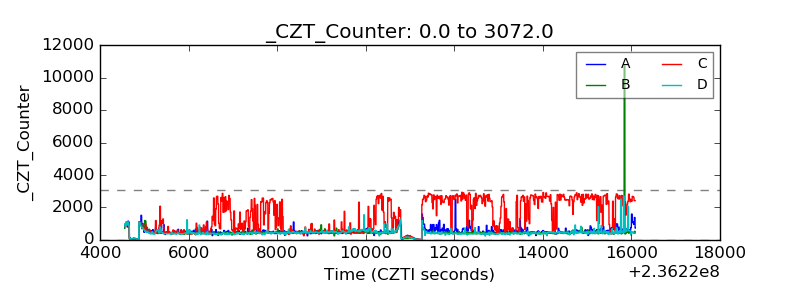 |
| +2.5 Volts monitor |  |
| +5 Volts monitor |  |
| _ROLL_ROT | 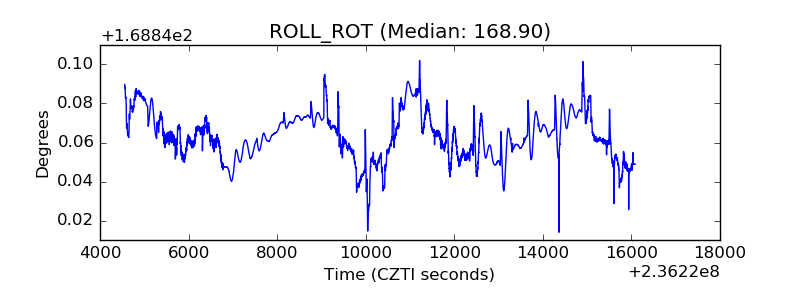 |
| _Roll_DEC | 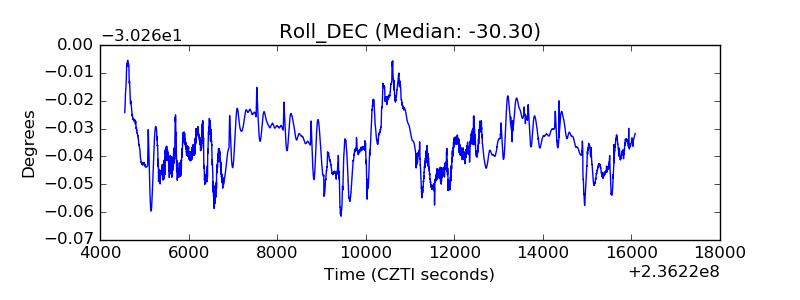 |
| _Roll_RA |  |
| Veto Counter | 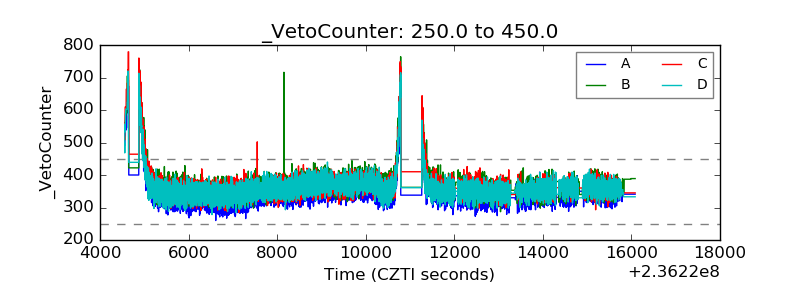 |