| Param | Original file | Final file |
|---|---|---|
| Filename | modeM0/AS1A02_178T01_9000001340_09448cztM0_level2.evt | modeM0/AS1A02_178T01_9000001340_09448cztM0_level2_quad_clean.evt |
| Size (bytes) | 787,688,640 | 92,476,800 |
| Size | 751.2 MB | 88.2 MB |
| Events in quadrant A | 4,442,317 | 617,429 |
| Events in quadrant B | 3,893,222 | 628,603 |
| Events in quadrant C | 11,071,917 | 381,105 |
| Events in quadrant D | 3,893,117 | 603,605 |
| Mode SS | |||
|---|---|---|---|
| Quadrant | BADHDUFLAG | Total packets | Discarded packets |
| A | 0 | 188 | 16 |
| B | 0 | 188 | 14 |
| C | 0 | 188 | 12 |
| D | 0 | 188 | 10 |
| Mode M0 | |||
|---|---|---|---|
| Quadrant | BADHDUFLAG | Total packets | Discarded packets |
| A | 0 | 21235 | 2701 |
| B | 0 | 19248 | 1885 |
| C | 0 | 53090 | 15156 |
| D | 0 | 19840 | 2187 |
| Mode M9 | |||
|---|---|---|---|
| Quadrant | BADHDUFLAG | Total packets | Discarded packets |
| A | 0 | 5 | 0 |
| B | 0 | 5 | 0 |
| C | 0 | 5 | 0 |
| D | 0 | 5 | 0 |
| Quadrant | Total seconds | Saturated seconds | Saturation percentage |
|---|---|---|---|
| A | 8328 | 70 | 0.840538% |
| B | 8476 | 50 | 0.589901% |
| C | 7334 | 3113 | 42.446141% |
| D | 8441 | 47 | 0.556806% |
Noise dominated data is calculated using 1-second bins in cleaned event files. If a bin has >2000 counts, and if more than 50% of those come from <1% of pixels, then it is considered to be noise-dominated and hence unusable.
| Quadrant | # 1 sec bins | Bins with >0 counts | Bins with >2000 counts | High rate bins dominated by noise | Noise dominated (total time) | Noise dominated (detector-on time) | Marked lightcurve |
|---|---|---|---|---|---|---|---|
| A | 9883 | 9070 | 12 | 12 | 0.12% | 0.13% |  |
| B | 9884 | 9148 | 4 | 4 | 0.04% | 0.04% | 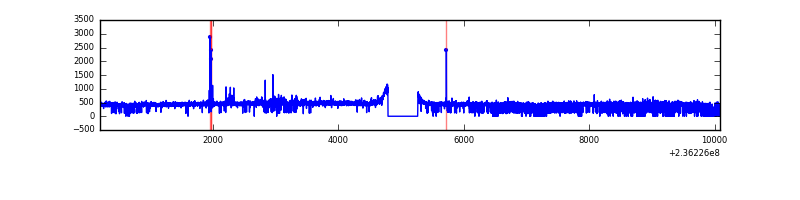 |
| C | 9851 | 7950 | 2448 | 2448 | 24.85% | 30.79% | 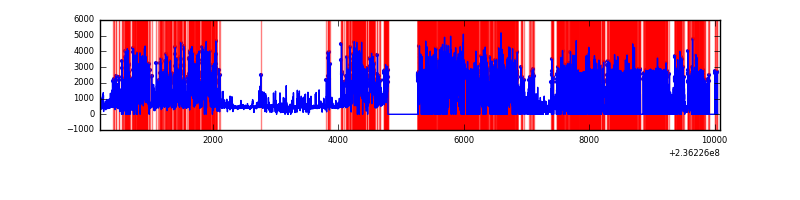 |
| D | 9885 | 9118 | 12 | 12 | 0.12% | 0.13% | 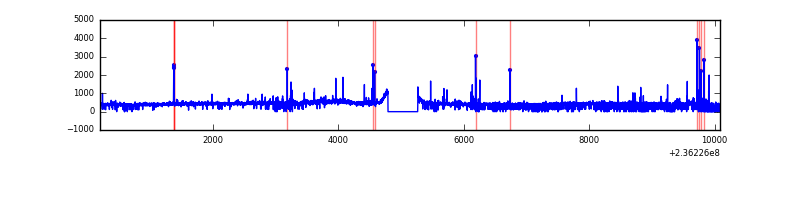 |
Top three noisy pixels from each quadrant. If the there are fewer than three noisy pixels in the level2.evt file, extra rows are filled as -1
| Pixel properties | Quadrant properties | ||||||
|---|---|---|---|---|---|---|---|
| Quadrant | DetID | PixID | Counts | Sigma | Mean | Median | Sigma |
| A | 8 | 5 | 475619 | 2422.53 | 954 | 934 | 195.9 |
| A | 1 | 162 | 126952 | 643.12 | 954 | 934 | 195.9 |
| A | 4 | 2 | 50908 | 255.04 | 954 | 934 | 195.9 |
| B | 0 | 214 | 36187 | 188.69 | 968 | 943 | 186.8 |
| B | 4 | 80 | 29803 | 154.51 | 968 | 943 | 186.8 |
| B | 0 | 219 | 27770 | 143.62 | 968 | 943 | 186.8 |
| C | 4 | 254 | 8561878 | 61710.5 | 593 | 596 | 138.7 |
| C | 9 | 68 | 185213 | 1330.74 | 593 | 596 | 138.7 |
| C | 13 | 61 | 4486 | 28.04 | 593 | 596 | 138.7 |
| D | 8 | 195 | 152580 | 658.88 | 931 | 908 | 230.2 |
| D | 1 | 52 | 85715 | 368.41 | 931 | 908 | 230.2 |
| D | 7 | 71 | 78221 | 335.86 | 931 | 908 | 230.2 |
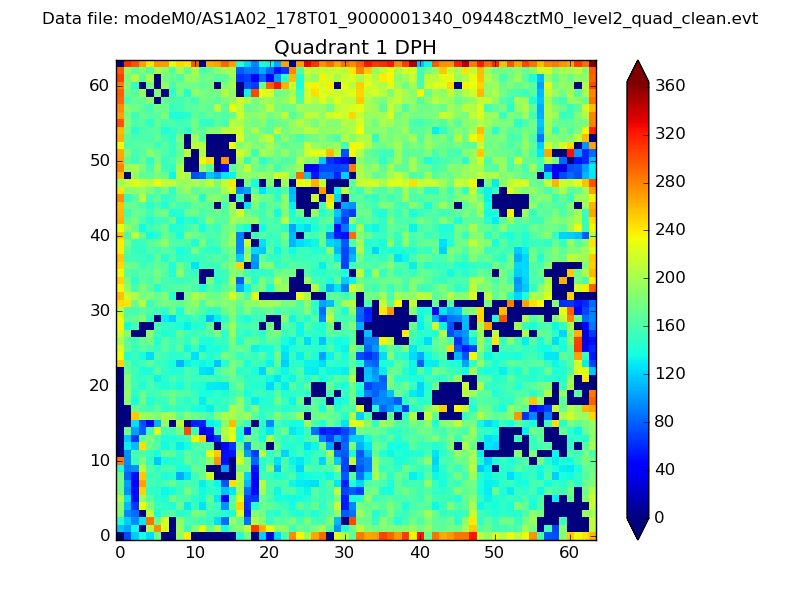
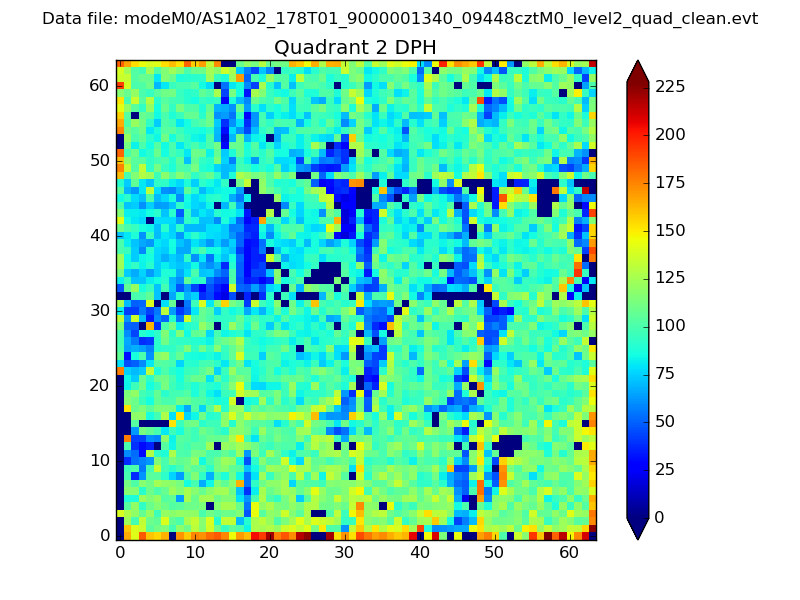
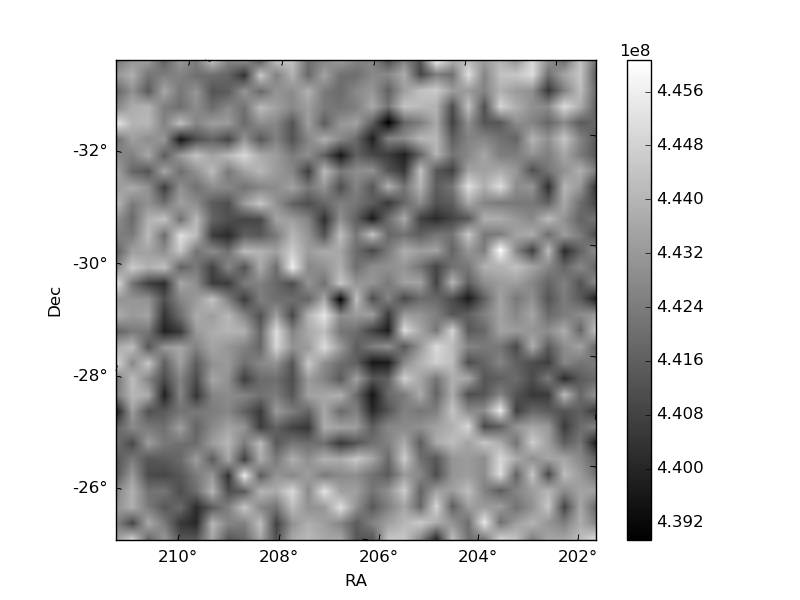
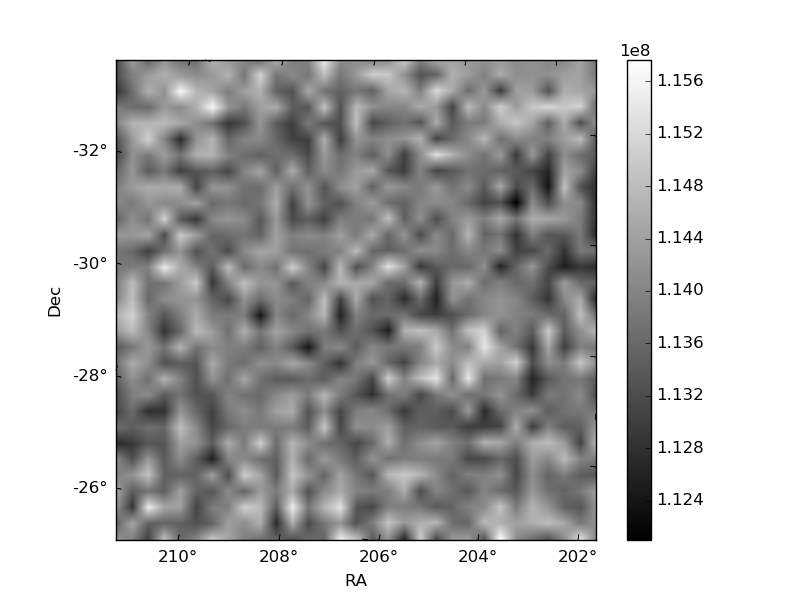
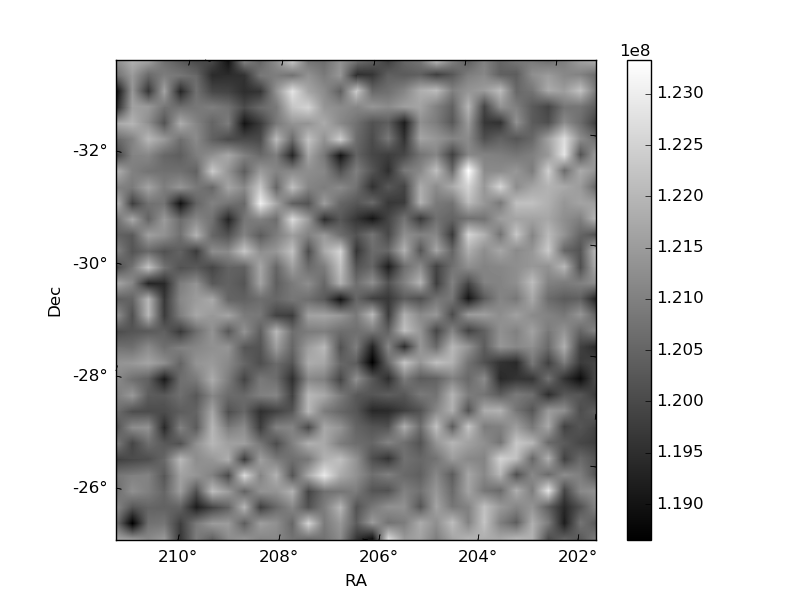
Histogram calculated using DETX and DETY for each event in the final _common_clean file
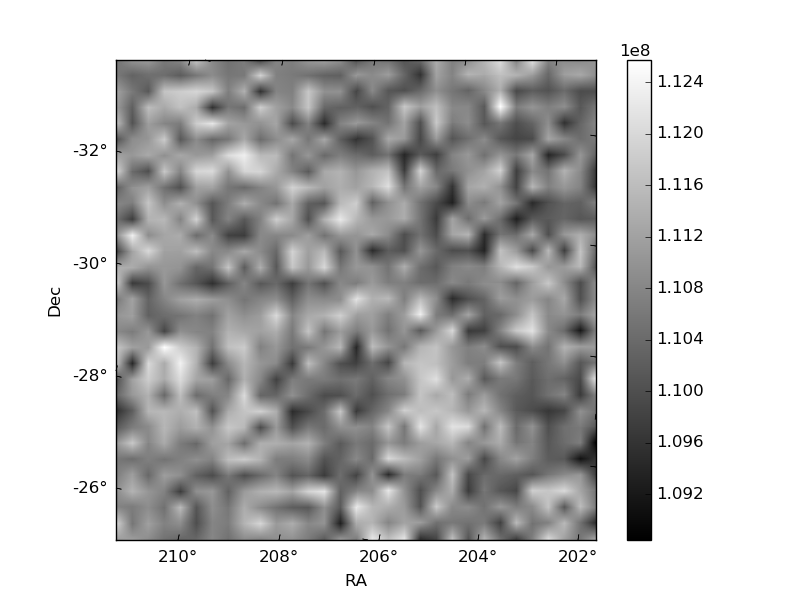
| Quadrant A | 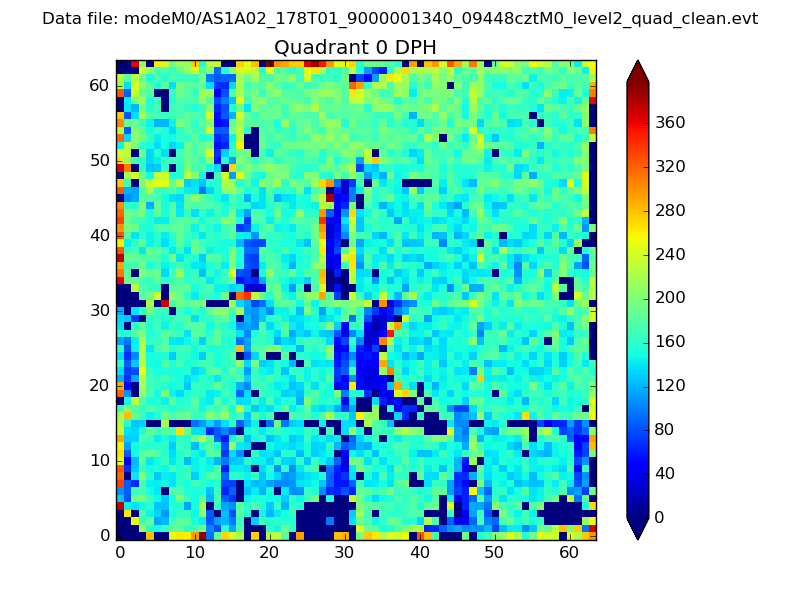 |
 |
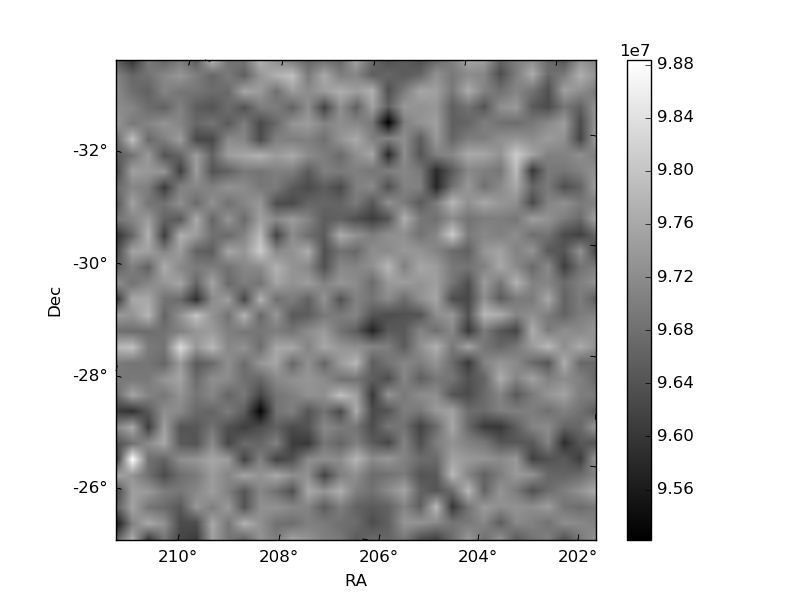
Quadrant B |
|---|---|---|---|
| Quadrant D | 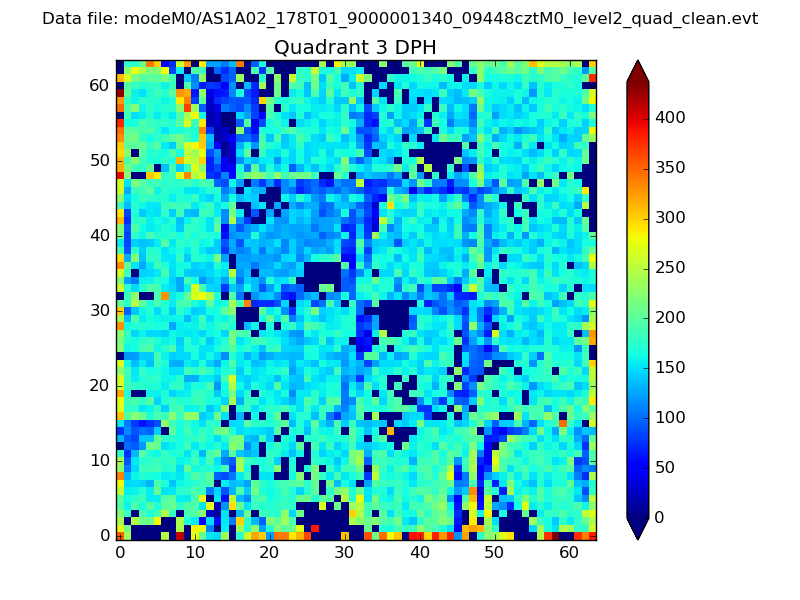 |
 |
Quadrant C |
| Plot type | Count rate plots | Images |
|---|---|---|
| Comparison with Poisson distribution Blue bars denote a histogram of data divided into 1 sec bins. Red curve is a Poisson curve with rate = median count rate of data. |
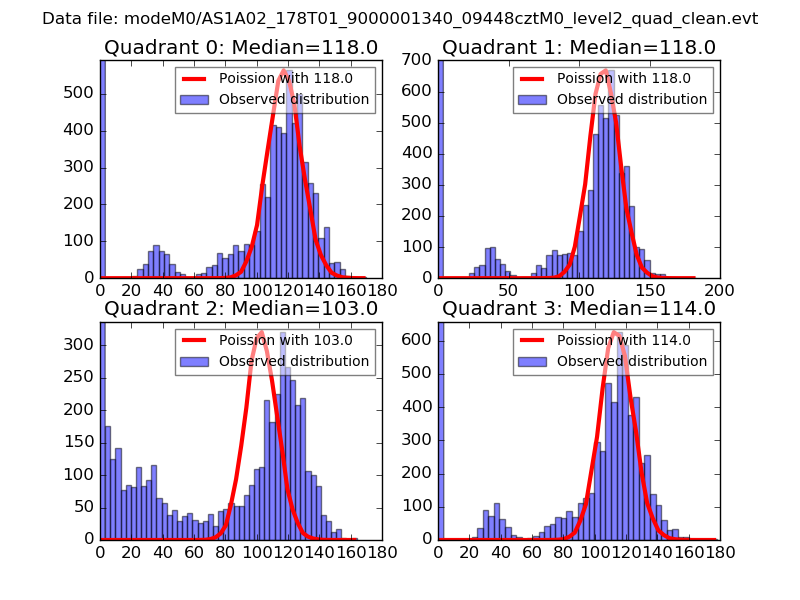 |
 |
| Quadrant-wise count rates Data is divided into 100 sec bins |
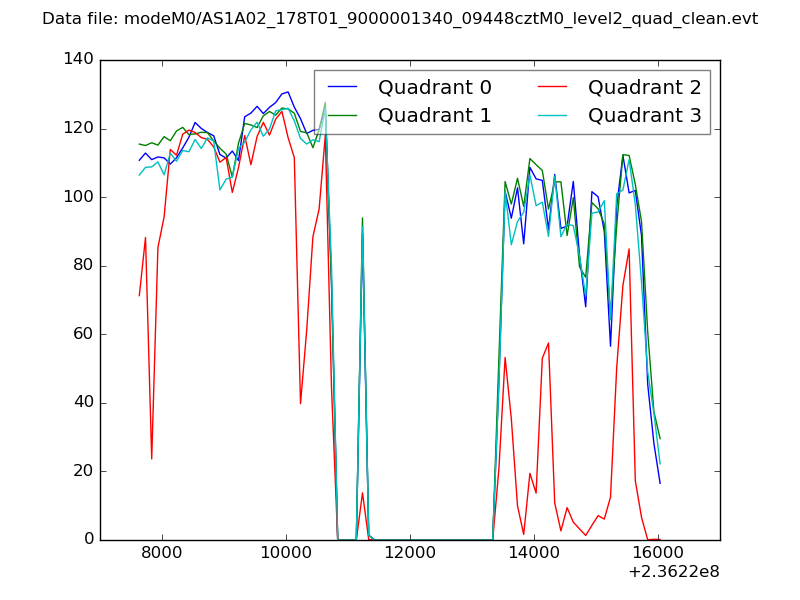 |
|
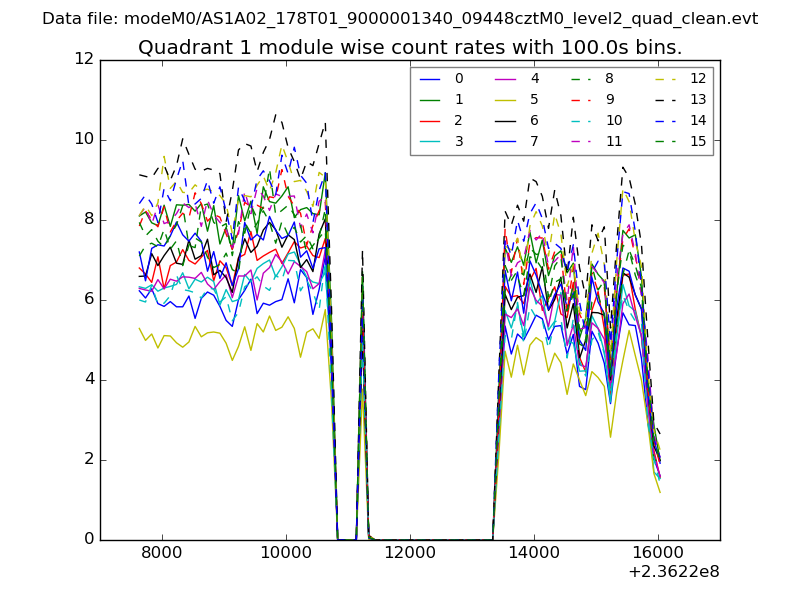
| Module-wise count rates for Quadrant A Data is divided into 100 sec bins |
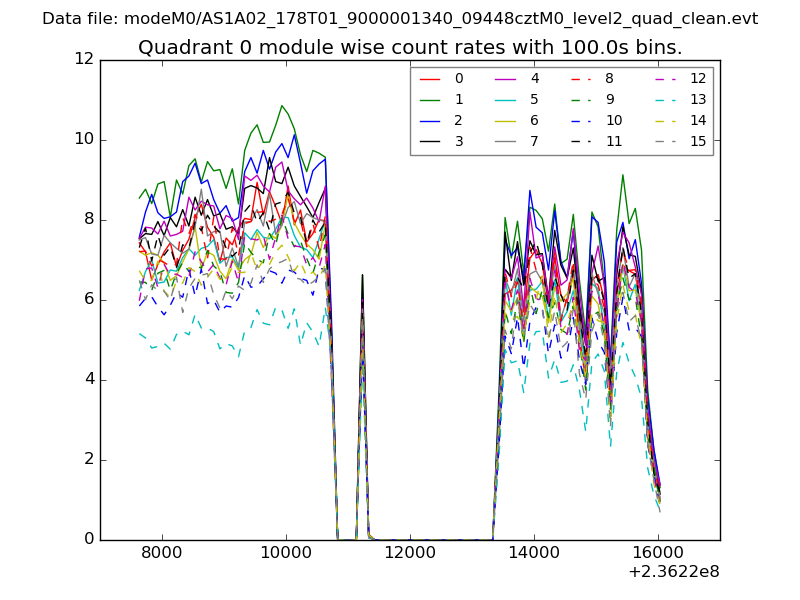 |
 |
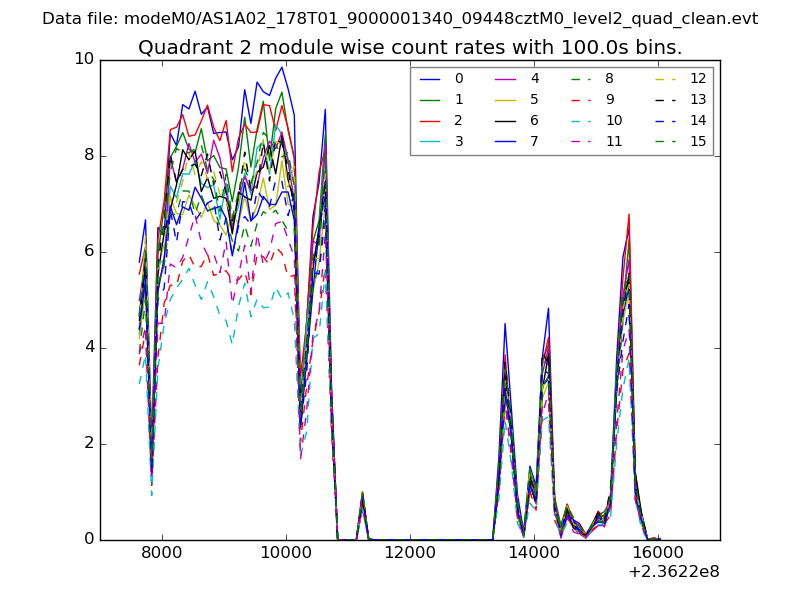
| Module-wise count rates for Quadrant B Data is divided into 100 sec bins |
 |
 |
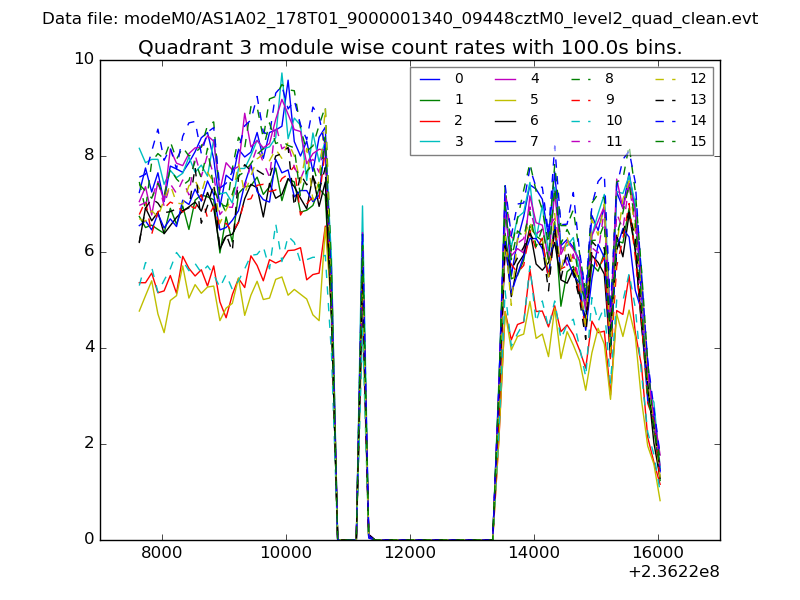
| Module-wise count rates for Quadrant C Data is divided into 100 sec bins |
 |
 |
| Module-wise count rates for Quadrant D Data is divided into 100 sec bins |
 |
 |
| Parameter | Plot |
|---|---|
| CZT HV Monitor | 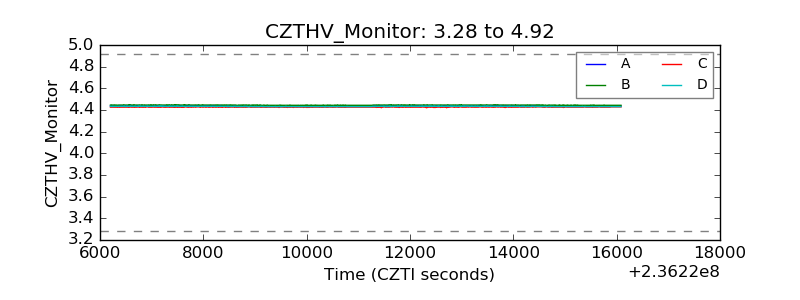 |
| D_VDD | 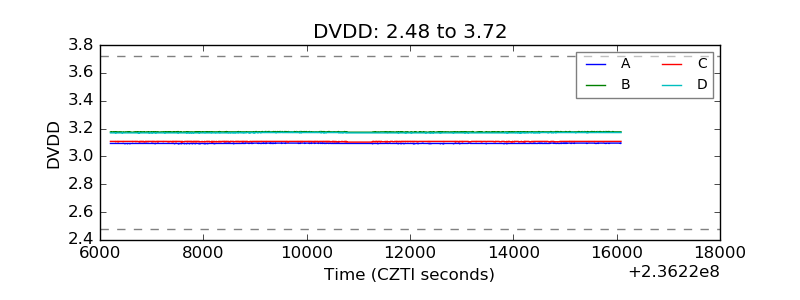 |
| Temperature 1 | 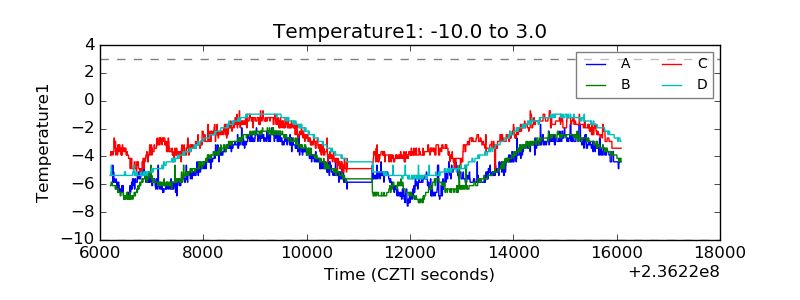 |
| Veto HV Monitor |  |
| Veto LLD | 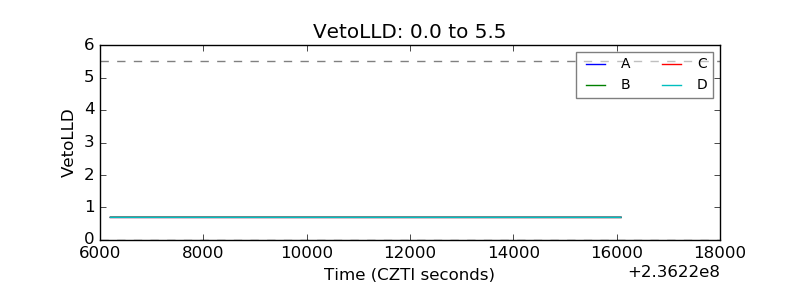 |
| Alpha Counter | 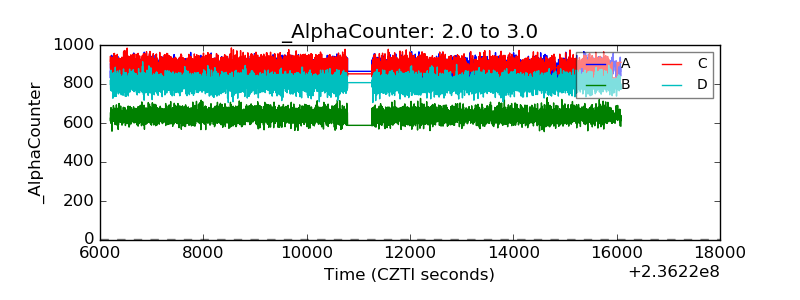 |
| _CPM_Rate | 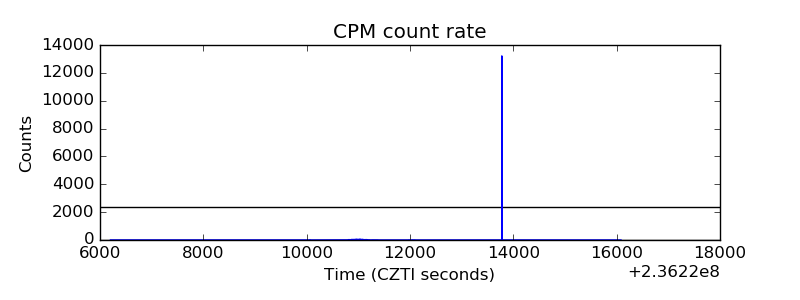 |
| CZT Counter | 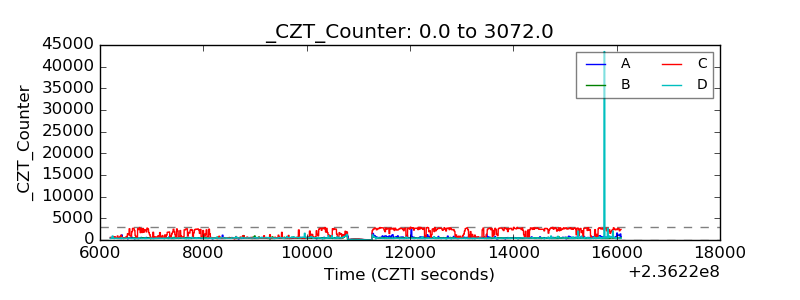 |
| +2.5 Volts monitor |  |
| +5 Volts monitor |  |
| _ROLL_ROT | 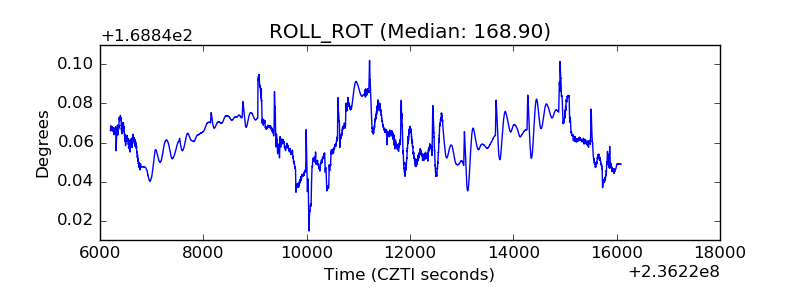 |
| _Roll_DEC | 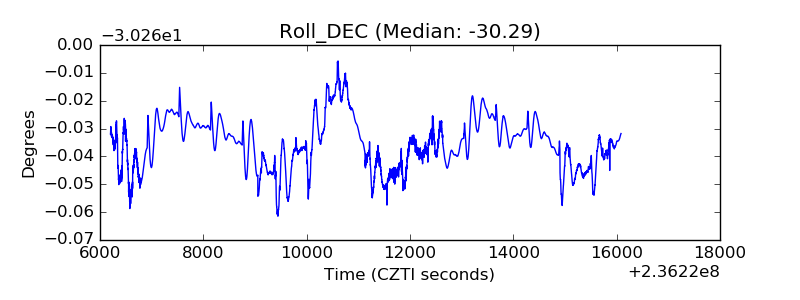 |
| _Roll_RA | 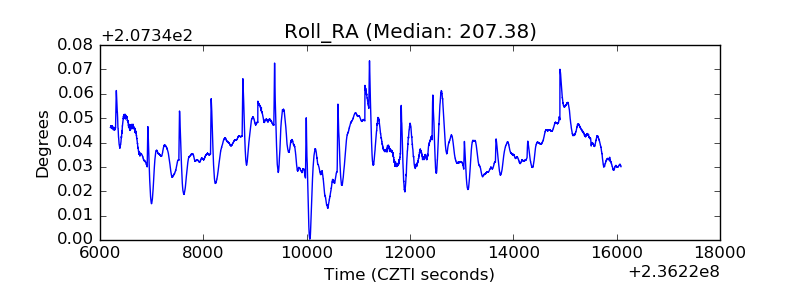 |
| Veto Counter | 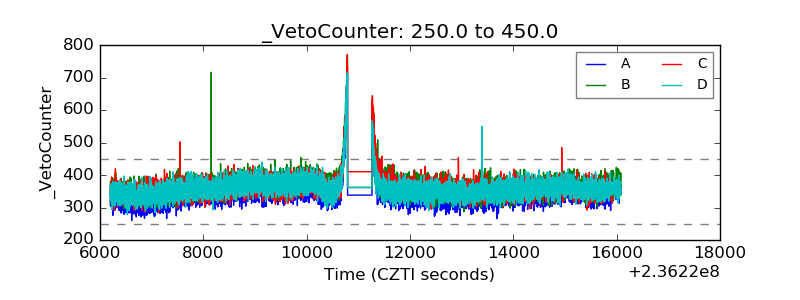 |