| Param | Original file | Final file |
|---|---|---|
| Filename | modeM0/AS1A02_178T01_9000001340_09449cztM0_level2.evt | modeM0/AS1A02_178T01_9000001340_09449cztM0_level2_quad_clean.evt |
| Size (bytes) | 991,480,320 | 104,316,480 |
| Size | 945.5 MB | 99.5 MB |
| Events in quadrant A | 5,095,787 | 701,733 |
| Events in quadrant B | 4,306,556 | 702,308 |
| Events in quadrant C | 15,599,344 | 423,690 |
| Events in quadrant D | 4,391,438 | 679,633 |
| Mode SS | |||
|---|---|---|---|
| Quadrant | BADHDUFLAG | Total packets | Discarded packets |
| A | 0 | 188 | 2 |
| B | 0 | 188 | 0 |
| C | 0 | 188 | 4 |
| D | 0 | 188 | 0 |
| Mode M0 | |||
|---|---|---|---|
| Quadrant | BADHDUFLAG | Total packets | Discarded packets |
| A | 0 | 21253 | 44 |
| B | 0 | 19263 | 28 |
| C | 0 | 53139 | 343 |
| D | 0 | 19855 | 44 |
| Mode M9 | |||
|---|---|---|---|
| Quadrant | BADHDUFLAG | Total packets | Discarded packets |
| A | 0 | 5 | 0 |
| B | 0 | 5 | 0 |
| C | 0 | 5 | 0 |
| D | 0 | 5 | 0 |
| Quadrant | Total seconds | Saturated seconds | Saturation percentage |
|---|---|---|---|
| A | 9395 | 81 | 0.862161% |
| B | 9398 | 50 | 0.532028% |
| C | 9369 | 4744 | 50.635073% |
| D | 9391 | 70 | 0.745395% |
Noise dominated data is calculated using 1-second bins in cleaned event files. If a bin has >2000 counts, and if more than 50% of those come from <1% of pixels, then it is considered to be noise-dominated and hence unusable.
| Quadrant | # 1 sec bins | Bins with >0 counts | Bins with >2000 counts | High rate bins dominated by noise | Noise dominated (total time) | Noise dominated (detector-on time) | Marked lightcurve |
|---|---|---|---|---|---|---|---|
| A | 9886 | 9412 | 19 | 19 | 0.19% | 0.20% | 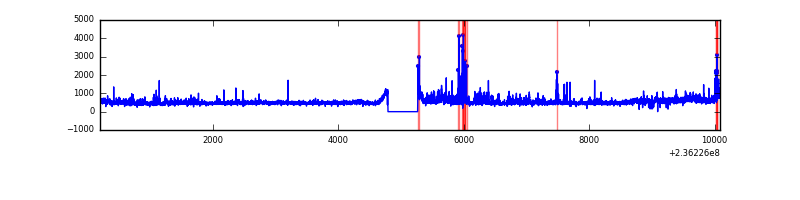 |
| B | 9886 | 9411 | 4 | 4 | 0.04% | 0.04% | 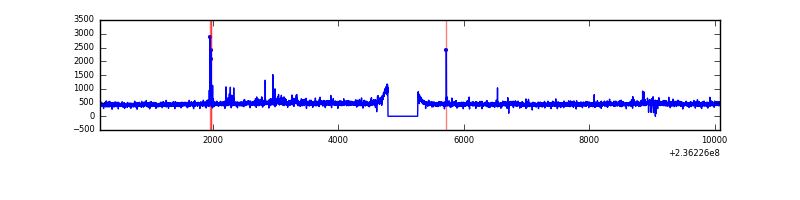 |
| C | 9885 | 9377 | 3969 | 3969 | 40.15% | 42.33% | 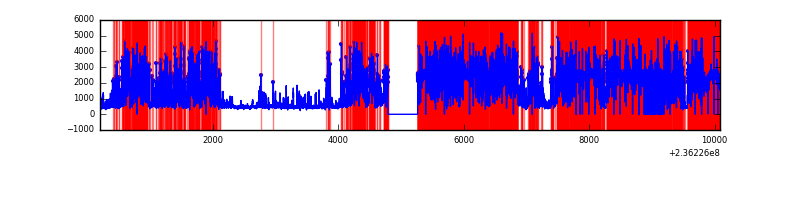 |
| D | 9886 | 9411 | 35 | 35 | 0.35% | 0.37% | 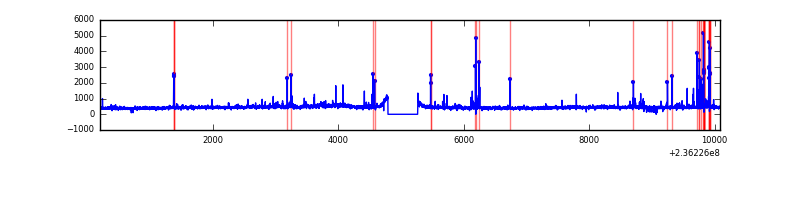 |
Top three noisy pixels from each quadrant. If the there are fewer than three noisy pixels in the level2.evt file, extra rows are filled as -1
| Pixel properties | Quadrant properties | ||||||
|---|---|---|---|---|---|---|---|
| Quadrant | DetID | PixID | Counts | Sigma | Mean | Median | Sigma |
| A | 8 | 5 | 568867 | 2566.02 | 1075 | 1053 | 221.3 |
| A | 1 | 162 | 164470 | 738.5 | 1075 | 1053 | 221.3 |
| A | 4 | 2 | 70101 | 312.04 | 1075 | 1053 | 221.3 |
| B | 0 | 214 | 44469 | 210.57 | 1072 | 1044 | 206.2 |
| B | 4 | 80 | 30320 | 141.96 | 1072 | 1044 | 206.2 |
| B | 0 | 219 | 30318 | 141.95 | 1072 | 1044 | 206.2 |
| C | 4 | 254 | 12692782 | 79410.44 | 687 | 690 | 159.8 |
| C | 9 | 68 | 218826 | 1364.81 | 687 | 690 | 159.8 |
| C | 13 | 61 | 5174 | 28.05 | 687 | 690 | 159.8 |
| D | 8 | 195 | 161971 | 628.19 | 1033 | 1006 | 256.2 |
| D | 7 | 71 | 121229 | 469.19 | 1033 | 1006 | 256.2 |
| D | 1 | 52 | 106264 | 410.79 | 1033 | 1006 | 256.2 |
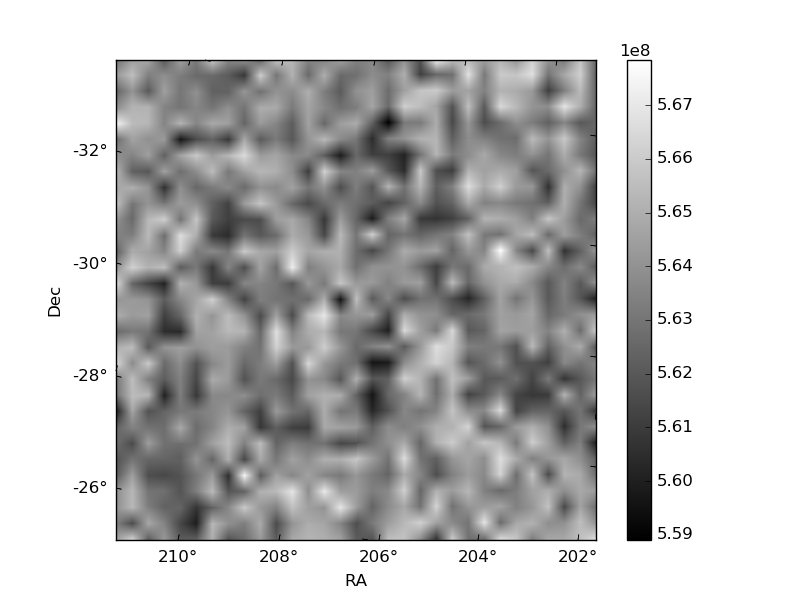
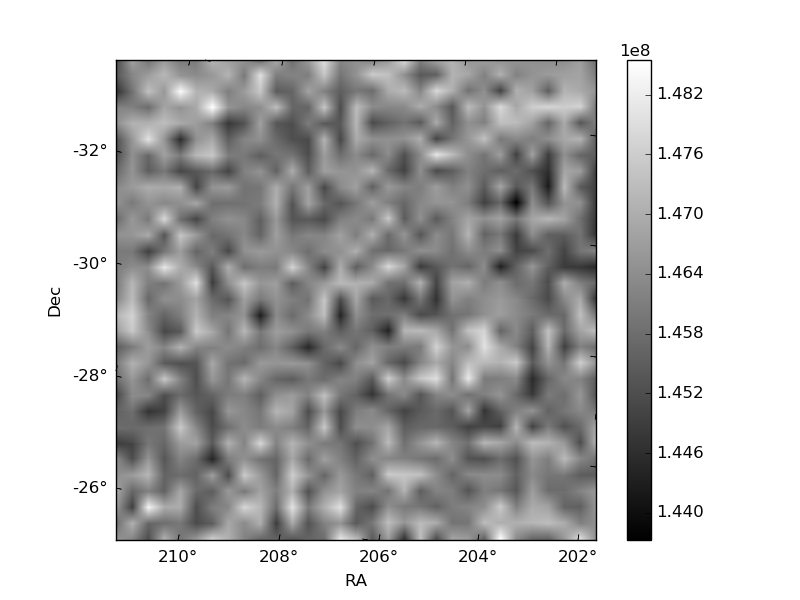
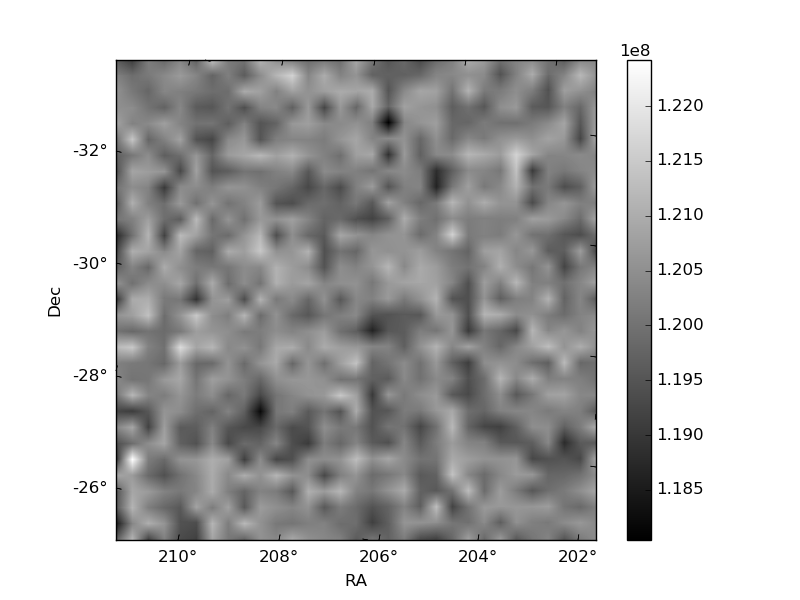
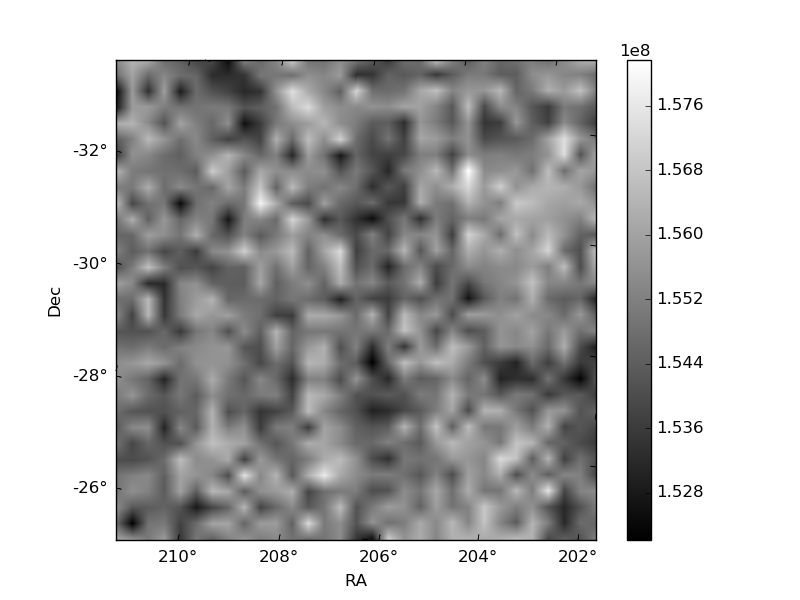
Histogram calculated using DETX and DETY for each event in the final _common_clean file
| Quadrant A | 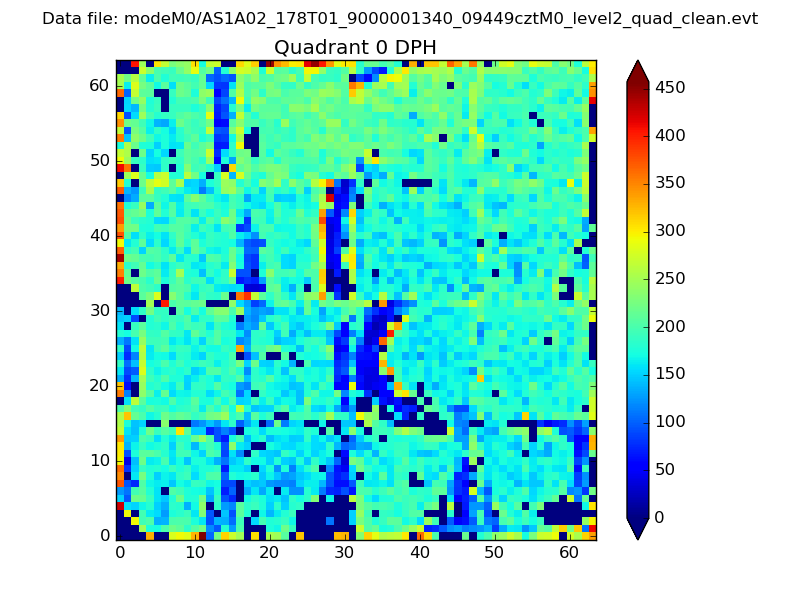 |
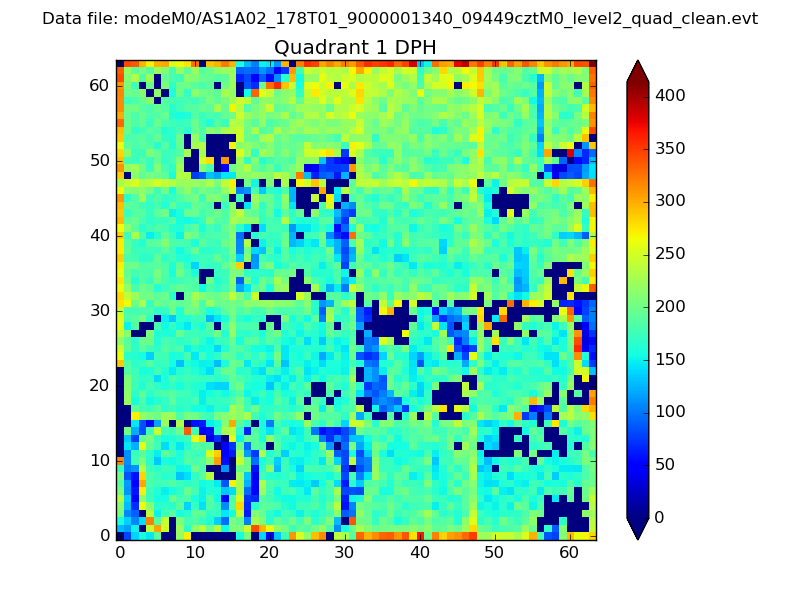 |
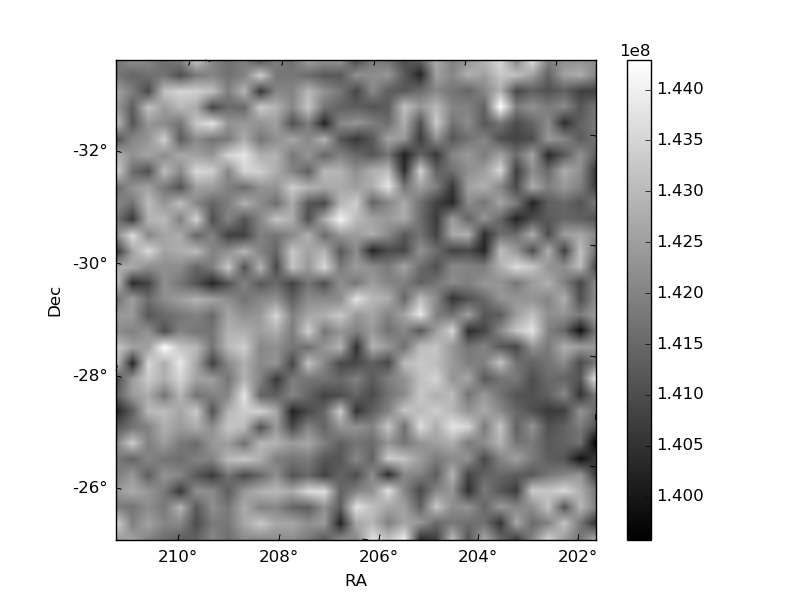
Quadrant B |
|---|---|---|---|
| Quadrant D | 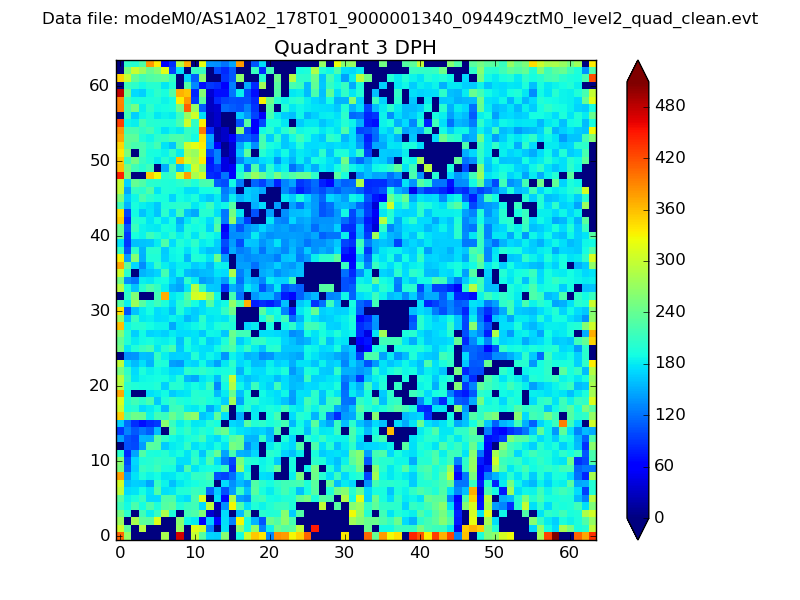 |
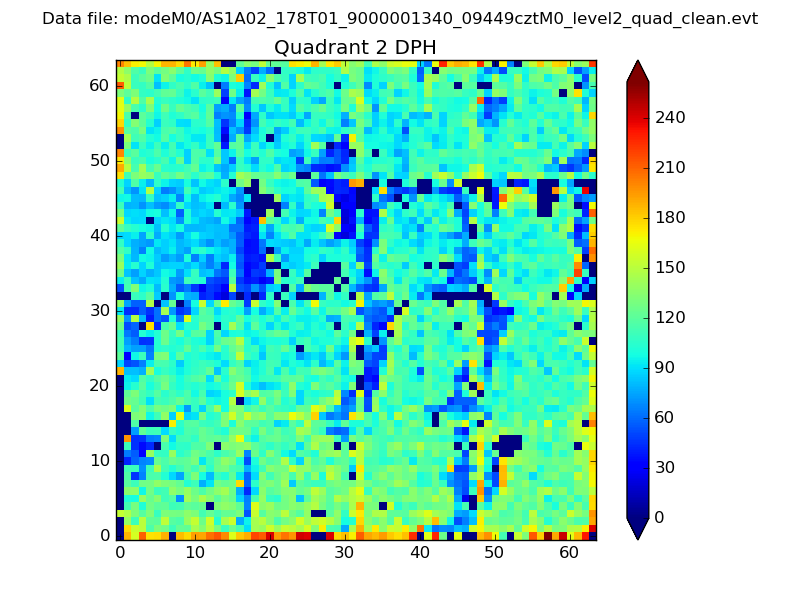 |
Quadrant C |
| Plot type | Count rate plots | Images |
|---|---|---|
| Comparison with Poisson distribution Blue bars denote a histogram of data divided into 1 sec bins. Red curve is a Poisson curve with rate = median count rate of data. |
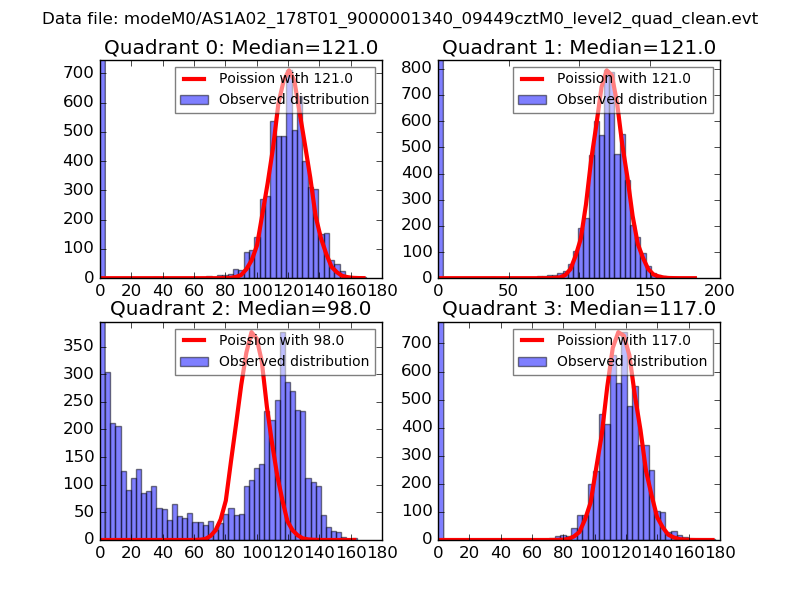 |
 |
| Quadrant-wise count rates Data is divided into 100 sec bins |
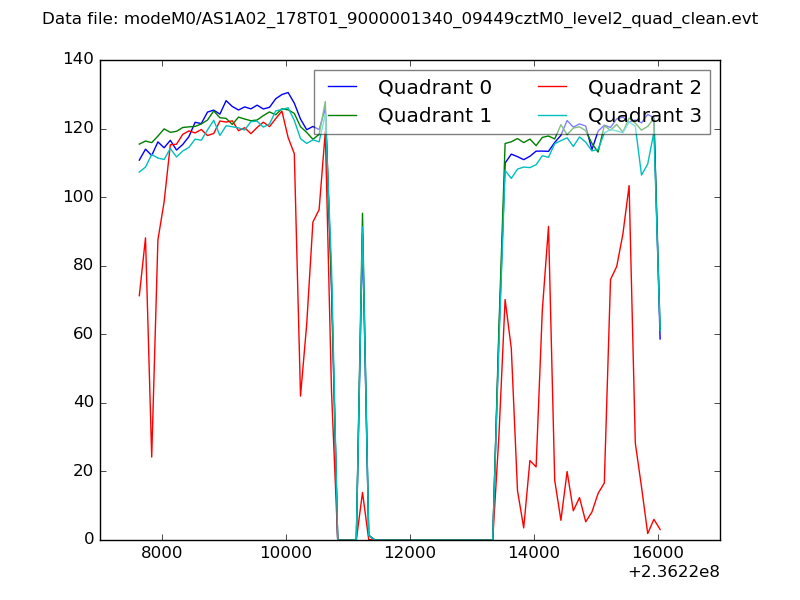 |
|
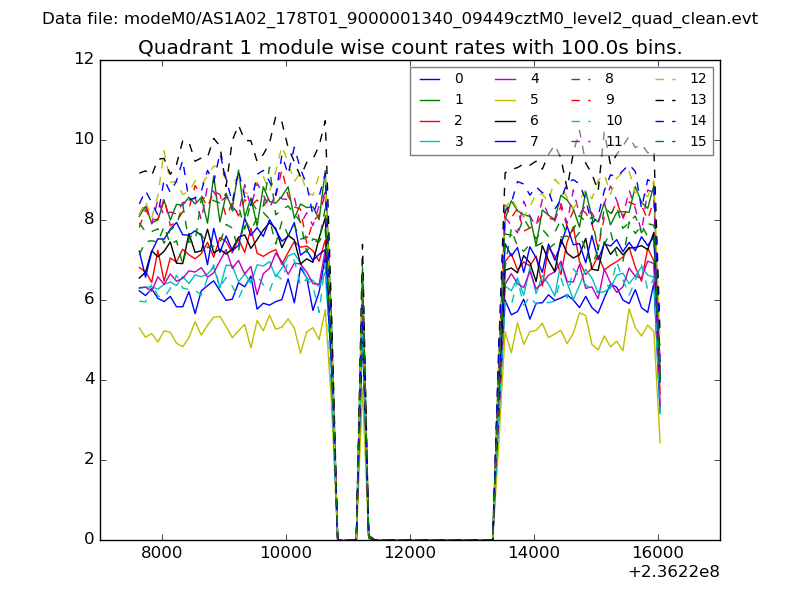
| Module-wise count rates for Quadrant A Data is divided into 100 sec bins |
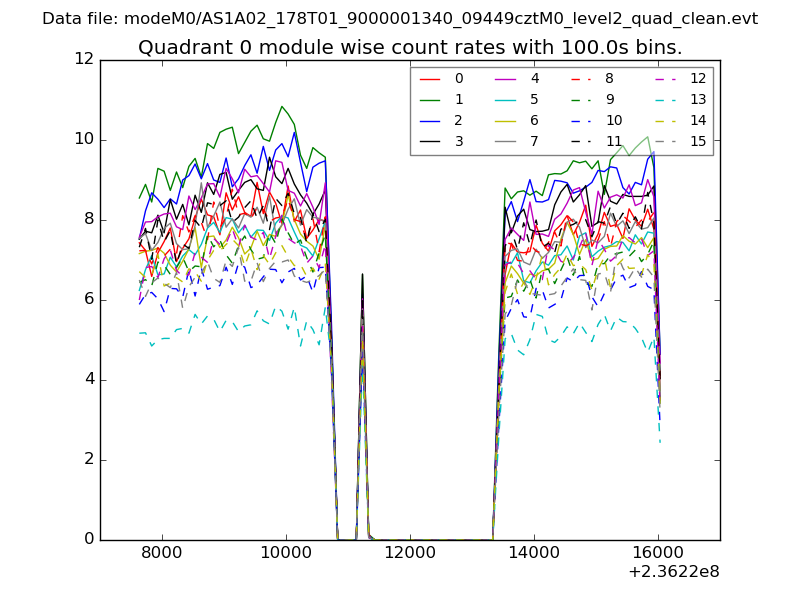 |
 |
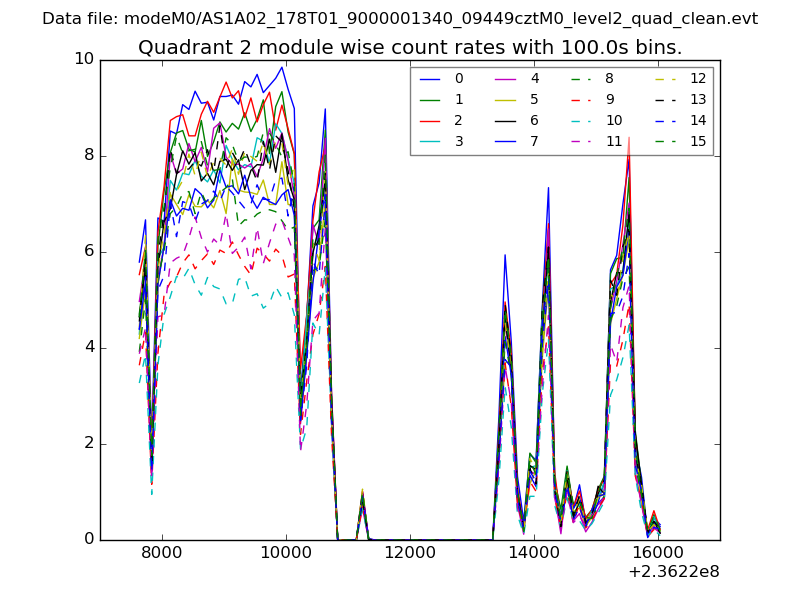
| Module-wise count rates for Quadrant B Data is divided into 100 sec bins |
 |
 |
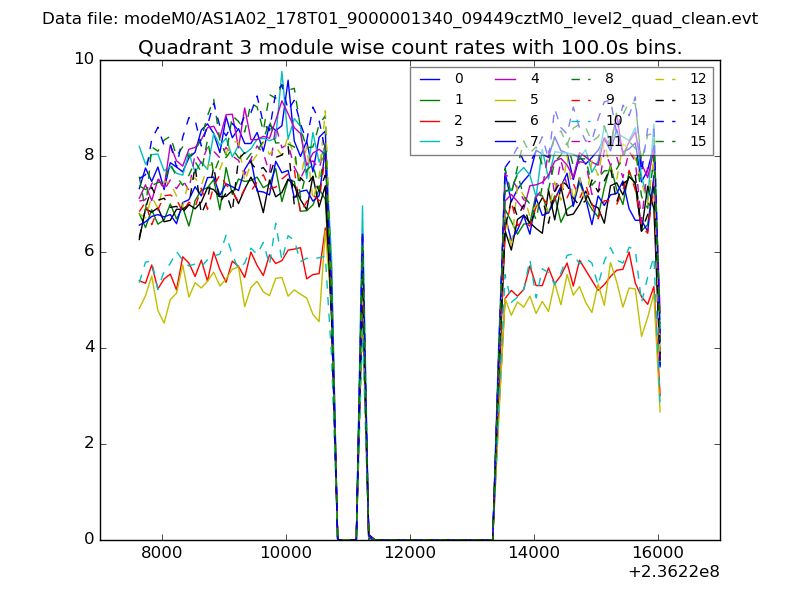
| Module-wise count rates for Quadrant C Data is divided into 100 sec bins |
 |
 |
| Module-wise count rates for Quadrant D Data is divided into 100 sec bins |
 |
 |
| Parameter | Plot |
|---|---|
| CZT HV Monitor | 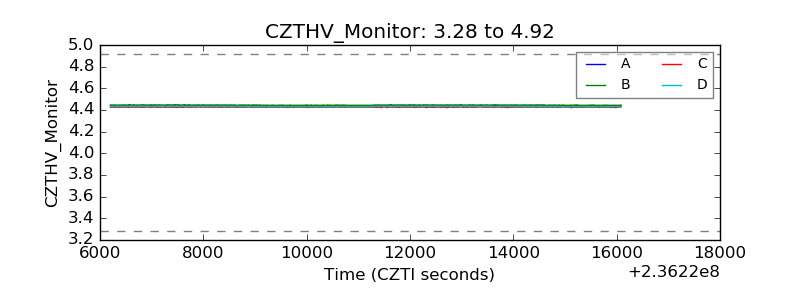 |
| D_VDD | 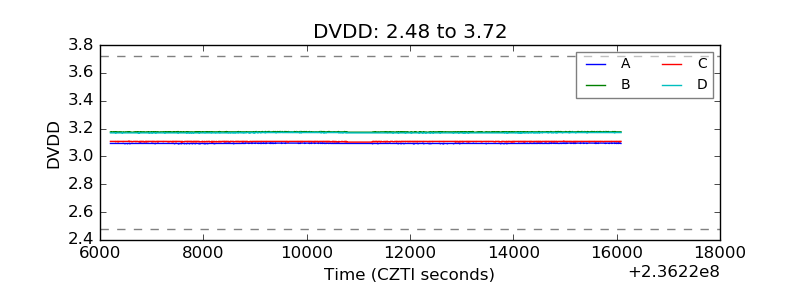 |
| Temperature 1 | 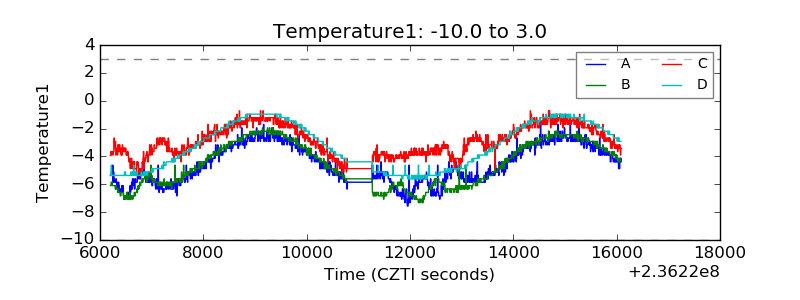 |
| Veto HV Monitor | 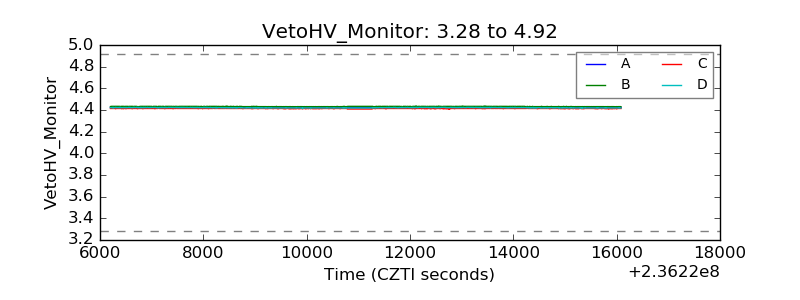 |
| Veto LLD | 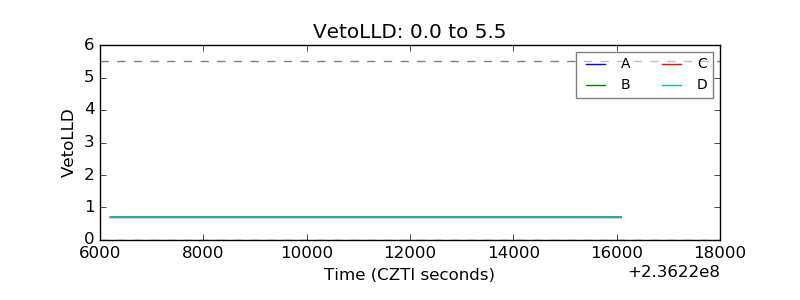 |
| Alpha Counter | 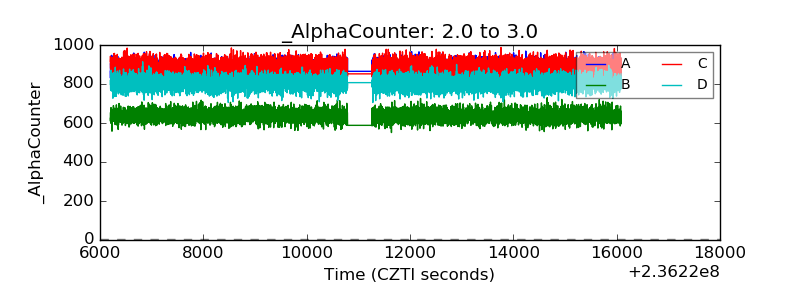 |
| _CPM_Rate | 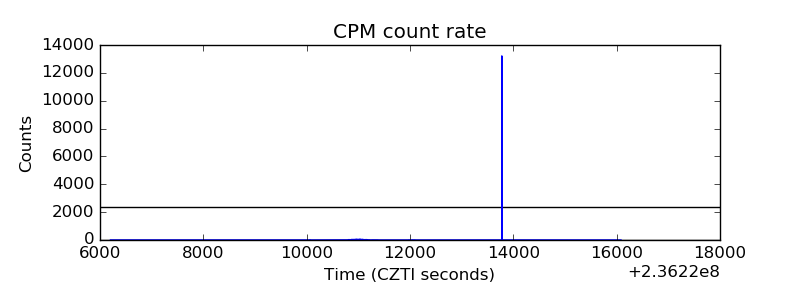 |
| CZT Counter | 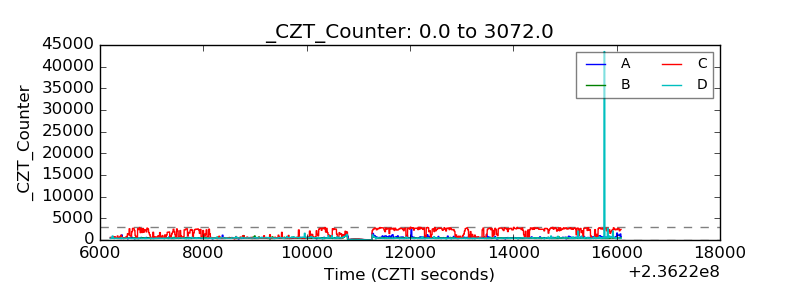 |
| +2.5 Volts monitor | 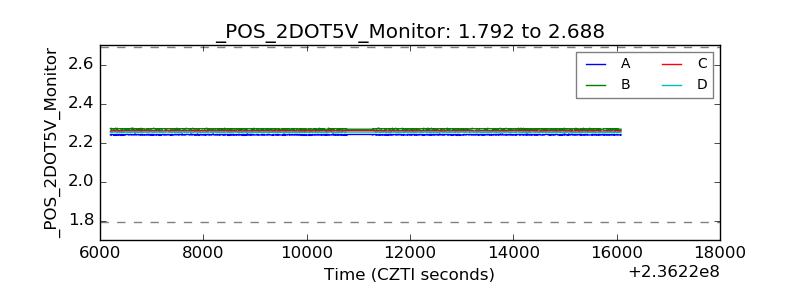 |
| +5 Volts monitor |  |
| _ROLL_ROT | 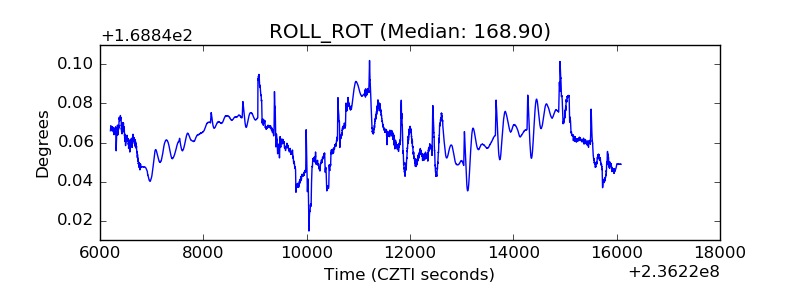 |
| _Roll_DEC | 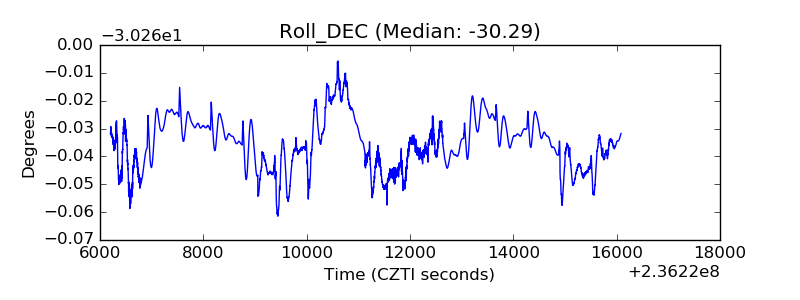 |
| _Roll_RA | 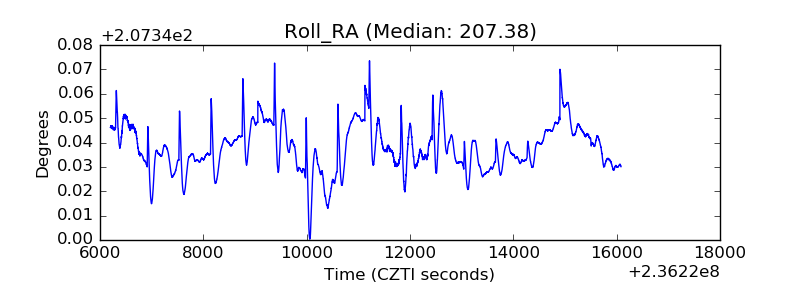 |
| Veto Counter | 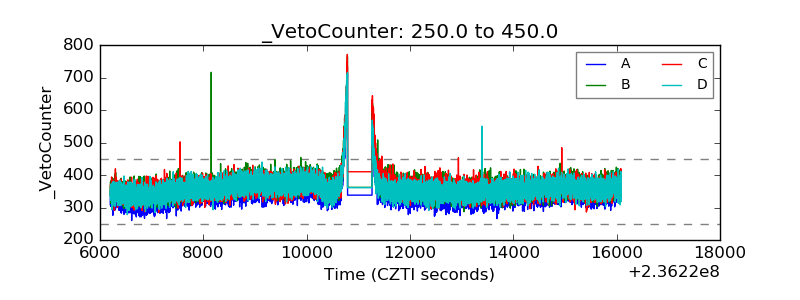 |