| Param | Original file | Final file |
|---|---|---|
| Filename | modeM0/AS1G07_030T01_9000001338cztM0_level2.fits | modeM0/AS1G07_030T01_9000001338cztM0_level2_quad_clean.evt |
| Size (bytes) | 257,777,280 | 201,349,440 |
| Size | 245.8 MB | 192.0 MB |
| Events in quadrant A | 1,635,786 | 1,178,593 |
| Events in quadrant B | 1,606,690 | 1,199,974 |
| Events in quadrant C | 1,274,304 | 813,424 |
| Events in quadrant D | 1,433,268 | 1,052,705 |
| Mode SS | |||
|---|---|---|---|
| Quadrant | BADHDUFLAG | Total packets | Discarded packets |
| A | 0 | 548 | 0 |
| B | 0 | 548 | 0 |
| C | 0 | 546 | 0 |
| D | 0 | 548 | 0 |
| Mode M0 | |||
|---|---|---|---|
| Quadrant | BADHDUFLAG | Total packets | Discarded packets |
| A | 0 | 67757 | 0 |
| B | 0 | 56602 | 0 |
| C | 0 | 114261 | 0 |
| D | 0 | 57449 | 0 |
| Mode M9 | |||
|---|---|---|---|
| Quadrant | BADHDUFLAG | Total packets | Discarded packets |
| A | 0 | 65 | 0 |
| B | 0 | 63 | 0 |
| C | 0 | 64 | 0 |
| D | 0 | 63 | 0 |
| Quadrant | Total seconds | Saturated seconds | Saturation percentage |
|---|---|---|---|
| A | 26794 | 542 | 2.022841% |
| B | 27039 | 395 | 1.460853% |
| C | 26875 | 8180 | 30.437209% |
| D | 26985 | 346 | 1.282194% |
Noise dominated data is calculated using 1-second bins in cleaned event files. If a bin has >2000 counts, and if more than 50% of those come from <1% of pixels, then it is considered to be noise-dominated and hence unusable.
| Quadrant | # 1 sec bins | Bins with >0 counts | Bins with >2000 counts | High rate bins dominated by noise | Noise dominated (total time) | Noise dominated (detector-on time) | Marked lightcurve |
|---|---|---|---|---|---|---|---|
| A | 34771 | 27818 | 0 | 0 | 0.00% | 0.00% |  |
| B | 34771 | 27934 | 0 | 0 | 0.00% | 0.00% |  |
| C | 34771 | 26707 | 0 | 0 | 0.00% | 0.00% |  |
| D | 34771 | 27881 | 0 | 0 | 0.00% | 0.00% |  |
Top three noisy pixels from each quadrant. If the there are fewer than three noisy pixels in the level2.evt file, extra rows are filled as -1
| Pixel properties | Quadrant properties | ||||||
|---|---|---|---|---|---|---|---|
| Quadrant | DetID | PixID | Counts | Sigma | Mean | Median | Sigma |
| A | 0 | 29 | 1474 | 10.06 | 426 | 399 | 106.9 |
| A | 7 | 110 | 1236 | 7.83 | 426 | 399 | 106.9 |
| A | 9 | 19 | 1232 | 7.79 | 426 | 399 | 106.9 |
| B | 2 | 9 | 1376 | 11.12 | 424 | 403 | 87.5 |
| B | 3 | 80 | 1106 | 8.03 | 424 | 403 | 87.5 |
| B | 14 | 254 | 1072 | 7.64 | 424 | 403 | 87.5 |
| C | 12 | 241 | 902 | 6.59 | 336 | 313 | 89.4 |
| C | 1 | 81 | 892 | 6.48 | 336 | 313 | 89.4 |
| C | 1 | 80 | 880 | 6.35 | 336 | 313 | 89.4 |
| D | 6 | 231 | 1062 | 6.29 | 408 | 374 | 109.4 |
| D | 3 | 14 | 1037 | 6.06 | 408 | 374 | 109.4 |
| D | 6 | 67 | 1004 | 5.76 | 408 | 374 | 109.4 |
Histogram calculated using DETX and DETY for each event in the final _common_clean file
| Quadrant A | 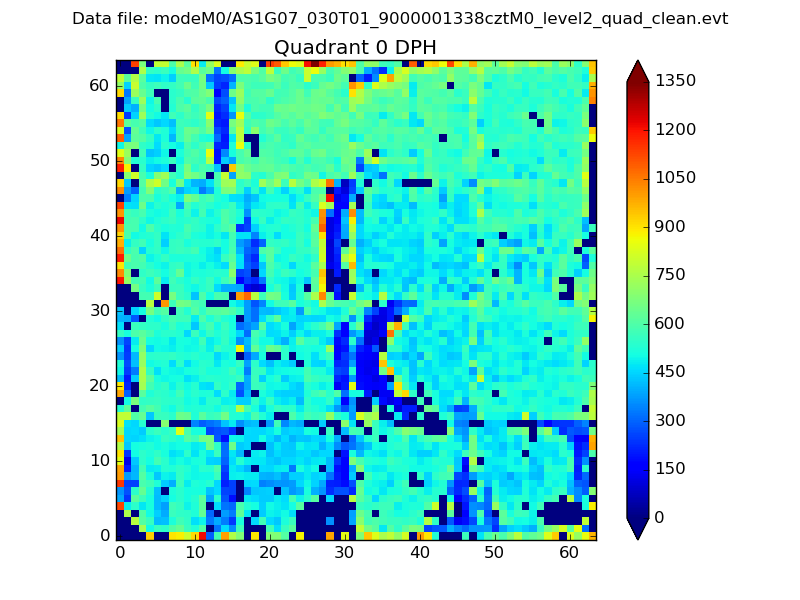 |
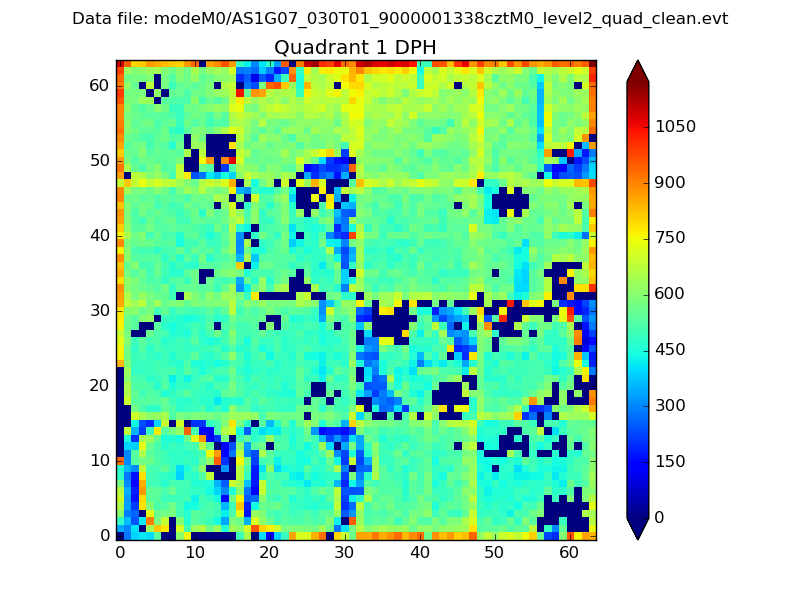 |
Quadrant B |
|---|---|---|---|
| Quadrant D |  |
 |
Quadrant C |
| Plot type | Count rate plots | Images |
|---|---|---|
| Comparison with Poisson distribution Blue bars denote a histogram of data divided into 1 sec bins. Red curve is a Poisson curve with rate = median count rate of data. |
 |
 |
| Quadrant-wise count rates Data is divided into 100 sec bins |
 |
|
| Module-wise count rates for Quadrant A Data is divided into 100 sec bins |
 |
 |
| Module-wise count rates for Quadrant B Data is divided into 100 sec bins |
 |
 |
| Module-wise count rates for Quadrant C Data is divided into 100 sec bins |
 |
 |
| Module-wise count rates for Quadrant D Data is divided into 100 sec bins |
 |
 |
| Parameter | Plot |
|---|---|
| CZT HV Monitor |  |
| D_VDD | 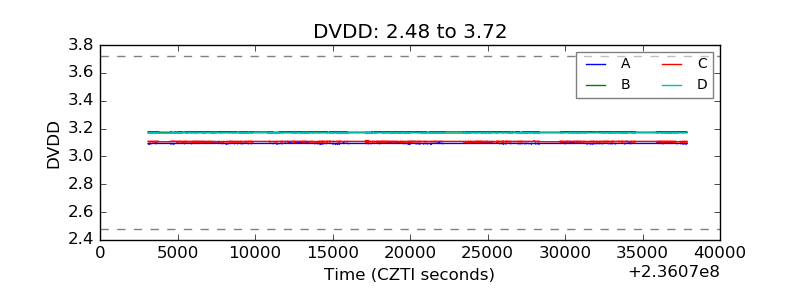 |
| Temperature 1 |  |
| Veto HV Monitor | 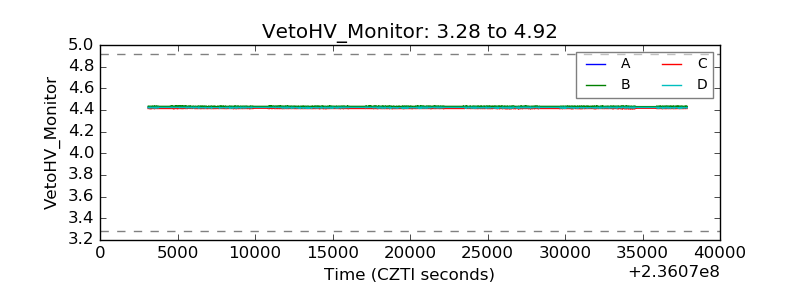 |
| Veto LLD |  |
| Alpha Counter |  |
| _CPM_Rate | 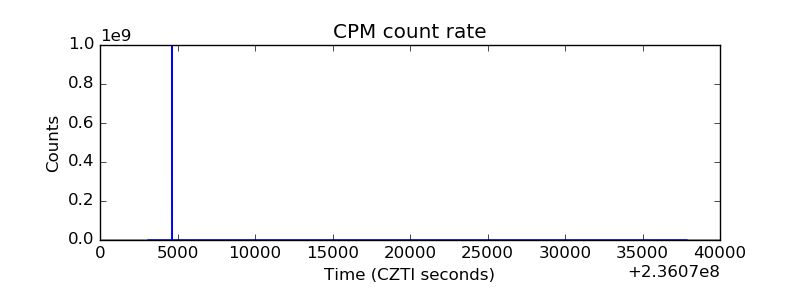 |
| CZT Counter | 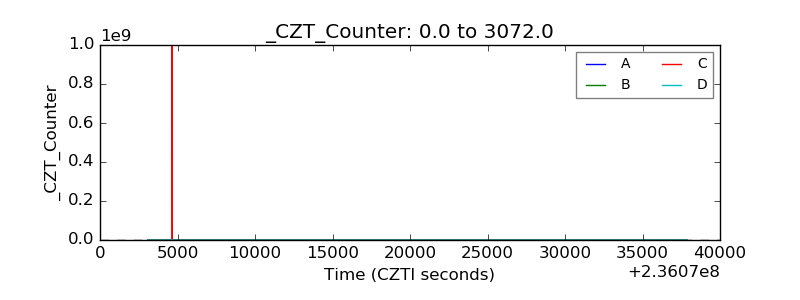 |
| +2.5 Volts monitor |  |
| +5 Volts monitor |  |
| _ROLL_ROT | 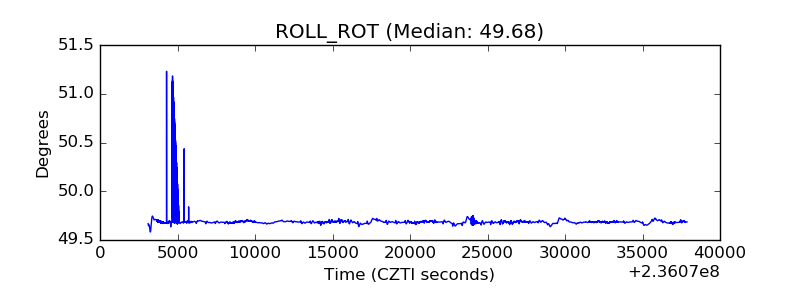 |
| _Roll_DEC |  |
| _Roll_RA |  |
| Veto Counter |  |