| Param | Original file | Final file |
|---|---|---|
| Filename | modeM0/AS1G07_030T01_9000001338_09417cztM0_level2.evt | modeM0/AS1G07_030T01_9000001338_09417cztM0_level2_quad_clean.evt |
| Size (bytes) | 471,954,240 | 68,146,560 |
| Size | 450.1 MB | 65.0 MB |
| Events in quadrant A | 4,072,562 | 407,454 |
| Events in quadrant B | 3,039,051 | 432,714 |
| Events in quadrant C | 3,574,850 | 376,748 |
| Events in quadrant D | 3,175,397 | 404,516 |
| Mode SS | |||
|---|---|---|---|
| Quadrant | BADHDUFLAG | Total packets | Discarded packets |
| A | 0 | 154 | 24 |
| B | 0 | 154 | 24 |
| C | 0 | 154 | 28 |
| D | 0 | 154 | 26 |
| Mode M0 | |||
|---|---|---|---|
| Quadrant | BADHDUFLAG | Total packets | Discarded packets |
| A | 0 | 19801 | 3626 |
| B | 0 | 15509 | 2359 |
| C | 0 | 18072 | 3151 |
| D | 0 | 16585 | 2834 |
| Mode M9 | |||
|---|---|---|---|
| Quadrant | BADHDUFLAG | Total packets | Discarded packets |
| A | 0 | 16 | 0 |
| B | 0 | 16 | 2 |
| C | 0 | 16 | 1 |
| D | 0 | 16 | 2 |
| Quadrant | Total seconds | Saturated seconds | Saturation percentage |
|---|---|---|---|
| A | 6196 | 149 | 2.404777% |
| B | 6410 | 125 | 1.950078% |
| C | 6299 | 380 | 6.032704% |
| D | 6355 | 114 | 1.793863% |
Noise dominated data is calculated using 1-second bins in cleaned event files. If a bin has >2000 counts, and if more than 50% of those come from <1% of pixels, then it is considered to be noise-dominated and hence unusable.
| Quadrant | # 1 sec bins | Bins with >0 counts | Bins with >2000 counts | High rate bins dominated by noise | Noise dominated (total time) | Noise dominated (detector-on time) | Marked lightcurve |
|---|---|---|---|---|---|---|---|
| A | 9207 | 7137 | 6 | 6 | 0.07% | 0.08% | 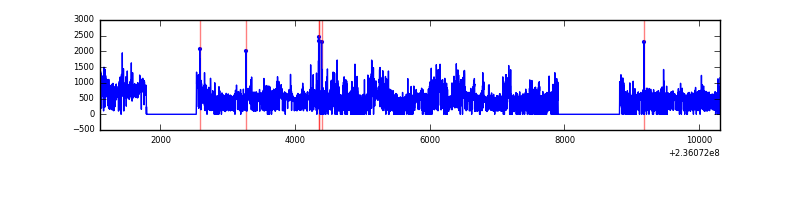 |
| B | 9207 | 7242 | 0 | 0 | 0.00% | 0.00% | 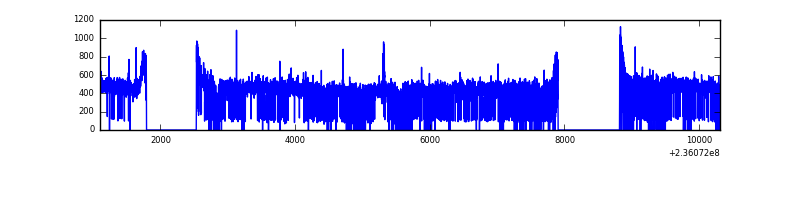 |
| C | 9207 | 7161 | 129 | 129 | 1.40% | 1.80% | 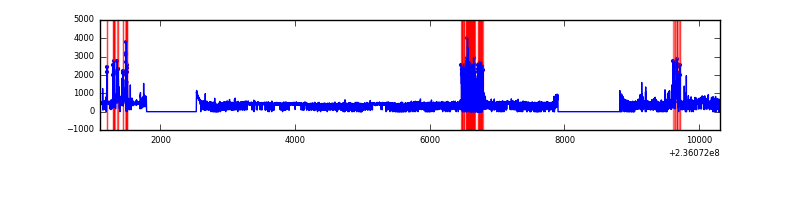 |
| D | 9207 | 7190 | 17 | 17 | 0.18% | 0.24% | 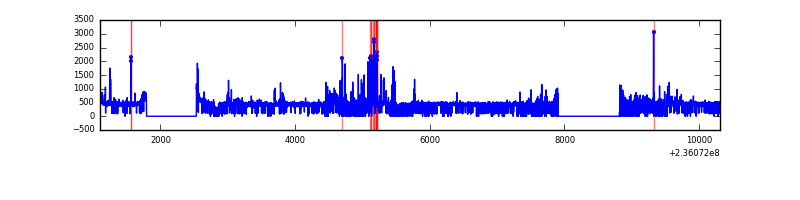 |
Top three noisy pixels from each quadrant. If the there are fewer than three noisy pixels in the level2.evt file, extra rows are filled as -1
| Pixel properties | Quadrant properties | ||||||
|---|---|---|---|---|---|---|---|
| Quadrant | DetID | PixID | Counts | Sigma | Mean | Median | Sigma |
| A | 8 | 5 | 1052499 | 6869.23 | 745 | 728 | 153.1 |
| A | 4 | 2 | 72548 | 469.06 | 745 | 728 | 153.1 |
| A | 1 | 162 | 36948 | 236.56 | 745 | 728 | 153.1 |
| B | 12 | 111 | 17496 | 110.54 | 776 | 757 | 151.4 |
| B | 11 | 111 | 14017 | 87.56 | 776 | 757 | 151.4 |
| B | 14 | 111 | 10784 | 66.21 | 776 | 757 | 151.4 |
| C | 4 | 254 | 781673 | 4724.35 | 706 | 709 | 165.3 |
| C | 10 | 22 | 28687 | 169.25 | 706 | 709 | 165.3 |
| C | 13 | 61 | 5264 | 27.55 | 706 | 709 | 165.3 |
| D | 1 | 52 | 247013 | 1310.77 | 735 | 716 | 187.9 |
| D | 8 | 195 | 45945 | 240.7 | 735 | 716 | 187.9 |
| D | 10 | 172 | 28069 | 145.57 | 735 | 716 | 187.9 |
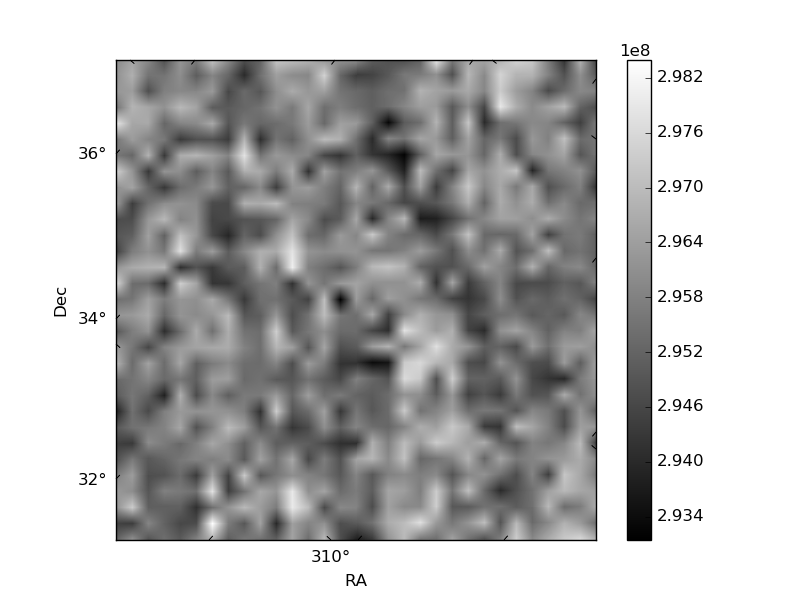
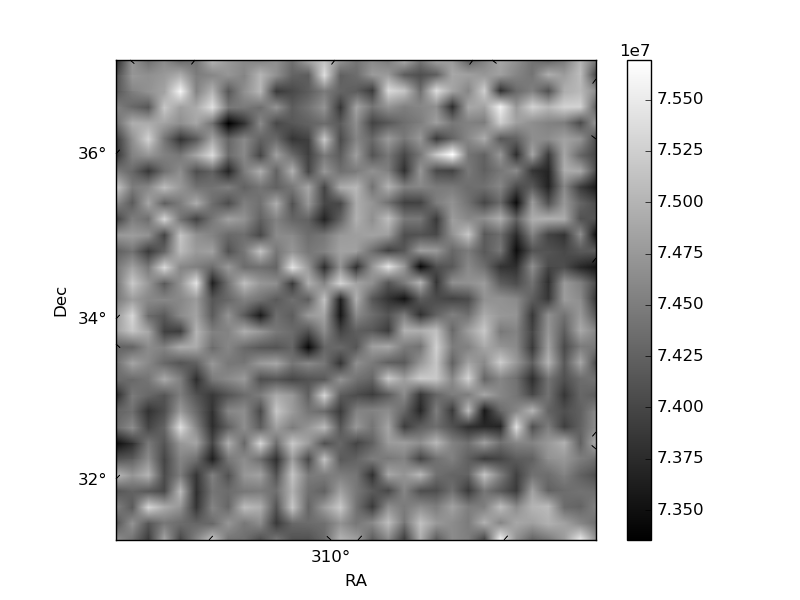
Histogram calculated using DETX and DETY for each event in the final _common_clean file
| Quadrant A | 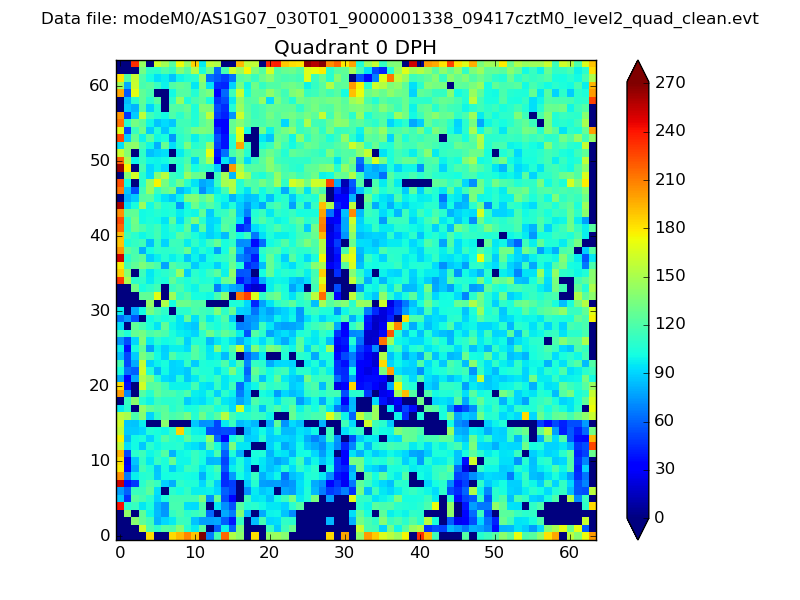 |
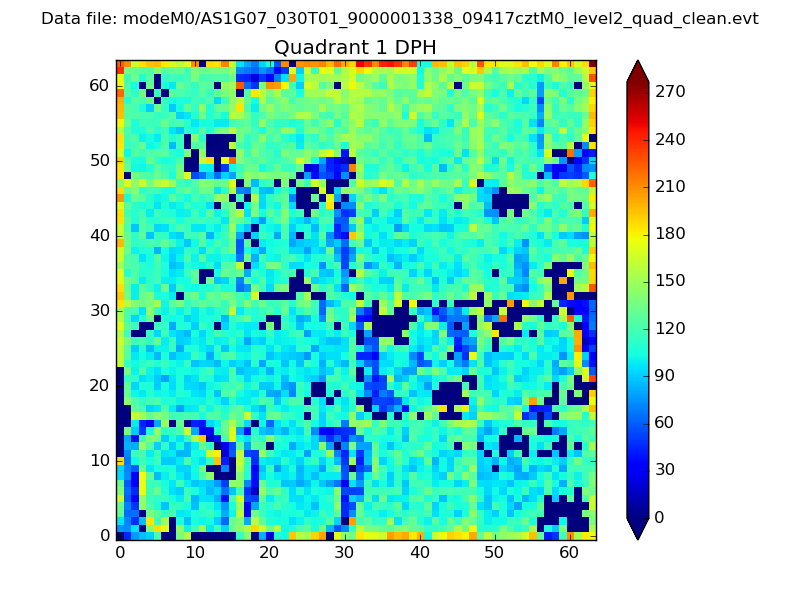 |
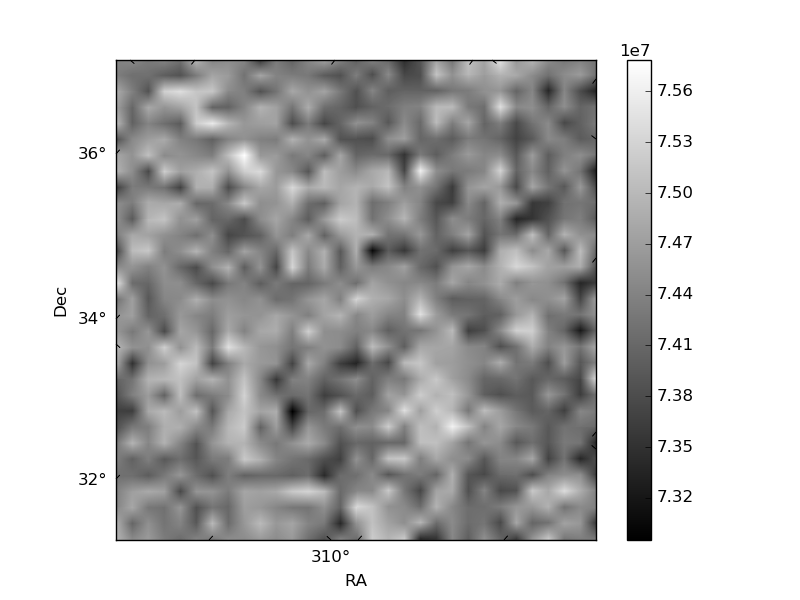
Quadrant B |
|---|---|---|---|
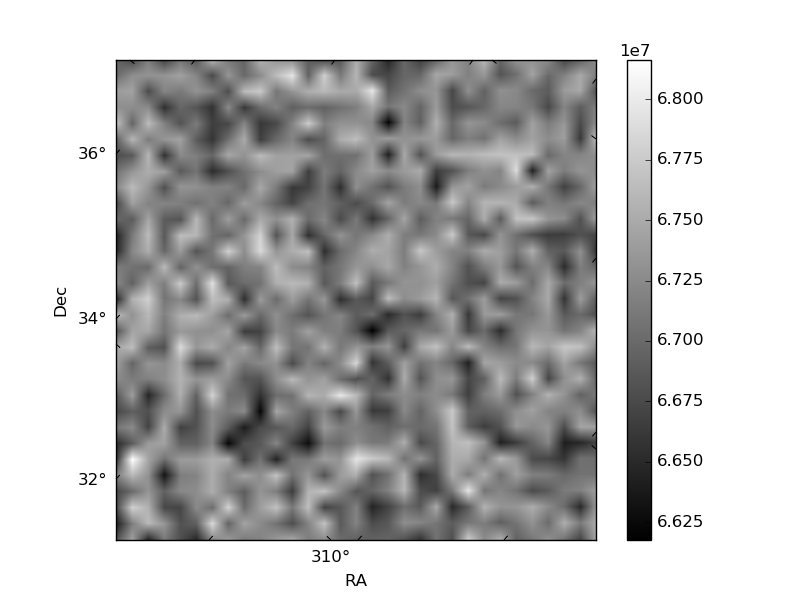
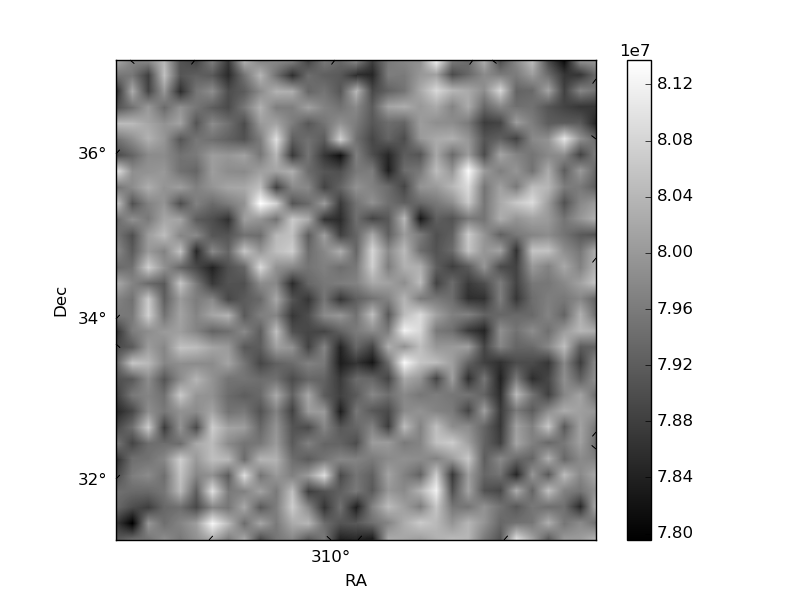
| Quadrant D | 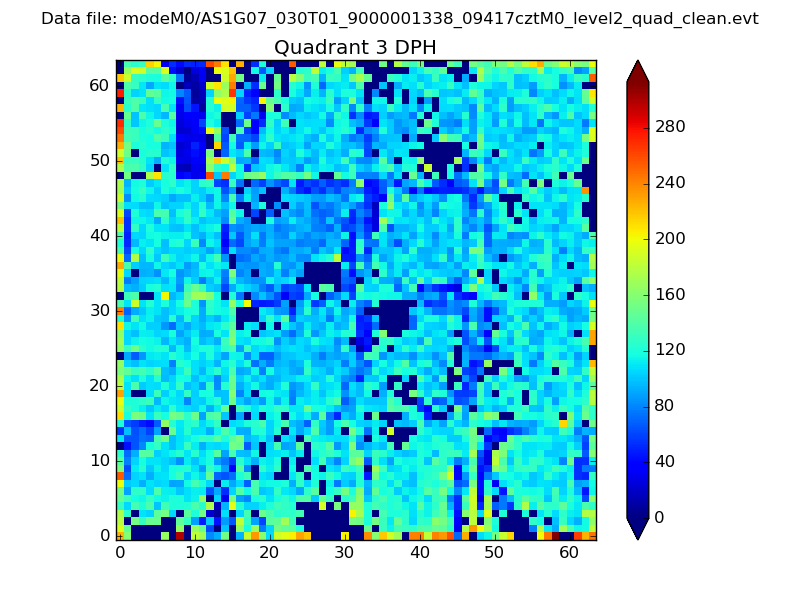 |
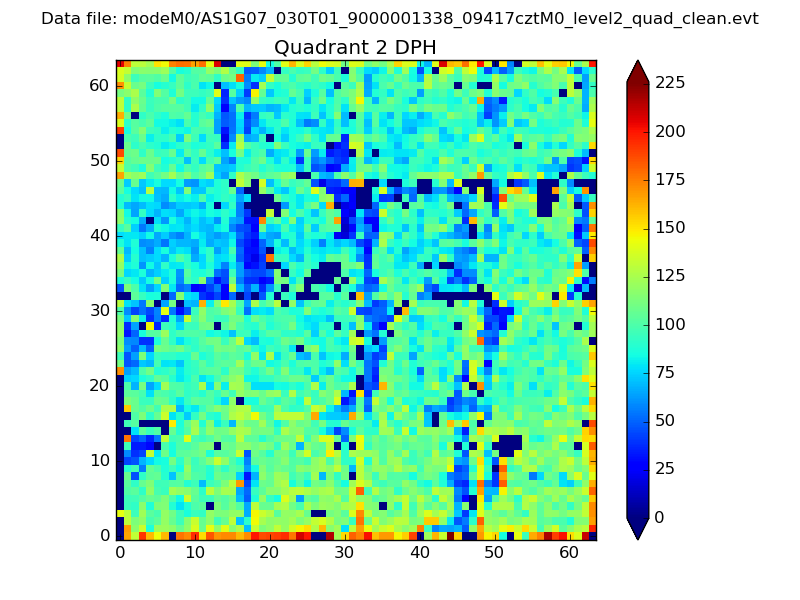 |
Quadrant C |
| Plot type | Count rate plots | Images |
|---|---|---|
| Comparison with Poisson distribution Blue bars denote a histogram of data divided into 1 sec bins. Red curve is a Poisson curve with rate = median count rate of data. |
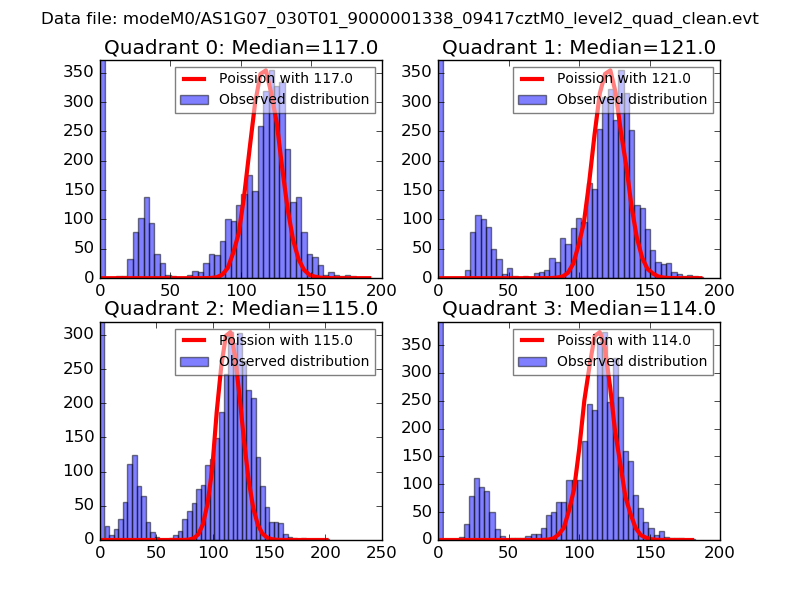 |
 |
| Quadrant-wise count rates Data is divided into 100 sec bins |
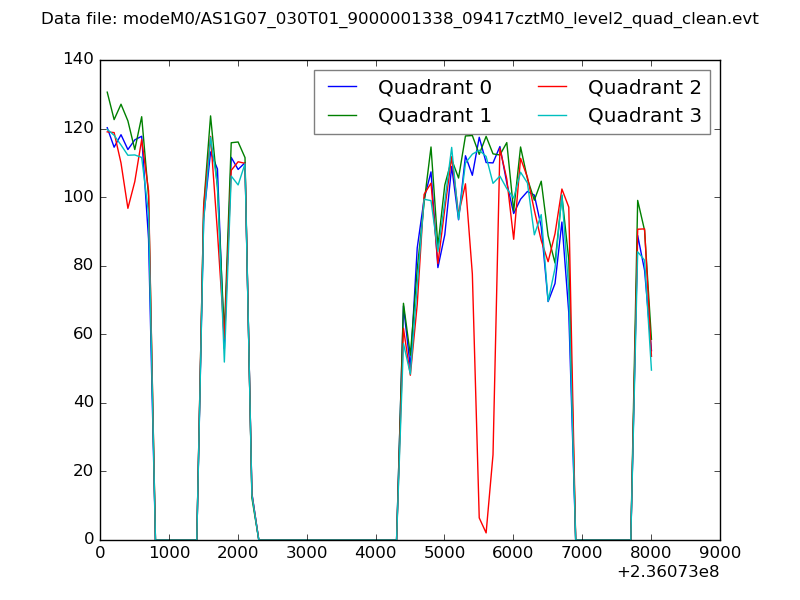 |
|
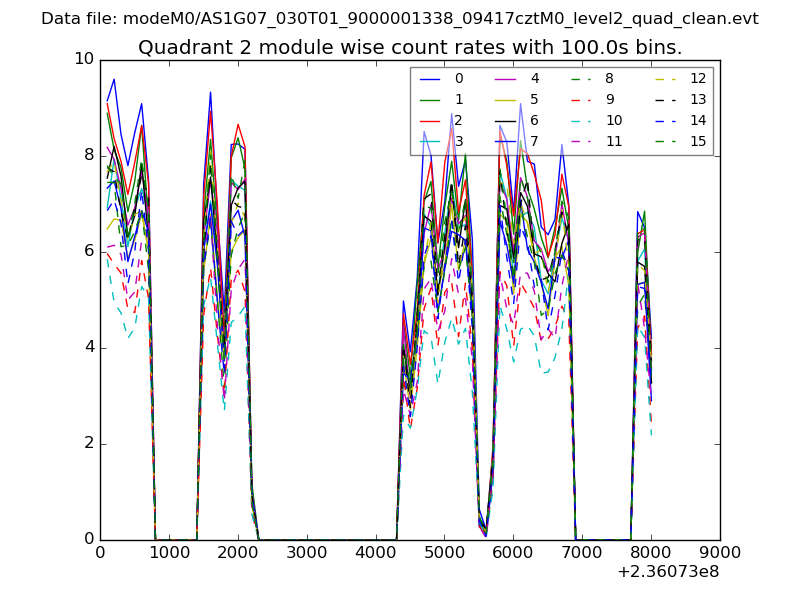
| Module-wise count rates for Quadrant A Data is divided into 100 sec bins |
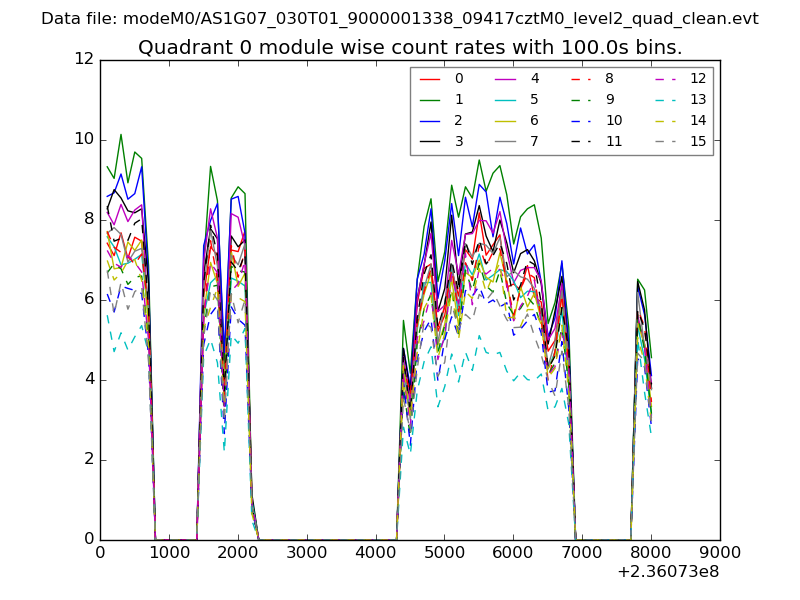 |
 |
| Module-wise count rates for Quadrant B Data is divided into 100 sec bins |
 |
 |
| Module-wise count rates for Quadrant C Data is divided into 100 sec bins |
 |
 |
| Module-wise count rates for Quadrant D Data is divided into 100 sec bins |
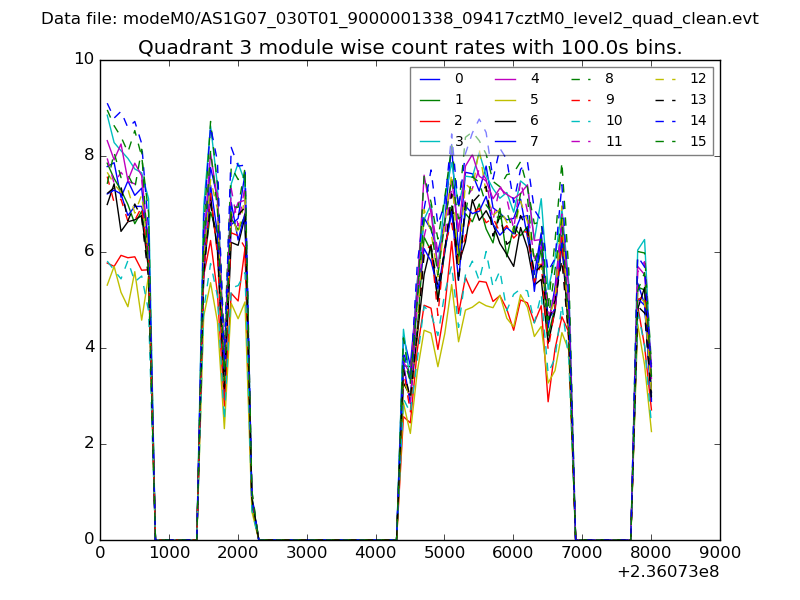 |
 |
| Parameter | Plot |
|---|---|
| CZT HV Monitor | 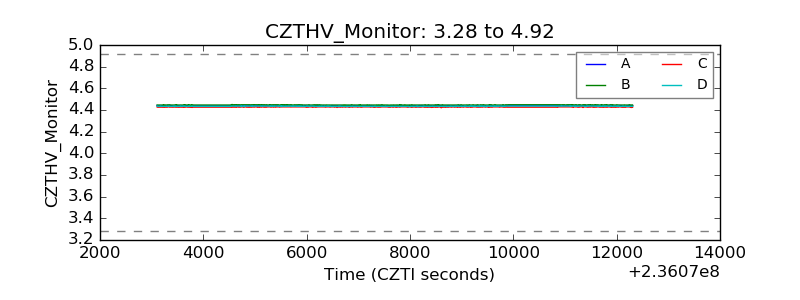 |
| D_VDD | 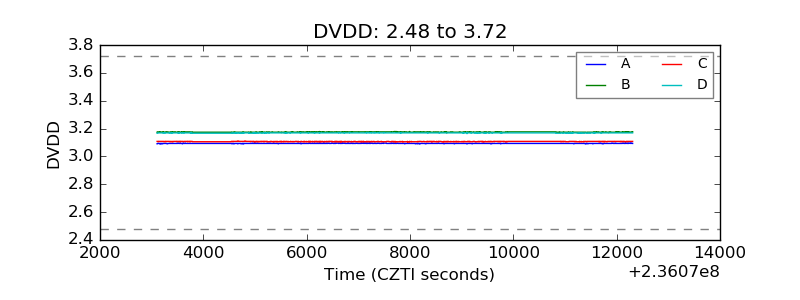 |
| Temperature 1 | 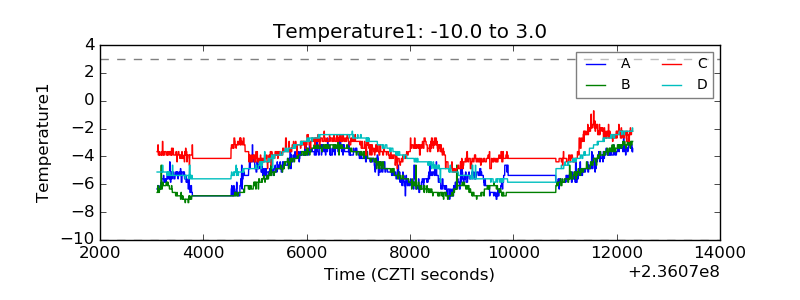 |
| Veto HV Monitor | 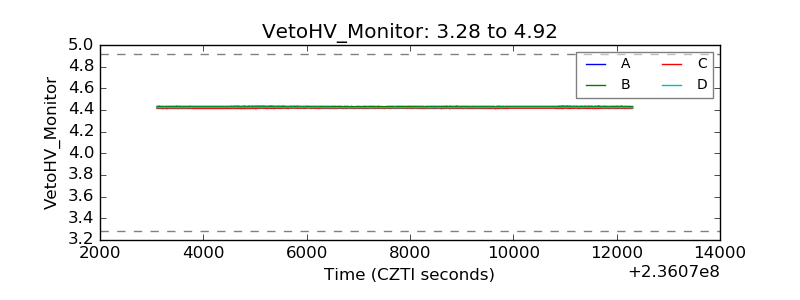 |
| Veto LLD | 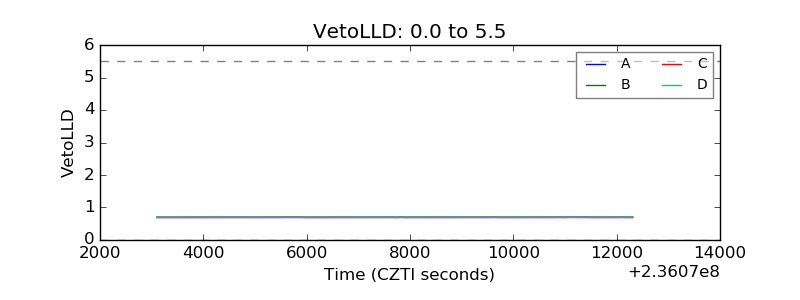 |
| Alpha Counter | 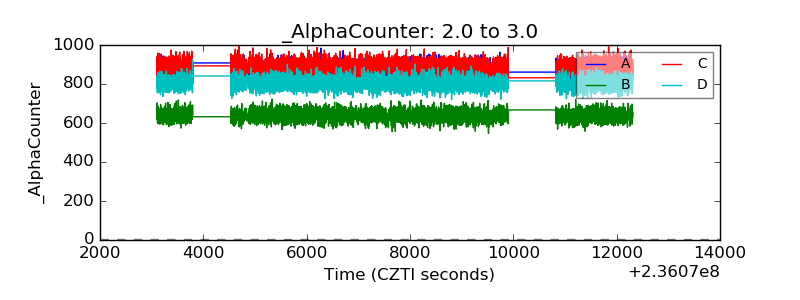 |
| _CPM_Rate | 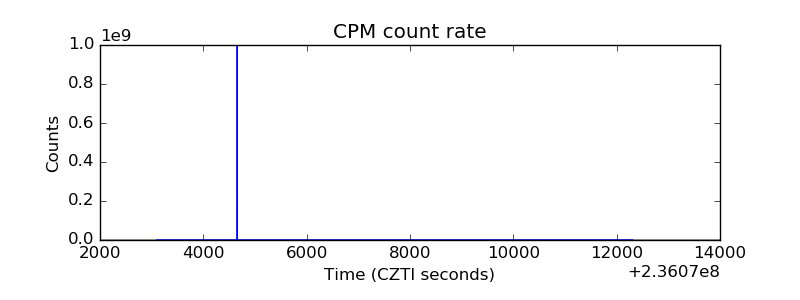 |
| CZT Counter | 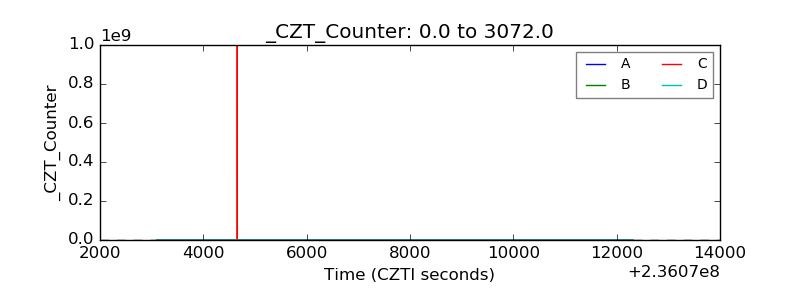 |
| +2.5 Volts monitor |  |
| +5 Volts monitor |  |
| _ROLL_ROT | 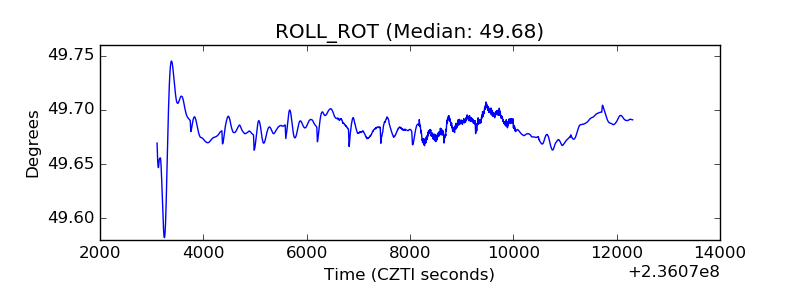 |
| _Roll_DEC | 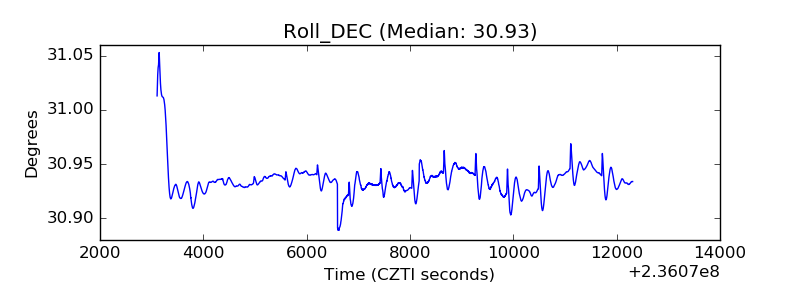 |
| _Roll_RA | 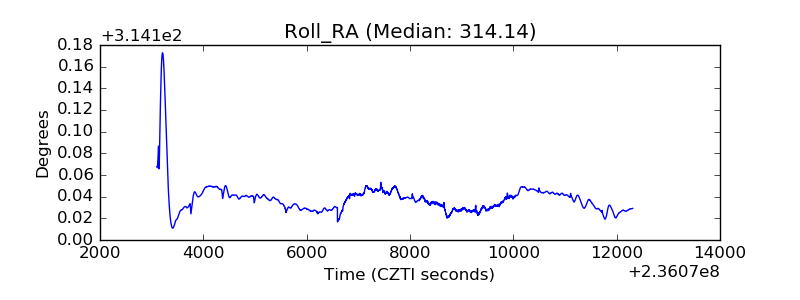 |
| Veto Counter | 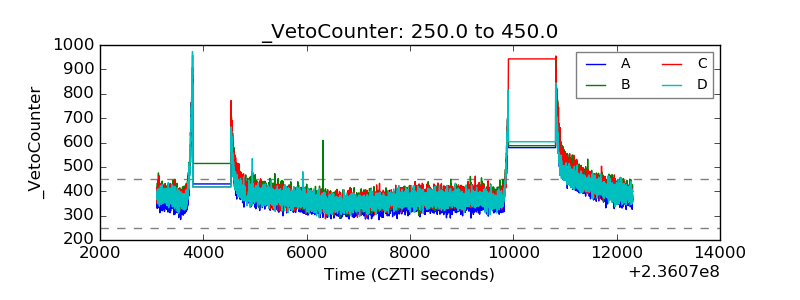 |