| Param | Original file | Final file |
|---|---|---|
| Filename | modeM0/AS1G07_030T01_9000001338_09418cztM0_level2.evt | modeM0/AS1G07_030T01_9000001338_09418cztM0_level2_quad_clean.evt |
| Size (bytes) | 591,312,960 | 62,858,880 |
| Size | 563.9 MB | 59.9 MB |
| Events in quadrant A | 3,959,716 | 371,860 |
| Events in quadrant B | 3,091,267 | 381,115 |
| Events in quadrant C | 7,334,034 | 346,861 |
| Events in quadrant D | 3,094,931 | 362,834 |
| Mode SS | |||
|---|---|---|---|
| Quadrant | BADHDUFLAG | Total packets | Discarded packets |
| A | 0 | 132 | 6 |
| B | 0 | 132 | 4 |
| C | 0 | 132 | 2 |
| D | 0 | 132 | 0 |
| Mode M0 | |||
|---|---|---|---|
| Quadrant | BADHDUFLAG | Total packets | Discarded packets |
| A | 0 | 16705 | 794 |
| B | 0 | 13674 | 467 |
| C | 0 | 27084 | 1040 |
| D | 0 | 14023 | 567 |
| Mode M9 | |||
|---|---|---|---|
| Quadrant | BADHDUFLAG | Total packets | Discarded packets |
| A | 0 | 13 | 0 |
| B | 0 | 13 | 0 |
| C | 0 | 13 | 1 |
| D | 0 | 14 | 0 |
| Quadrant | Total seconds | Saturated seconds | Saturation percentage |
|---|---|---|---|
| A | 6272 | 152 | 2.423469% |
| B | 6356 | 87 | 1.368785% |
| C | 6272 | 1367 | 21.795281% |
| D | 6333 | 82 | 1.294805% |
Noise dominated data is calculated using 1-second bins in cleaned event files. If a bin has >2000 counts, and if more than 50% of those come from <1% of pixels, then it is considered to be noise-dominated and hence unusable.
| Quadrant | # 1 sec bins | Bins with >0 counts | Bins with >2000 counts | High rate bins dominated by noise | Noise dominated (total time) | Noise dominated (detector-on time) | Marked lightcurve |
|---|---|---|---|---|---|---|---|
| A | 7632 | 6528 | 31 | 31 | 0.41% | 0.47% | 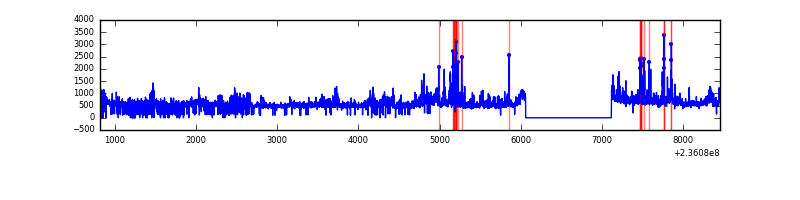 |
| B | 7629 | 6553 | 1 | 1 | 0.01% | 0.02% | 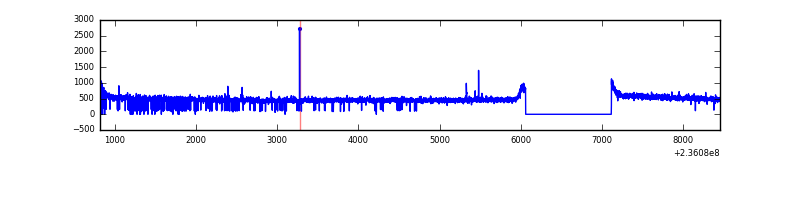 |
| C | 7632 | 6534 | 1047 | 1047 | 13.72% | 16.02% | 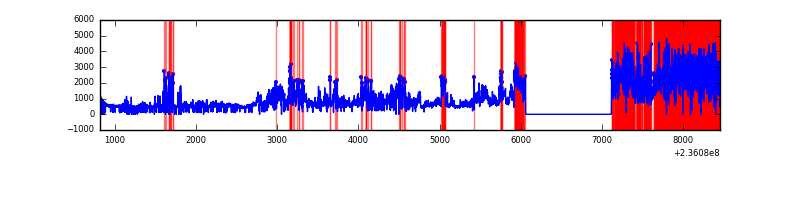 |
| D | 7632 | 6539 | 10 | 10 | 0.13% | 0.15% | 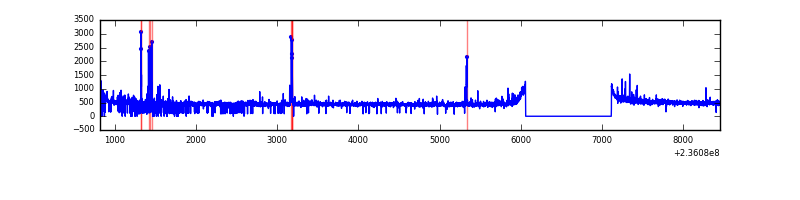 |
Top three noisy pixels from each quadrant. If the there are fewer than three noisy pixels in the level2.evt file, extra rows are filled as -1
| Pixel properties | Quadrant properties | ||||||
|---|---|---|---|---|---|---|---|
| Quadrant | DetID | PixID | Counts | Sigma | Mean | Median | Sigma |
| A | 8 | 5 | 798677 | 5050.41 | 779 | 762 | 158.0 |
| A | 4 | 2 | 137991 | 868.59 | 779 | 762 | 158.0 |
| A | 1 | 162 | 14638 | 87.83 | 779 | 762 | 158.0 |
| B | 12 | 111 | 17349 | 108.52 | 791 | 773 | 152.7 |
| B | 11 | 111 | 14267 | 88.34 | 791 | 773 | 152.7 |
| B | 8 | 234 | 12907 | 79.44 | 791 | 773 | 152.7 |
| C | 4 | 254 | 4724990 | 30943.73 | 659 | 662 | 152.7 |
| C | 10 | 22 | 21904 | 139.13 | 659 | 662 | 152.7 |
| C | 9 | 68 | 8785 | 53.2 | 659 | 662 | 152.7 |
| D | 10 | 172 | 76851 | 394.86 | 757 | 739 | 192.8 |
| D | 8 | 195 | 49291 | 251.88 | 757 | 739 | 192.8 |
| D | 2 | 136 | 40719 | 207.41 | 757 | 739 | 192.8 |
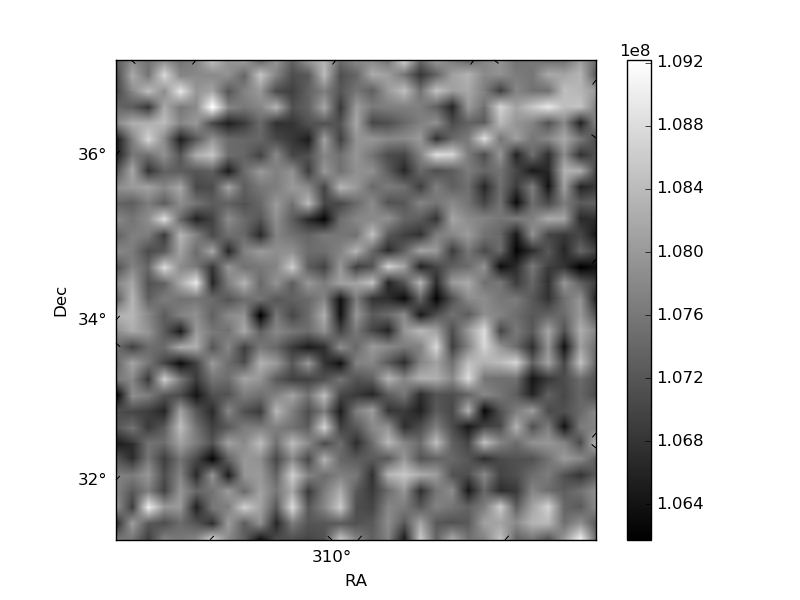
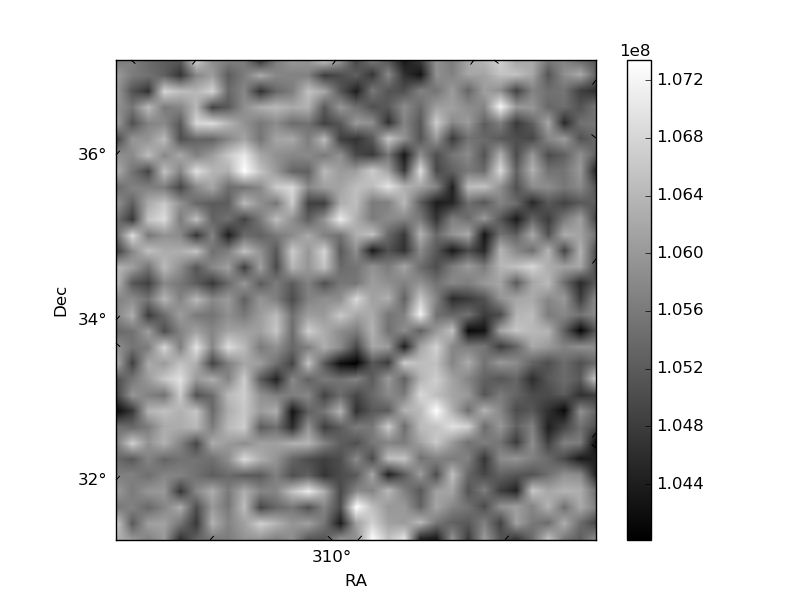
Histogram calculated using DETX and DETY for each event in the final _common_clean file
| Quadrant A |  |
 |
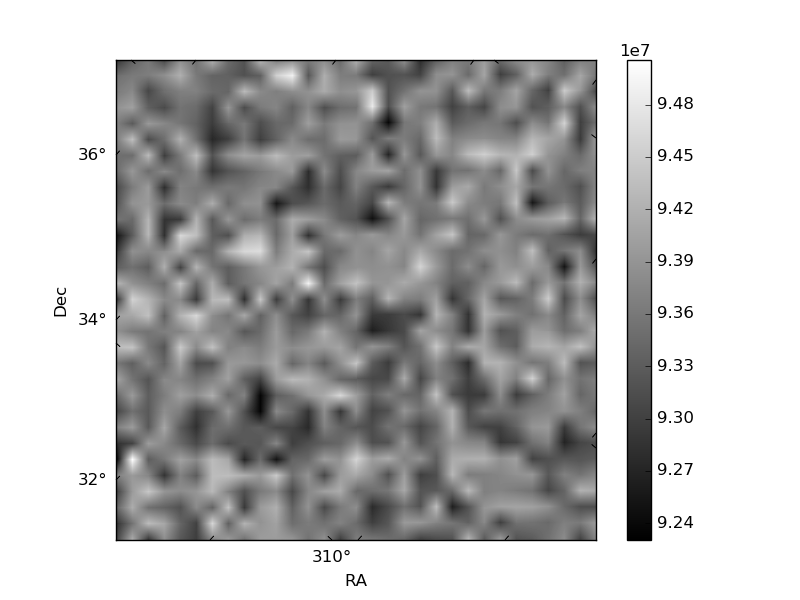
Quadrant B |
|---|---|---|---|
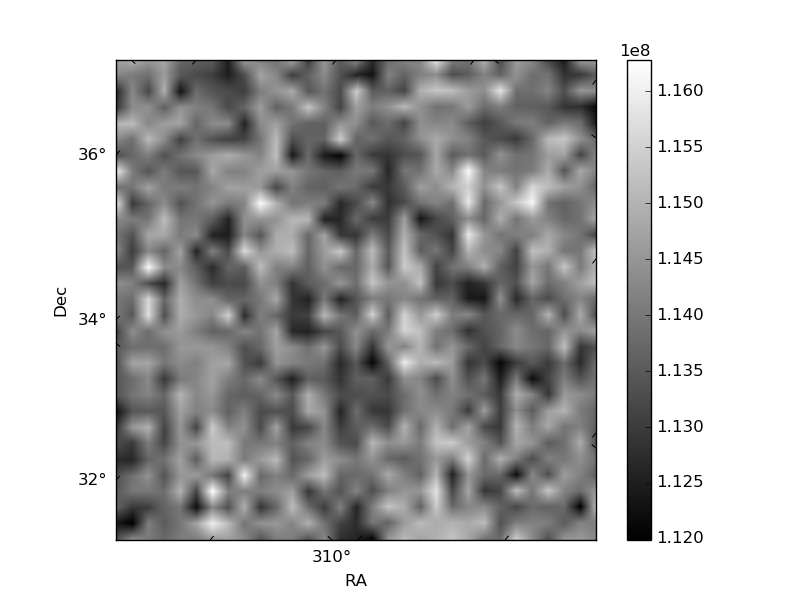
| Quadrant D |  |
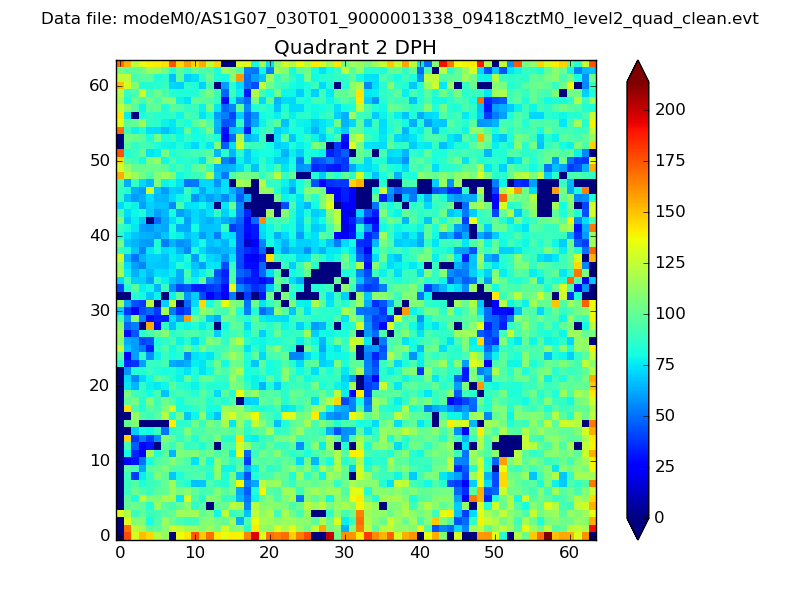 |
Quadrant C |
| Plot type | Count rate plots | Images |
|---|---|---|
| Comparison with Poisson distribution Blue bars denote a histogram of data divided into 1 sec bins. Red curve is a Poisson curve with rate = median count rate of data. |
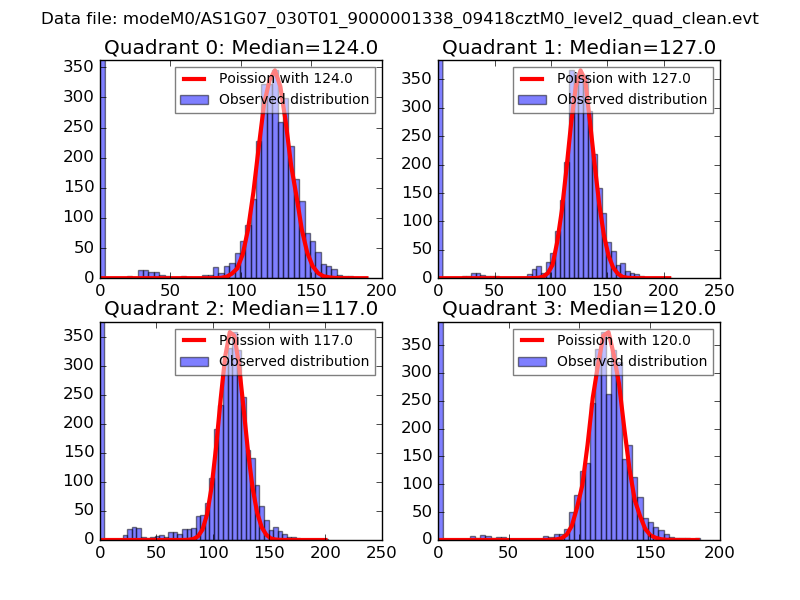 |
 |
| Quadrant-wise count rates Data is divided into 100 sec bins |
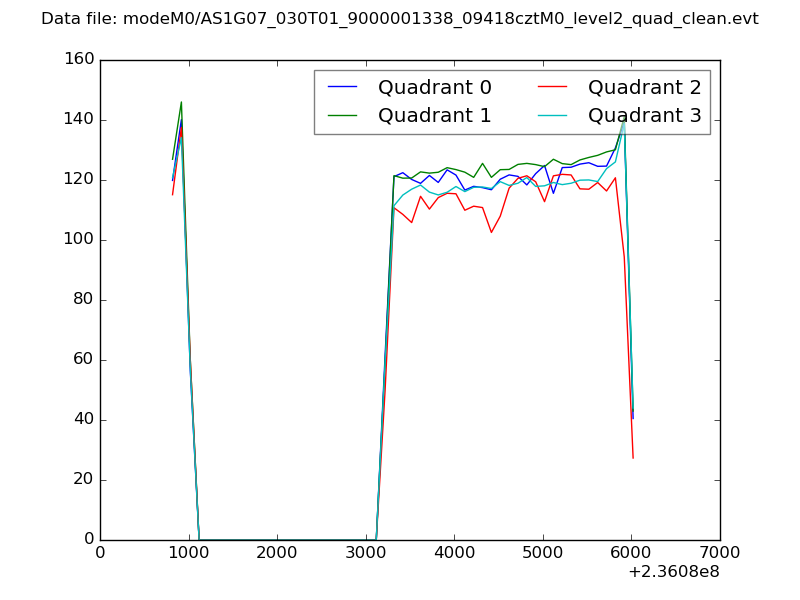 |
|
| Module-wise count rates for Quadrant A Data is divided into 100 sec bins |
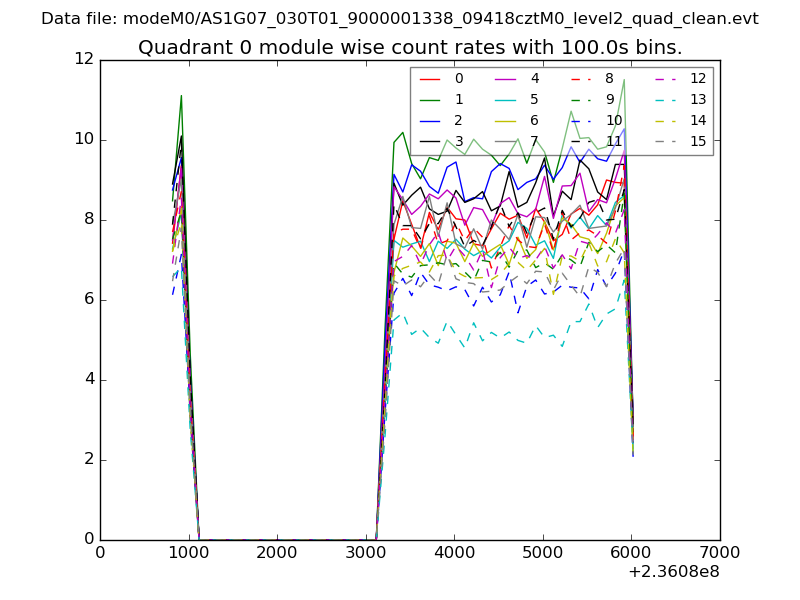 |
 |
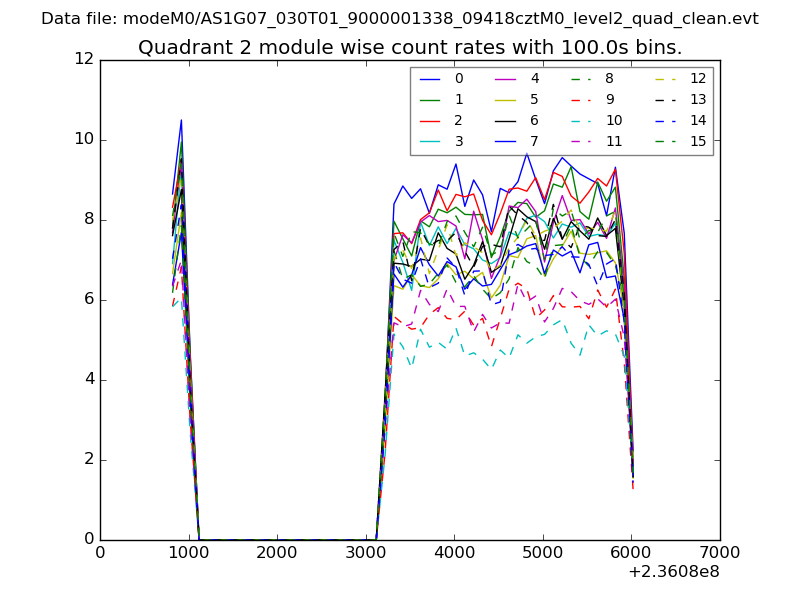
| Module-wise count rates for Quadrant B Data is divided into 100 sec bins |
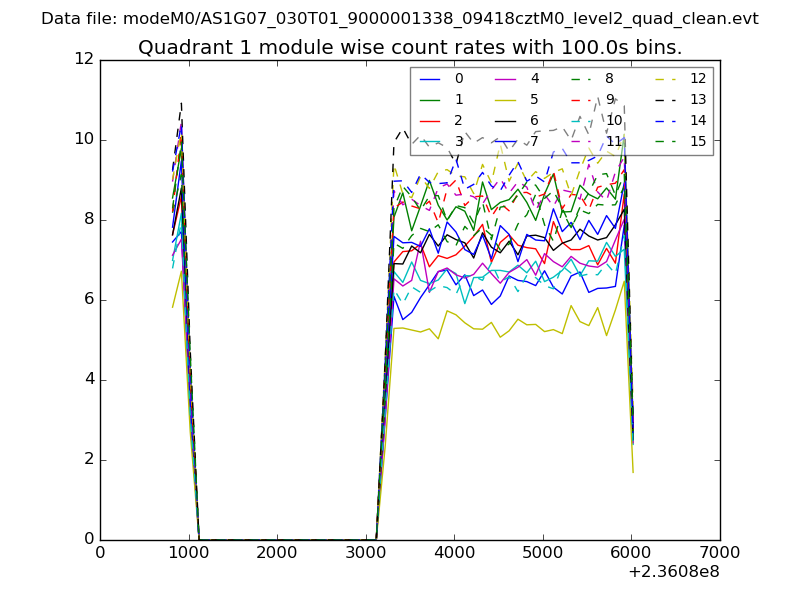 |
 |
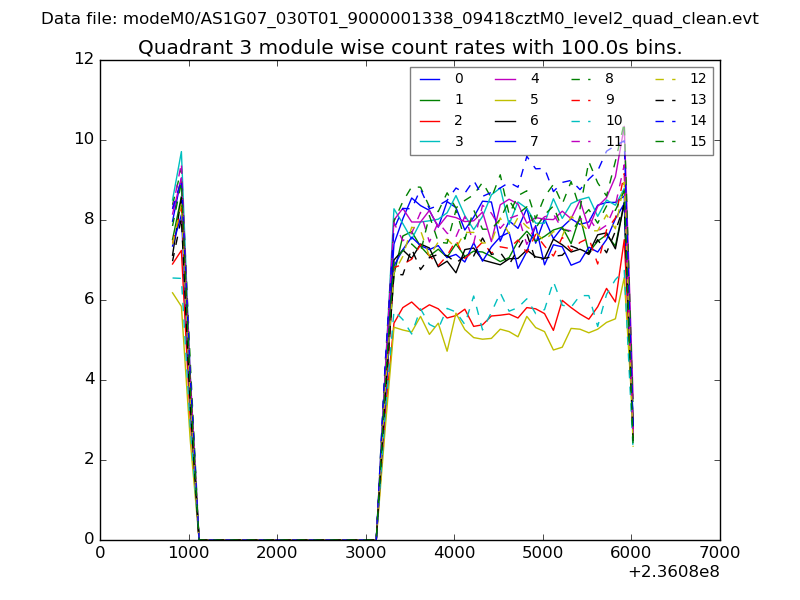
| Module-wise count rates for Quadrant C Data is divided into 100 sec bins |
 |
 |
| Module-wise count rates for Quadrant D Data is divided into 100 sec bins |
 |
 |
| Parameter | Plot |
|---|---|
| CZT HV Monitor | 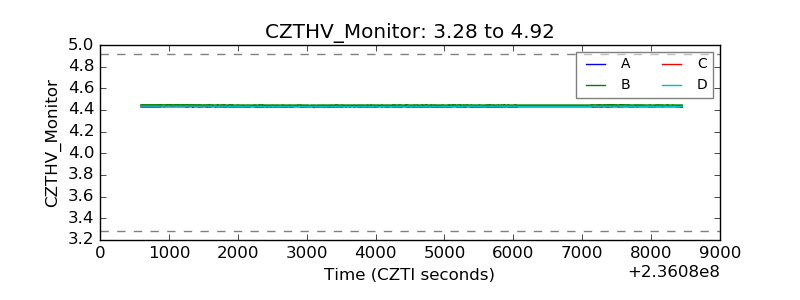 |
| D_VDD | 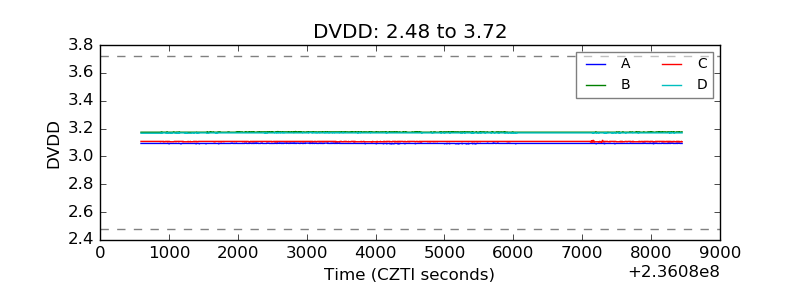 |
| Temperature 1 | 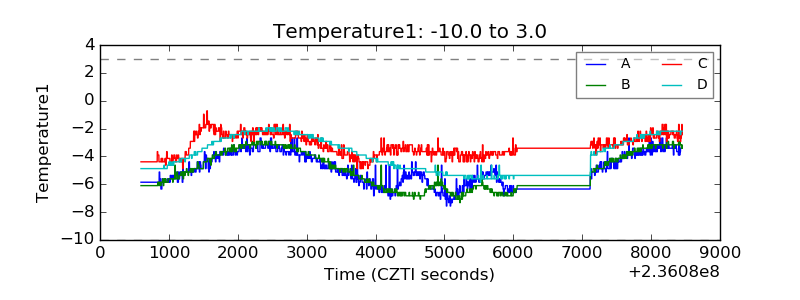 |
| Veto HV Monitor | 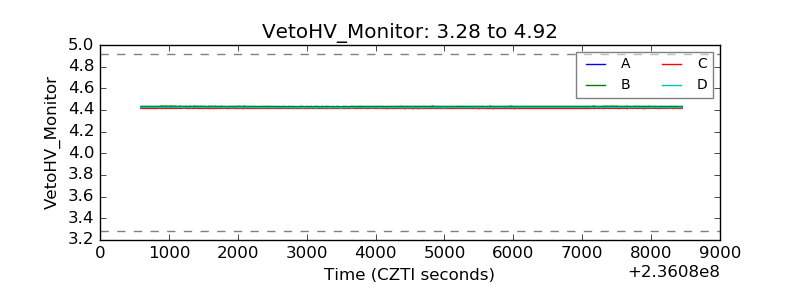 |
| Veto LLD | 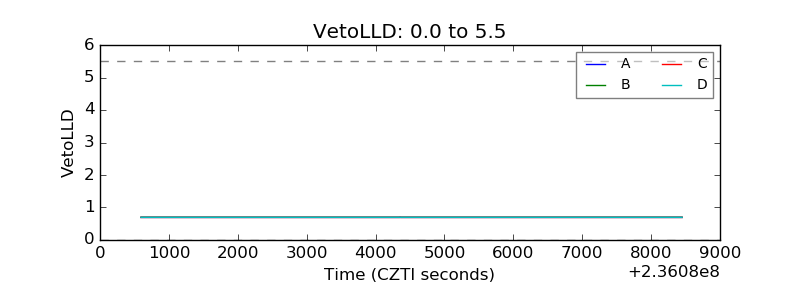 |
| Alpha Counter | 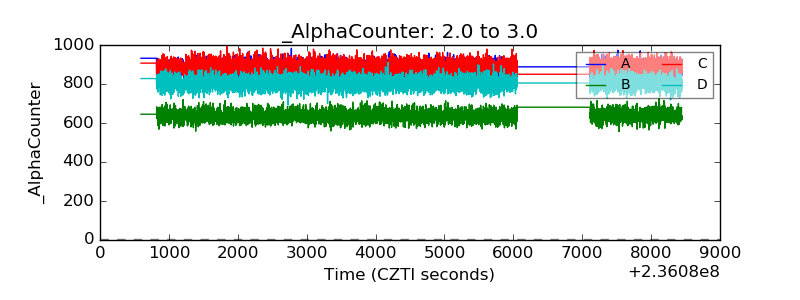 |
| _CPM_Rate | 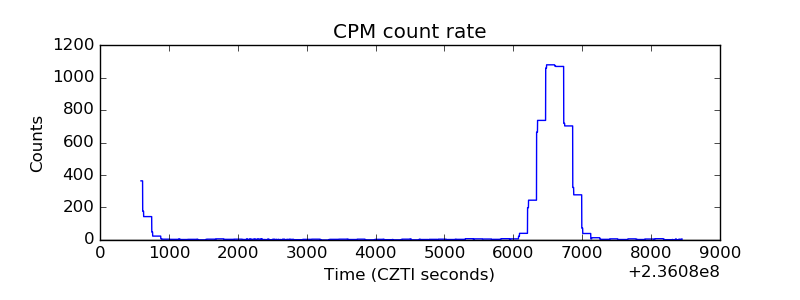 |
| CZT Counter | 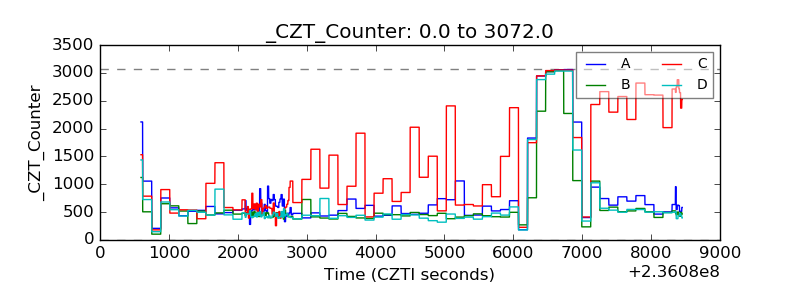 |
| +2.5 Volts monitor |  |
| +5 Volts monitor |  |
| _ROLL_ROT | 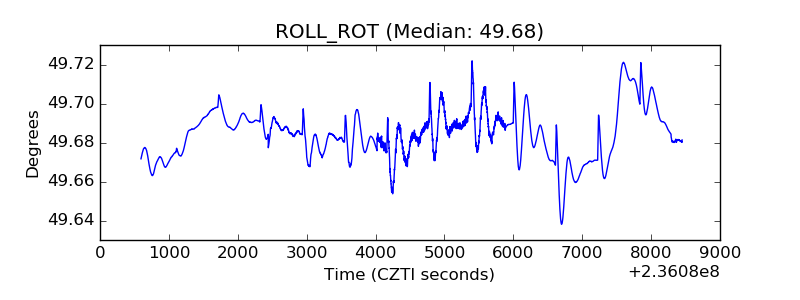 |
| _Roll_DEC | 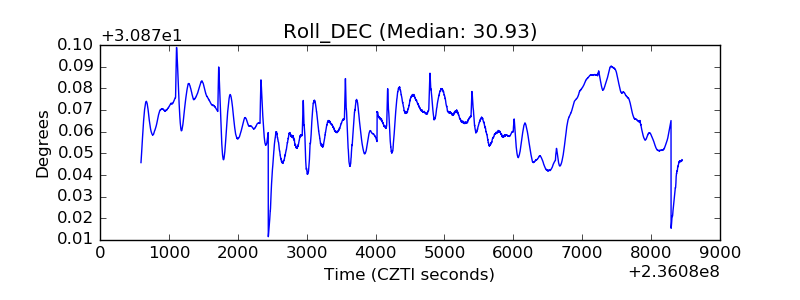 |
| _Roll_RA | 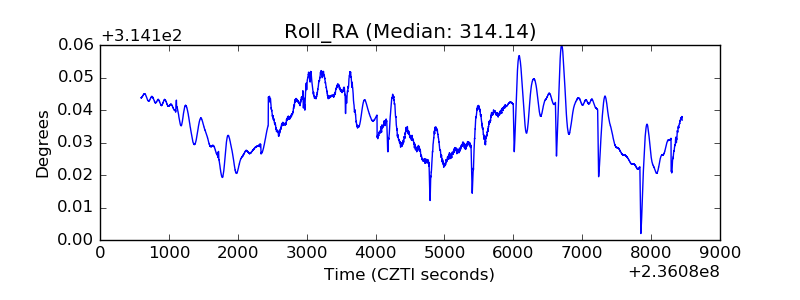 |
| Veto Counter | 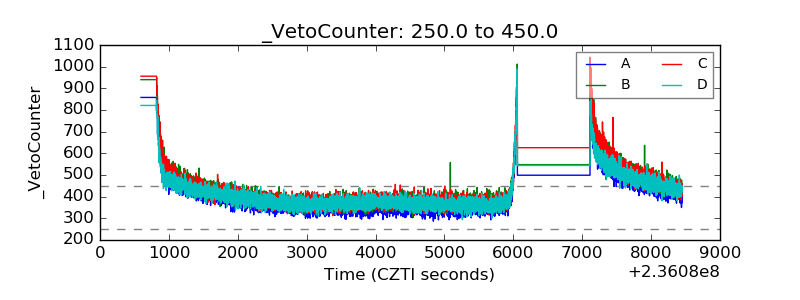 |