| Param | Original file | Final file |
|---|---|---|
| Filename | modeM0/AS1G07_030T01_9000001338_09420cztM0_level2.evt | modeM0/AS1G07_030T01_9000001338_09420cztM0_level2_quad_clean.evt |
| Size (bytes) | 654,739,200 | 65,292,480 |
| Size | 624.4 MB | 62.3 MB |
| Events in quadrant A | 4,291,514 | 398,501 |
| Events in quadrant B | 3,176,801 | 403,872 |
| Events in quadrant C | 8,770,962 | 345,313 |
| Events in quadrant D | 3,158,238 | 384,534 |
| Mode SS | |||
|---|---|---|---|
| Quadrant | BADHDUFLAG | Total packets | Discarded packets |
| A | 0 | 130 | 0 |
| B | 0 | 130 | 0 |
| C | 0 | 130 | 0 |
| D | 0 | 130 | 0 |
| Mode M0 | |||
|---|---|---|---|
| Quadrant | BADHDUFLAG | Total packets | Discarded packets |
| A | 0 | 17294 | 61 |
| B | 0 | 13531 | 39 |
| C | 0 | 30317 | 47 |
| D | 0 | 13497 | 44 |
| Mode M9 | |||
|---|---|---|---|
| Quadrant | BADHDUFLAG | Total packets | Discarded packets |
| A | 0 | 12 | 0 |
| B | 0 | 12 | 0 |
| C | 0 | 12 | 0 |
| D | 0 | 12 | 0 |
| Quadrant | Total seconds | Saturated seconds | Saturation percentage |
|---|---|---|---|
| A | 6362 | 115 | 1.807608% |
| B | 6367 | 57 | 0.895241% |
| C | 6366 | 2447 | 38.438580% |
| D | 6363 | 47 | 0.738645% |
Noise dominated data is calculated using 1-second bins in cleaned event files. If a bin has >2000 counts, and if more than 50% of those come from <1% of pixels, then it is considered to be noise-dominated and hence unusable.
| Quadrant | # 1 sec bins | Bins with >0 counts | Bins with >2000 counts | High rate bins dominated by noise | Noise dominated (total time) | Noise dominated (detector-on time) | Marked lightcurve |
|---|---|---|---|---|---|---|---|
| A | 7602 | 6383 | 22 | 22 | 0.29% | 0.34% | 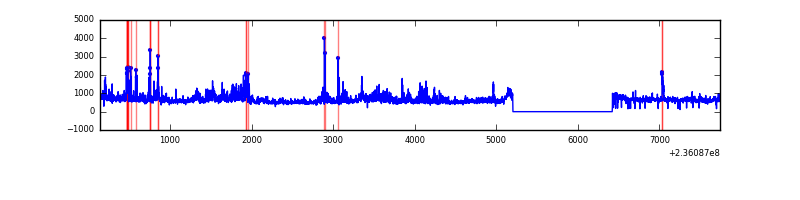 |
| B | 7602 | 6382 | 0 | 0 | 0.00% | 0.00% | 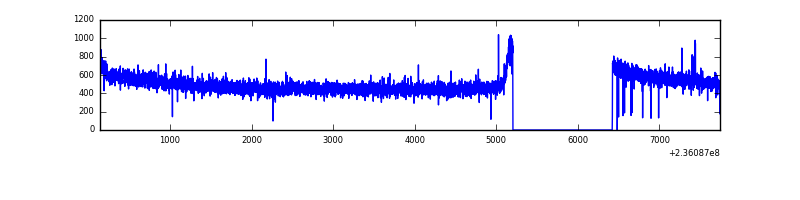 |
| C | 7602 | 6383 | 2019 | 2019 | 26.56% | 31.63% | 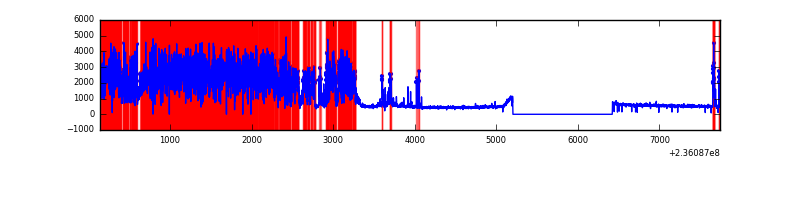 |
| D | 7602 | 6382 | 0 | 0 | 0.00% | 0.00% | 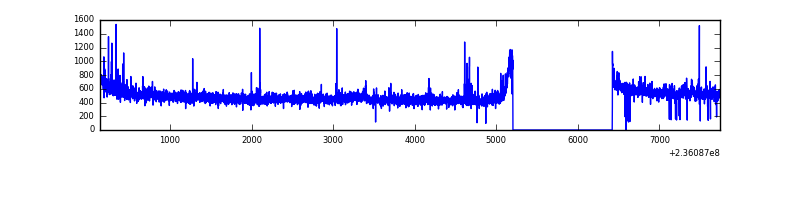 |
Top three noisy pixels from each quadrant. If the there are fewer than three noisy pixels in the level2.evt file, extra rows are filled as -1
| Pixel properties | Quadrant properties | ||||||
|---|---|---|---|---|---|---|---|
| Quadrant | DetID | PixID | Counts | Sigma | Mean | Median | Sigma |
| A | 8 | 5 | 1011277 | 6128.0 | 814 | 799 | 164.9 |
| A | 4 | 2 | 81933 | 492.03 | 814 | 799 | 164.9 |
| A | 14 | 111 | 23302 | 136.47 | 814 | 799 | 164.9 |
| B | 12 | 111 | 17055 | 105.42 | 816 | 798 | 154.2 |
| B | 11 | 111 | 13959 | 85.34 | 816 | 798 | 154.2 |
| B | 14 | 111 | 10537 | 63.15 | 816 | 798 | 154.2 |
| C | 4 | 254 | 6267049 | 42742.15 | 636 | 639 | 146.6 |
| C | 9 | 68 | 17742 | 116.66 | 636 | 639 | 146.6 |
| C | 13 | 61 | 4724 | 27.86 | 636 | 639 | 146.6 |
| D | 8 | 195 | 96242 | 477.54 | 786 | 767 | 199.9 |
| D | 10 | 172 | 35420 | 173.32 | 786 | 767 | 199.9 |
| D | 2 | 234 | 24246 | 117.44 | 786 | 767 | 199.9 |
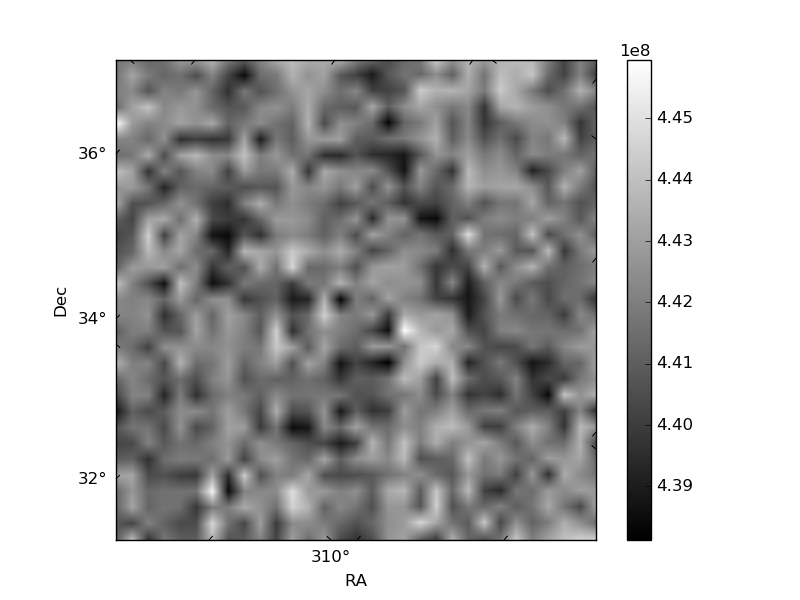
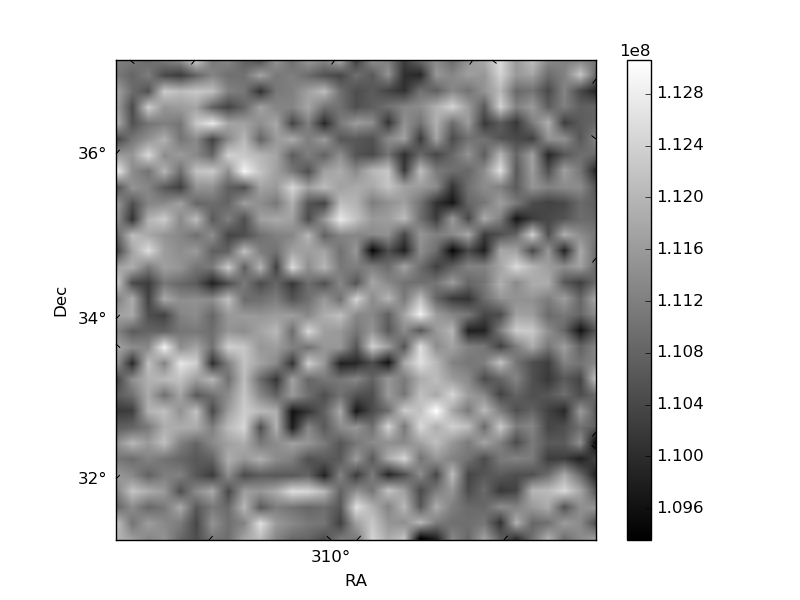
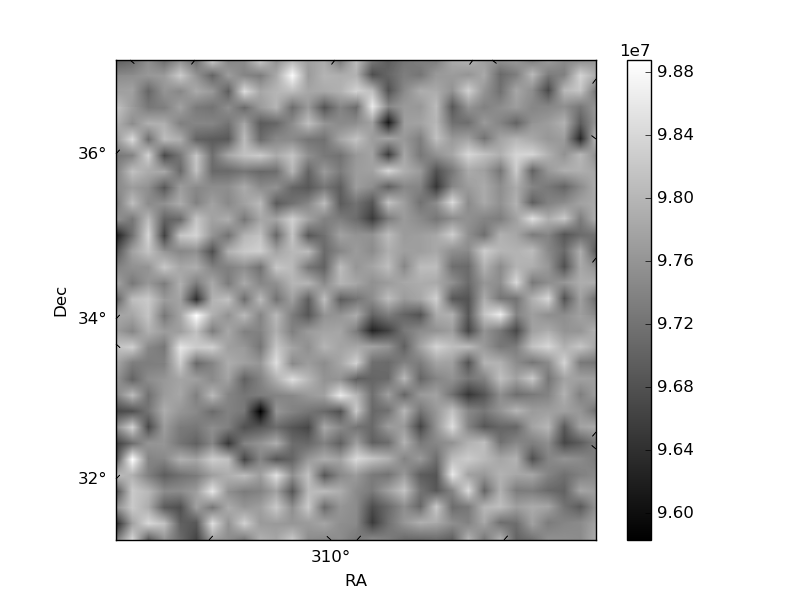
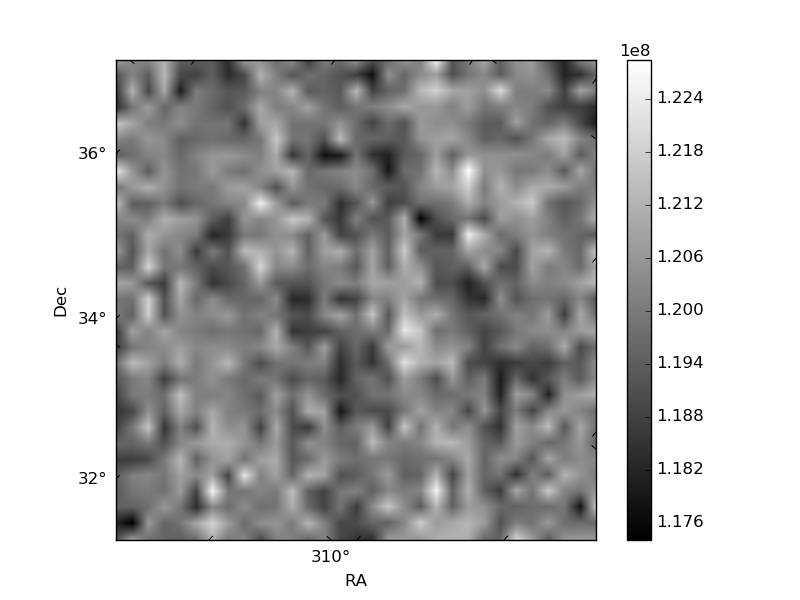
Histogram calculated using DETX and DETY for each event in the final _common_clean file
| Quadrant A | 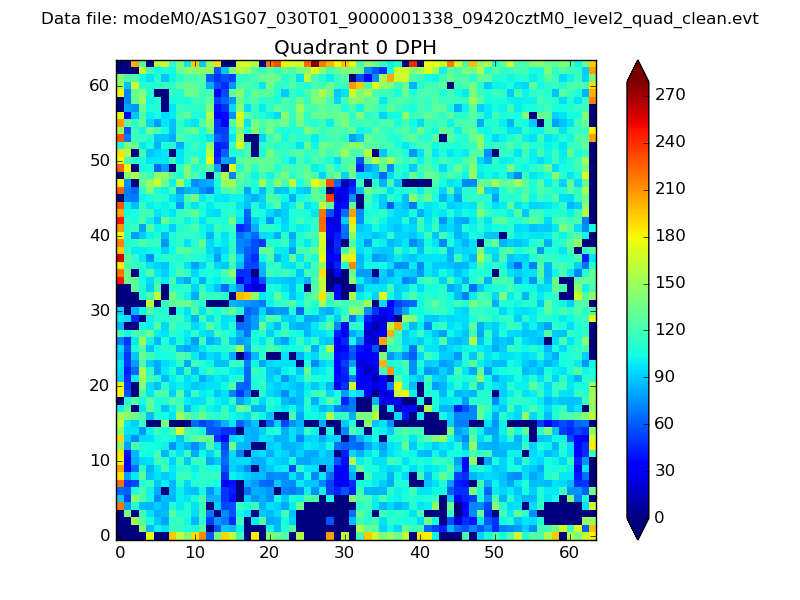 |
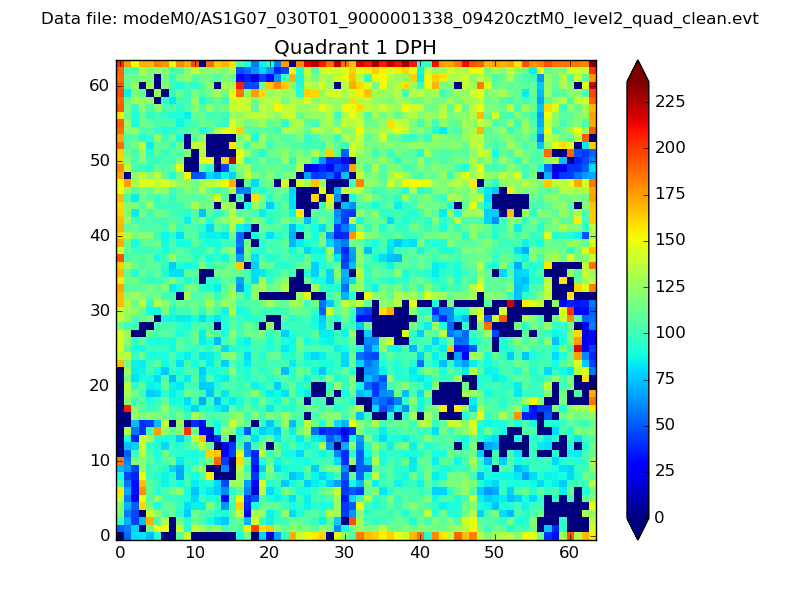 |
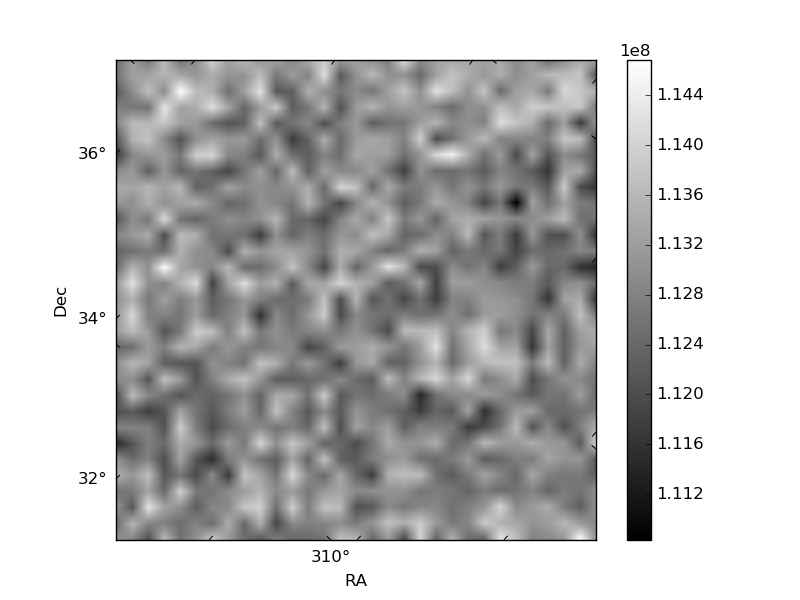
Quadrant B |
|---|---|---|---|
| Quadrant D | 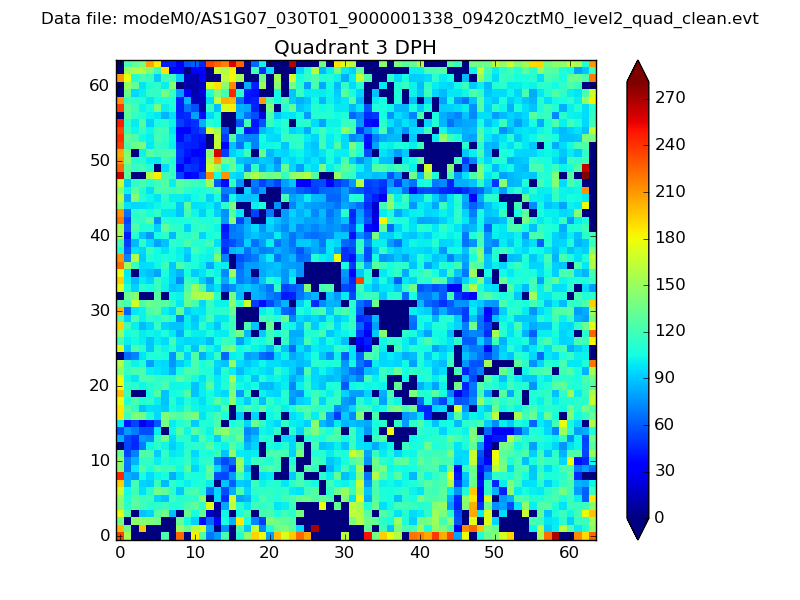 |
 |
Quadrant C |
| Plot type | Count rate plots | Images |
|---|---|---|
| Comparison with Poisson distribution Blue bars denote a histogram of data divided into 1 sec bins. Red curve is a Poisson curve with rate = median count rate of data. |
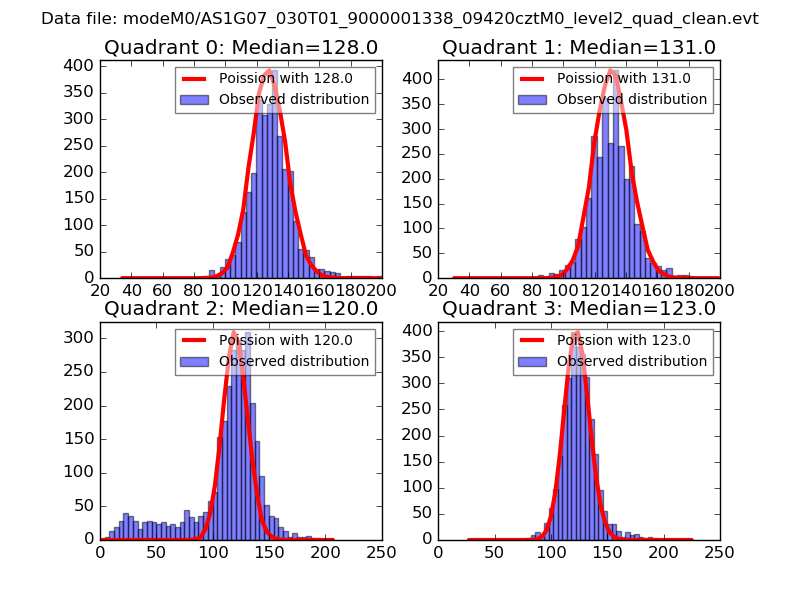 |
 |
| Quadrant-wise count rates Data is divided into 100 sec bins |
 |
|
| Module-wise count rates for Quadrant A Data is divided into 100 sec bins |
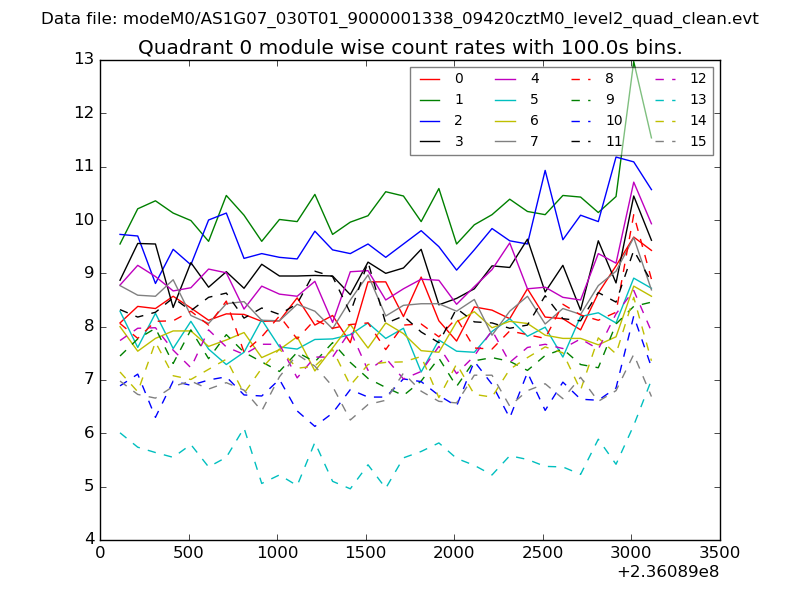 |
 |
| Module-wise count rates for Quadrant B Data is divided into 100 sec bins |
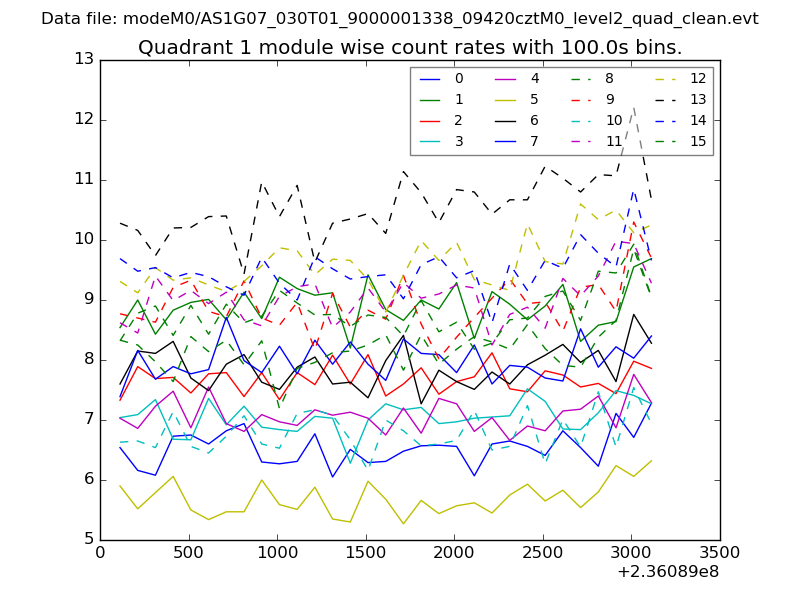 |
 |
| Module-wise count rates for Quadrant C Data is divided into 100 sec bins |
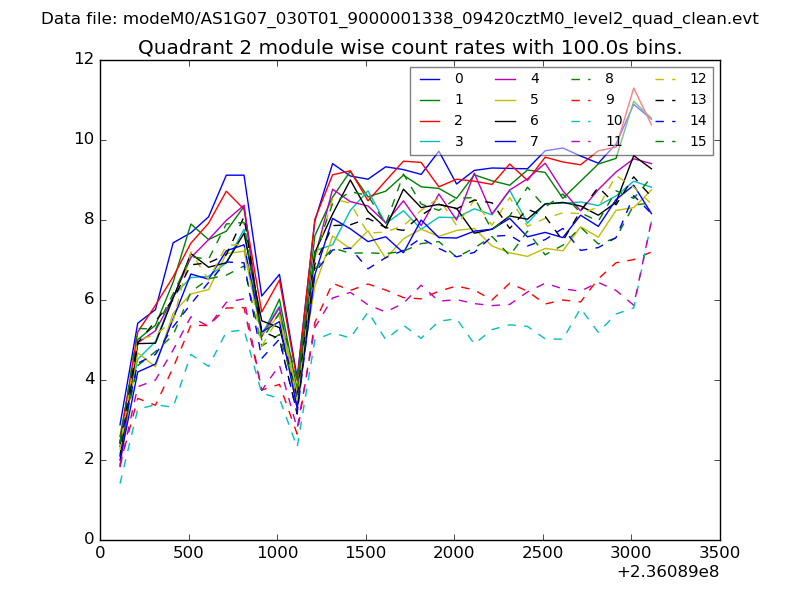 |
 |
| Module-wise count rates for Quadrant D Data is divided into 100 sec bins |
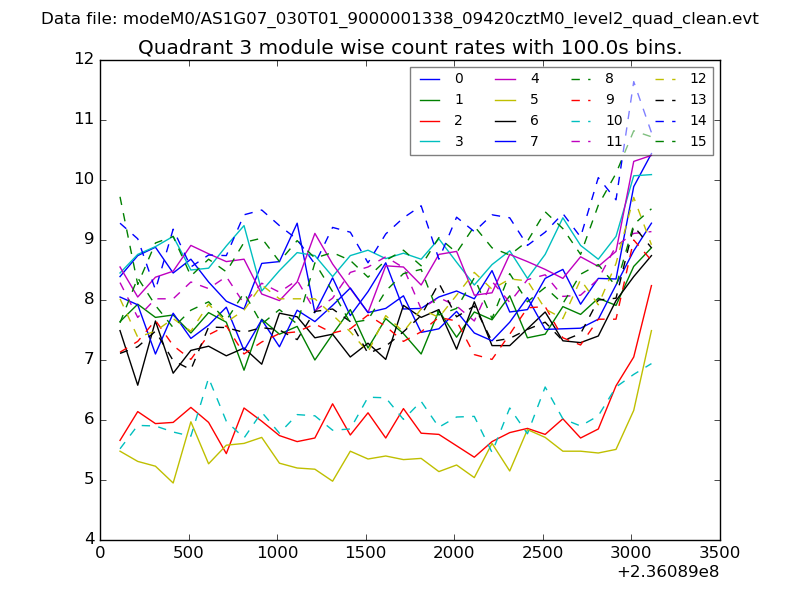 |
 |
| Parameter | Plot |
|---|---|
| CZT HV Monitor | 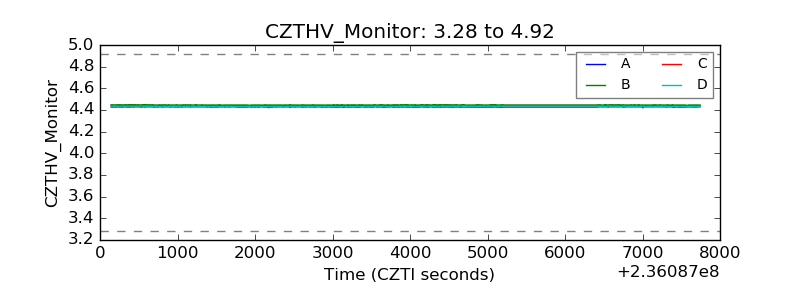 |
| D_VDD | 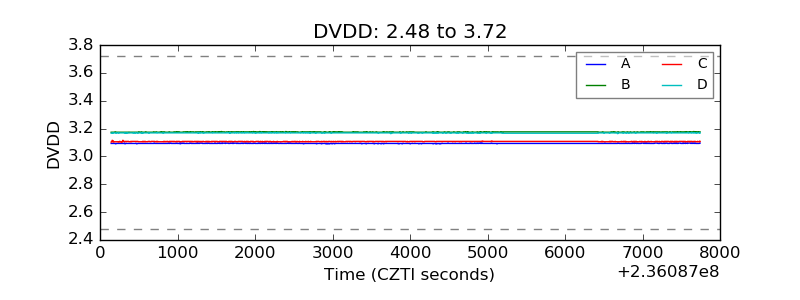 |
| Temperature 1 | 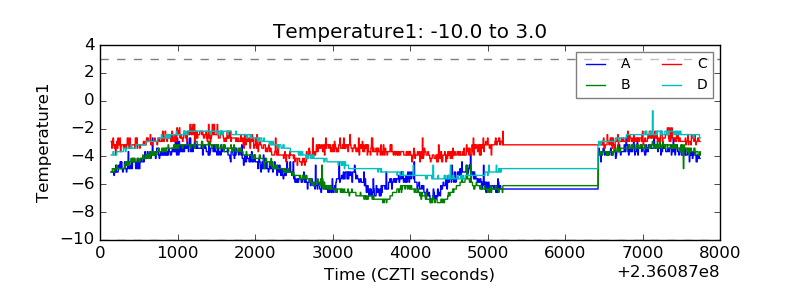 |
| Veto HV Monitor | 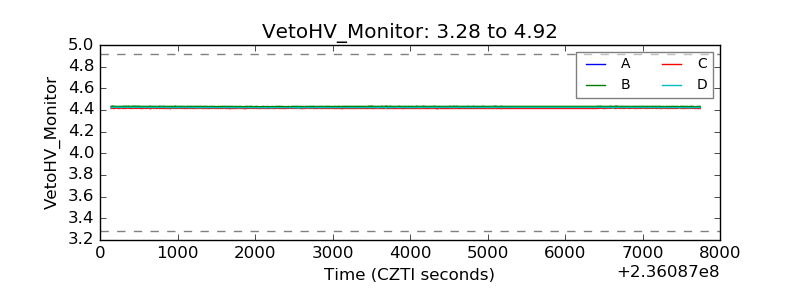 |
| Veto LLD | 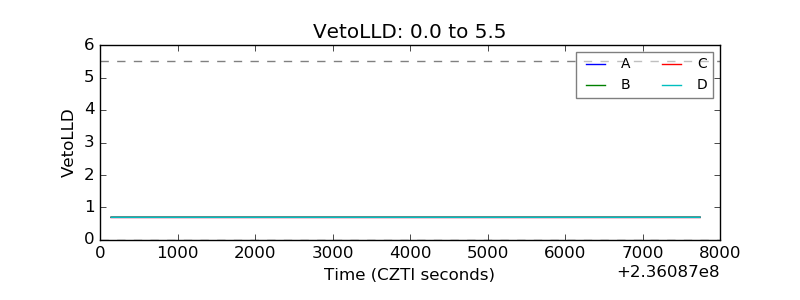 |
| Alpha Counter |  |
| _CPM_Rate | 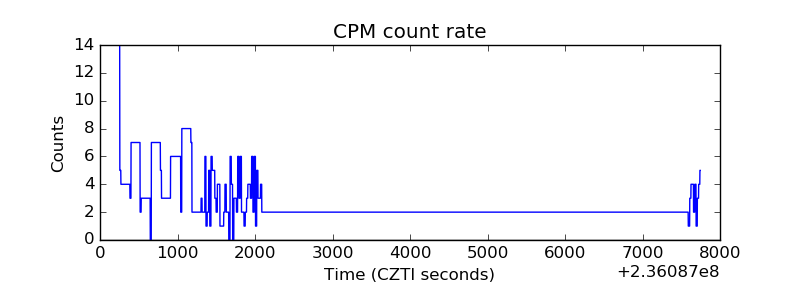 |
| CZT Counter |  |
| +2.5 Volts monitor |  |
| +5 Volts monitor |  |
| _ROLL_ROT | 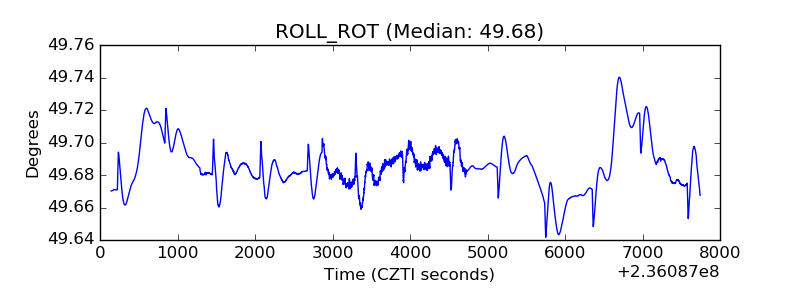 |
| _Roll_DEC | 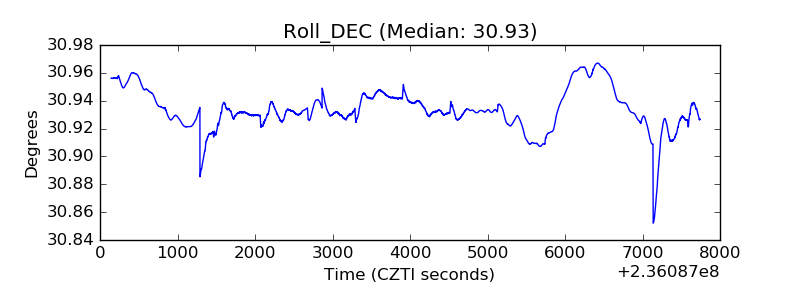 |
| _Roll_RA | 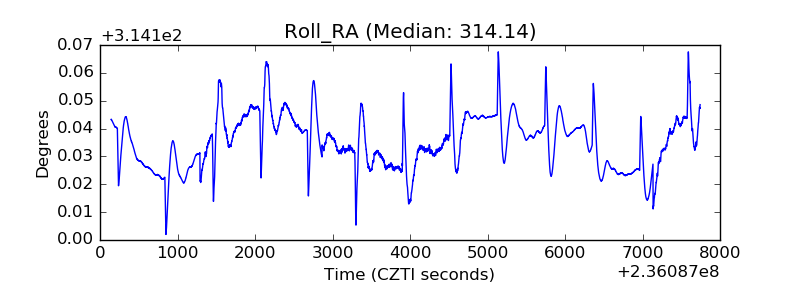 |
| Veto Counter | 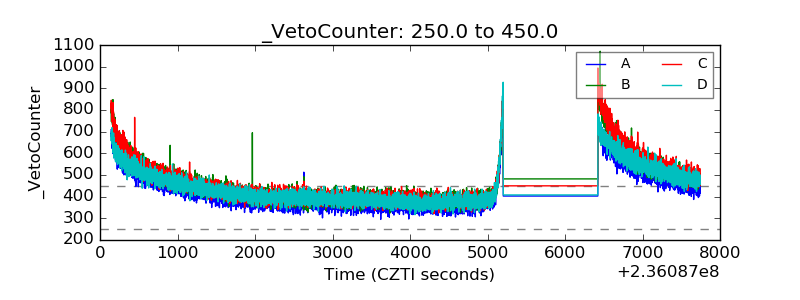 |