| Param | Original file | Final file |
|---|---|---|
| Filename | modeM0/AS1G07_030T01_9000001338_09423cztM0_level2.evt | modeM0/AS1G07_030T01_9000001338_09423cztM0_level2_quad_clean.evt |
| Size (bytes) | 2,144,289,600 | 277,156,800 |
| Size | 2.0 GB | 264.3 MB |
| Events in quadrant A | 13,184,618 | 1,866,948 |
| Events in quadrant B | 10,499,984 | 1,902,225 |
| Events in quadrant C | 29,317,358 | 1,349,675 |
| Events in quadrant D | 10,500,352 | 1,803,616 |
| Mode SS | |||
|---|---|---|---|
| Quadrant | BADHDUFLAG | Total packets | Discarded packets |
| A | 0 | 434 | 0 |
| B | 0 | 434 | 0 |
| C | 0 | 434 | 0 |
| D | 0 | 434 | 0 |
| Mode M0 | |||
|---|---|---|---|
| Quadrant | BADHDUFLAG | Total packets | Discarded packets |
| A | 0 | 53339 | 9 |
| B | 0 | 44900 | 4 |
| C | 0 | 101519 | 4 |
| D | 0 | 45151 | 4 |
| Mode M9 | |||
|---|---|---|---|
| Quadrant | BADHDUFLAG | Total packets | Discarded packets |
| A | 0 | 49 | 0 |
| B | 0 | 49 | 0 |
| C | 0 | 49 | 0 |
| D | 0 | 49 | 0 |
| Quadrant | Total seconds | Saturated seconds | Saturation percentage |
|---|---|---|---|
| A | 21347 | 394 | 1.845693% |
| B | 21349 | 270 | 1.264696% |
| C | 21349 | 7830 | 36.676191% |
| D | 21349 | 232 | 1.086702% |
Noise dominated data is calculated using 1-second bins in cleaned event files. If a bin has >2000 counts, and if more than 50% of those come from <1% of pixels, then it is considered to be noise-dominated and hence unusable.
| Quadrant | # 1 sec bins | Bins with >0 counts | Bins with >2000 counts | High rate bins dominated by noise | Noise dominated (total time) | Noise dominated (detector-on time) | Marked lightcurve |
|---|---|---|---|---|---|---|---|
| A | 26214 | 21353 | 46 | 46 | 0.18% | 0.22% | 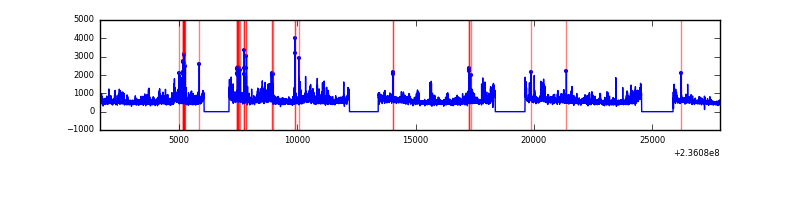 |
| B | 26214 | 21353 | 1 | 1 | 0.00% | 0.00% | 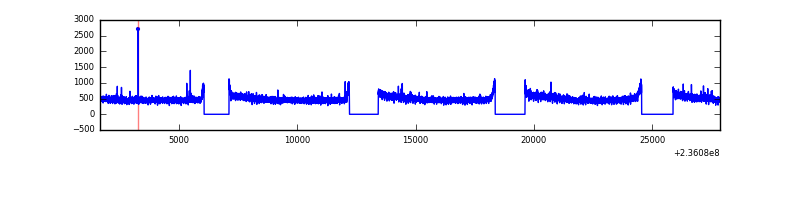 |
| C | 26214 | 21350 | 5542 | 5542 | 21.14% | 25.96% | 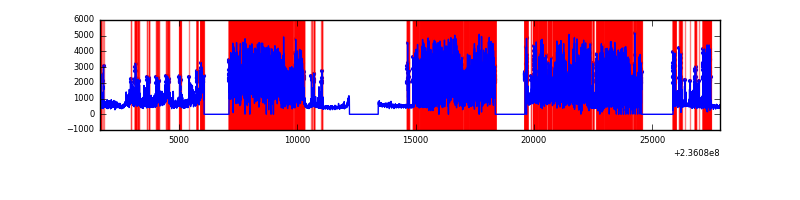 |
| D | 26214 | 21353 | 14 | 14 | 0.05% | 0.07% | 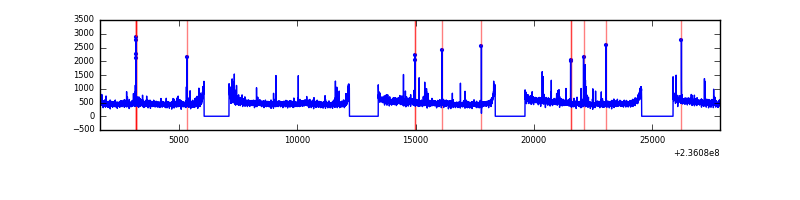 |
Top three noisy pixels from each quadrant. If the there are fewer than three noisy pixels in the level2.evt file, extra rows are filled as -1
| Pixel properties | Quadrant properties | ||||||
|---|---|---|---|---|---|---|---|
| Quadrant | DetID | PixID | Counts | Sigma | Mean | Median | Sigma |
| A | 8 | 5 | 2542581 | 4715.58 | 2683 | 2632 | 538.6 |
| A | 4 | 2 | 189948 | 347.76 | 2683 | 2632 | 538.6 |
| A | 1 | 162 | 60097 | 106.69 | 2683 | 2632 | 538.6 |
| B | 12 | 111 | 56411 | 107.06 | 2695 | 2639 | 502.3 |
| B | 11 | 111 | 45774 | 85.88 | 2695 | 2639 | 502.3 |
| B | 14 | 111 | 34545 | 63.52 | 2695 | 2639 | 502.3 |
| C | 4 | 254 | 21164617 | 45359.15 | 2051 | 2063 | 466.6 |
| C | 9 | 68 | 73381 | 152.86 | 2051 | 2063 | 466.6 |
| C | 14 | 234 | 50301 | 103.39 | 2051 | 2063 | 466.6 |
| D | 8 | 195 | 320249 | 486.56 | 2611 | 2551 | 652.9 |
| D | 2 | 234 | 85825 | 127.54 | 2611 | 2551 | 652.9 |
| D | 10 | 172 | 64683 | 95.16 | 2611 | 2551 | 652.9 |
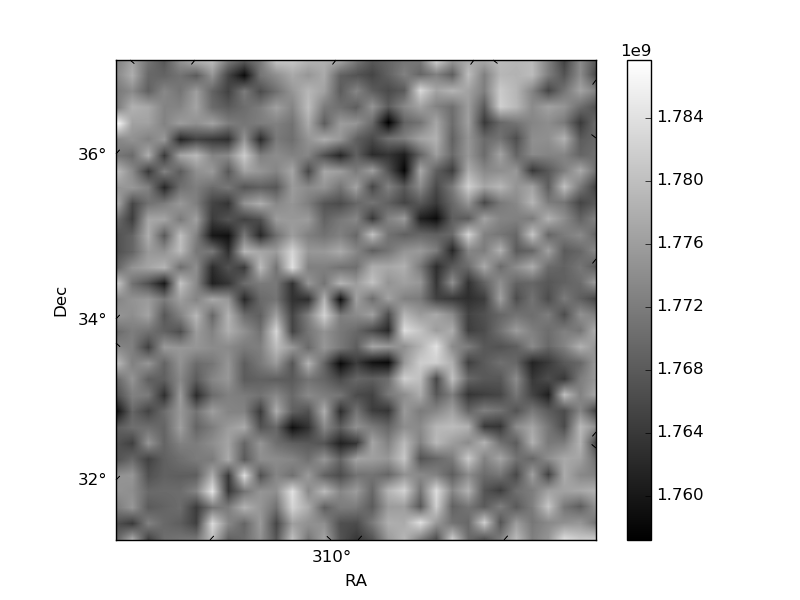
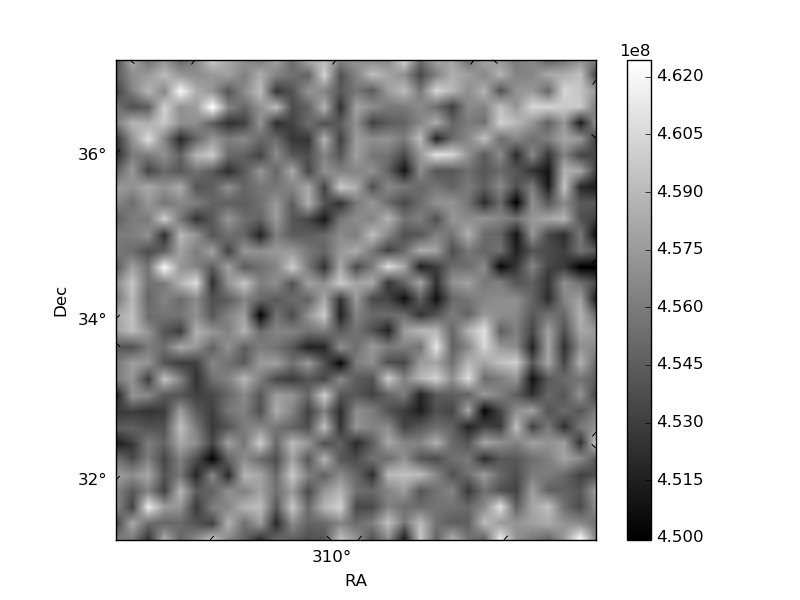
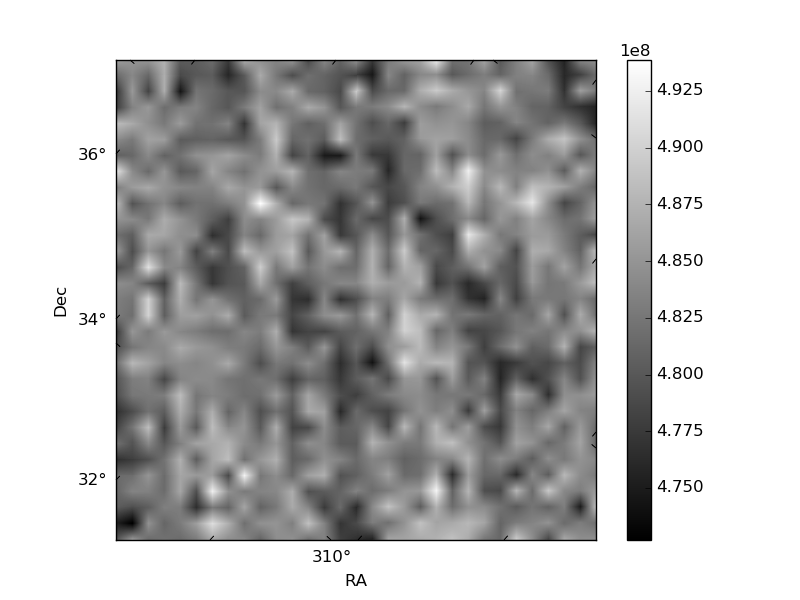
Histogram calculated using DETX and DETY for each event in the final _common_clean file
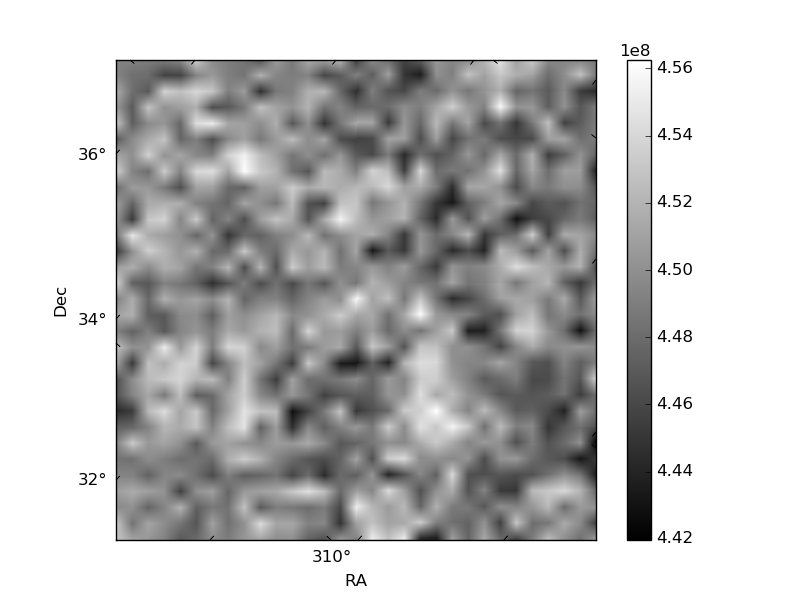
| Quadrant A | 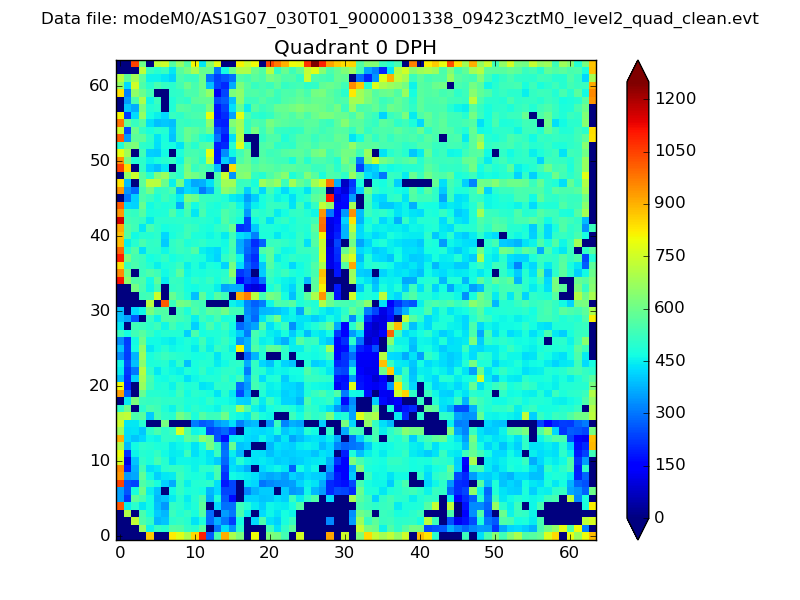 |
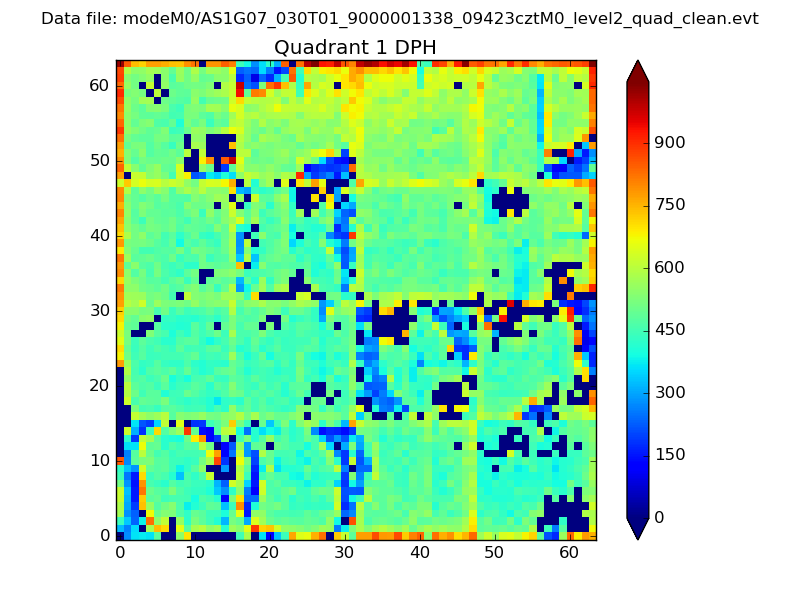 |
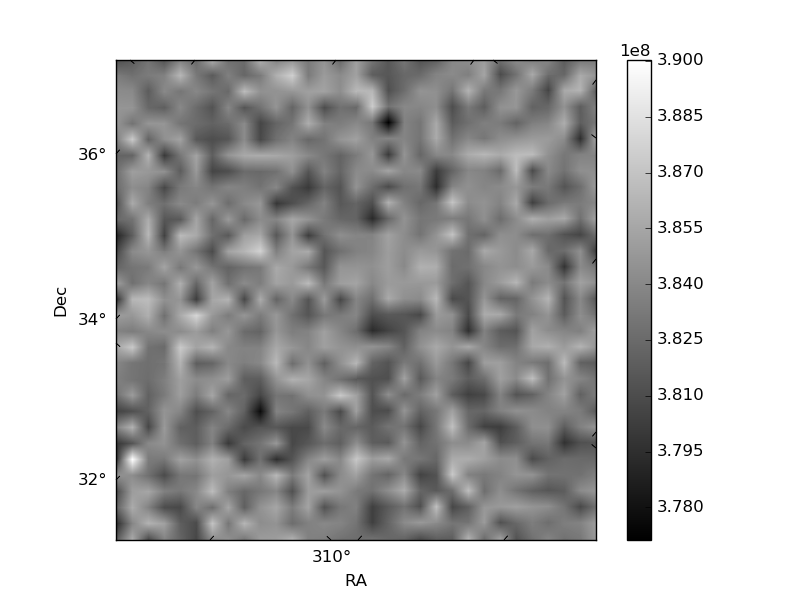
Quadrant B |
|---|---|---|---|
| Quadrant D | 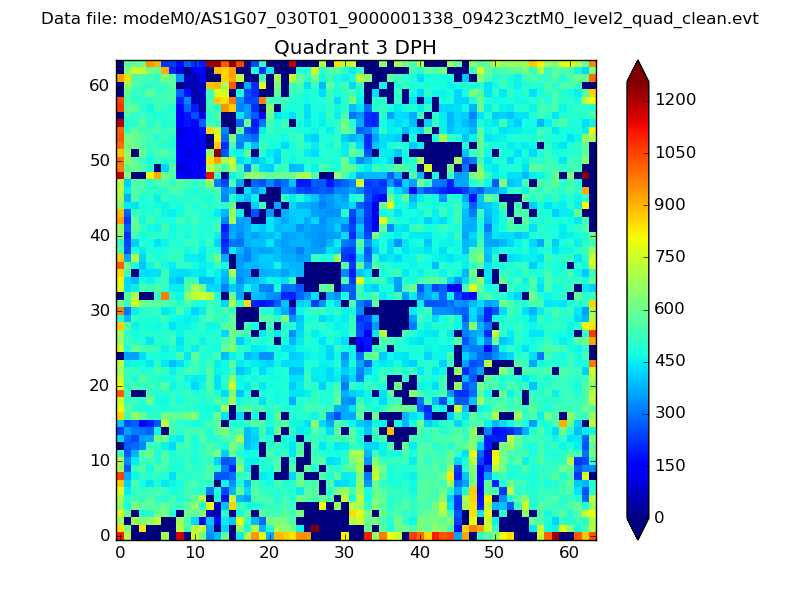 |
 |
Quadrant C |
| Plot type | Count rate plots | Images |
|---|---|---|
| Comparison with Poisson distribution Blue bars denote a histogram of data divided into 1 sec bins. Red curve is a Poisson curve with rate = median count rate of data. |
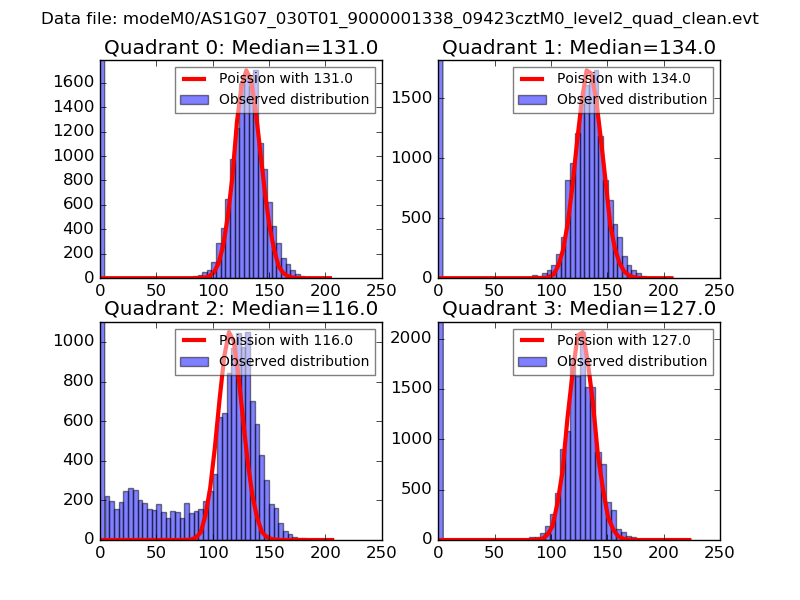 |
 |
| Quadrant-wise count rates Data is divided into 100 sec bins |
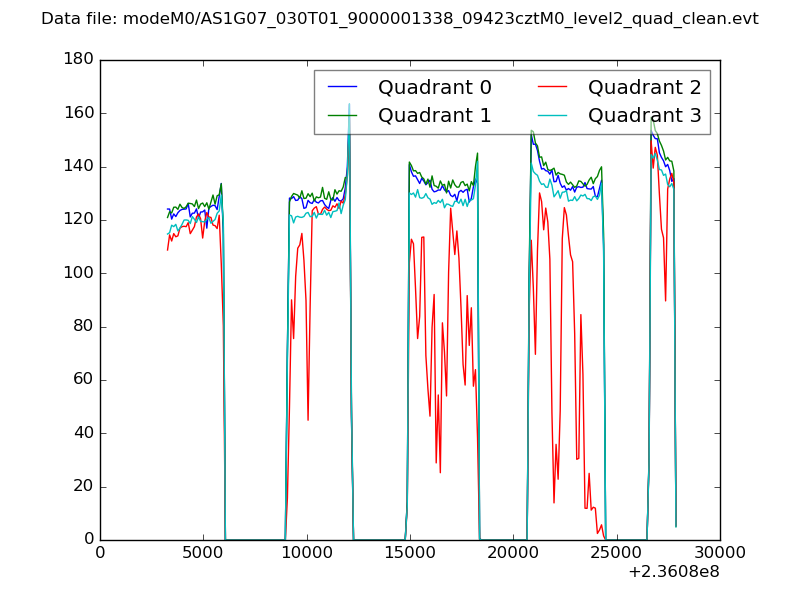 |
|
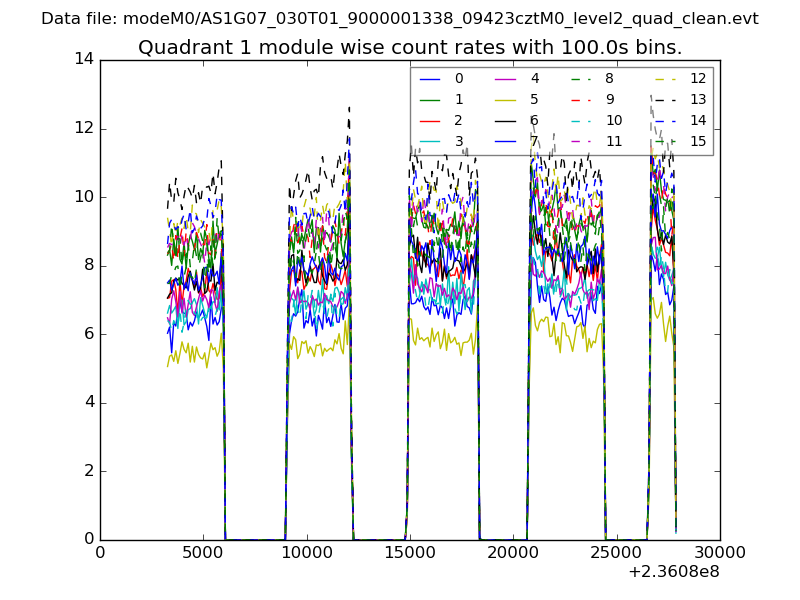
| Module-wise count rates for Quadrant A Data is divided into 100 sec bins |
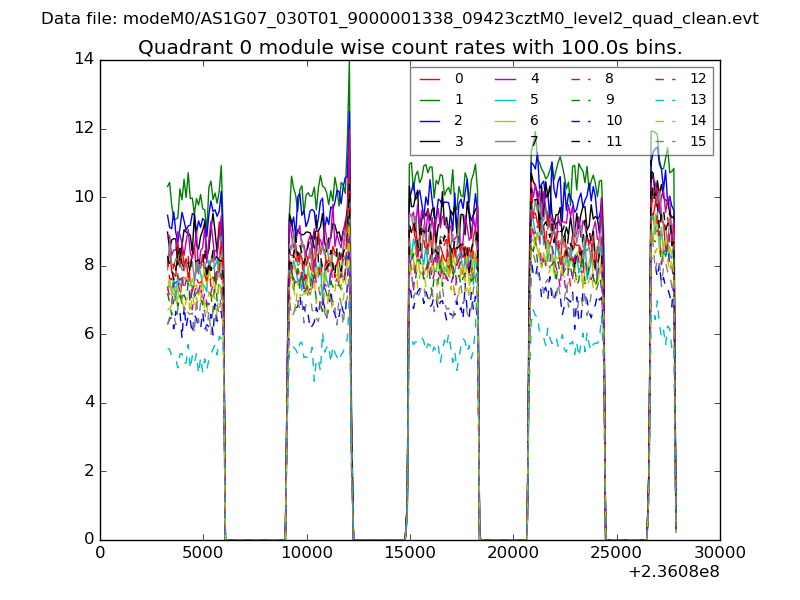 |
 |
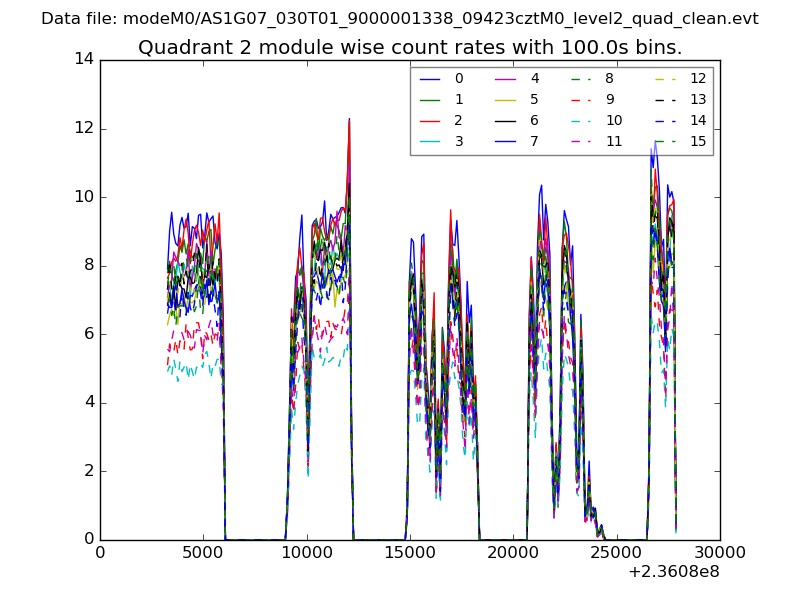
| Module-wise count rates for Quadrant B Data is divided into 100 sec bins |
 |
 |
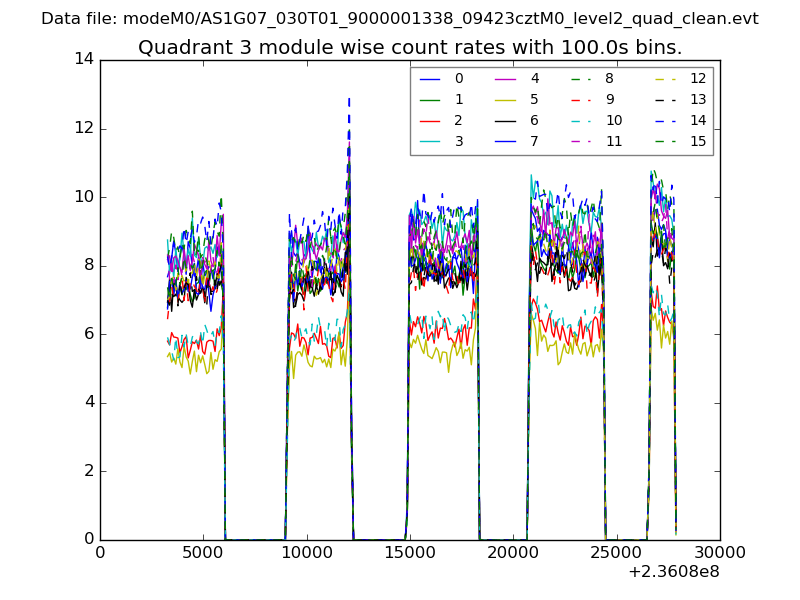
| Module-wise count rates for Quadrant C Data is divided into 100 sec bins |
 |
 |
| Module-wise count rates for Quadrant D Data is divided into 100 sec bins |
 |
 |
| Parameter | Plot |
|---|---|
| CZT HV Monitor | 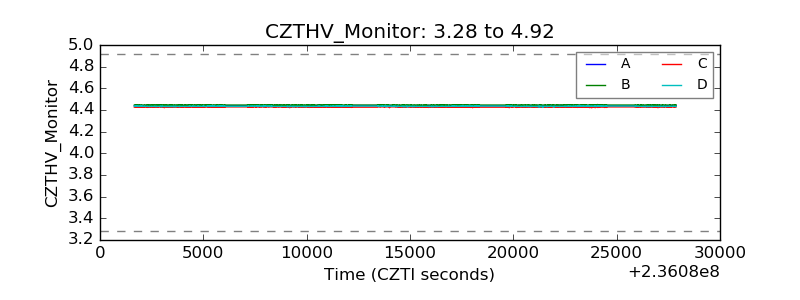 |
| D_VDD | 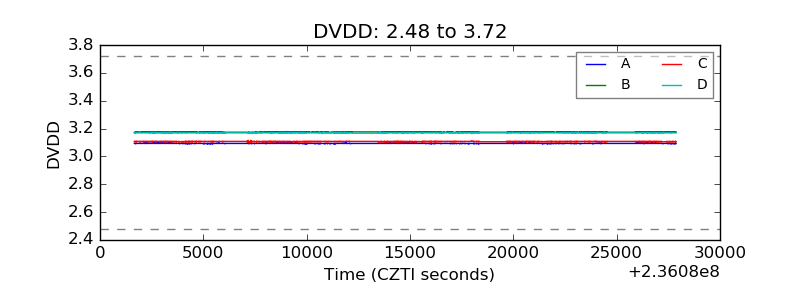 |
| Temperature 1 | 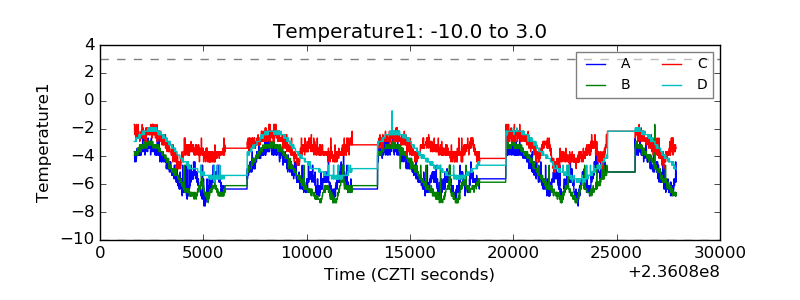 |
| Veto HV Monitor | 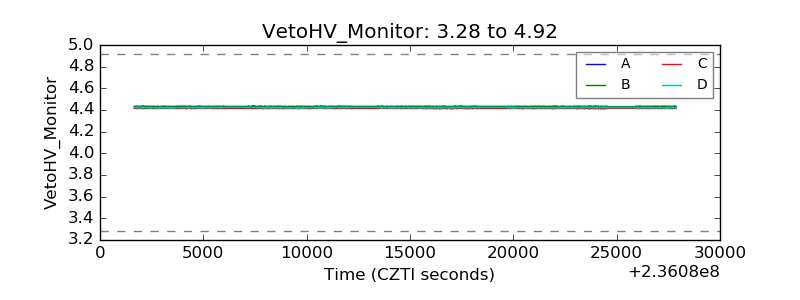 |
| Veto LLD | 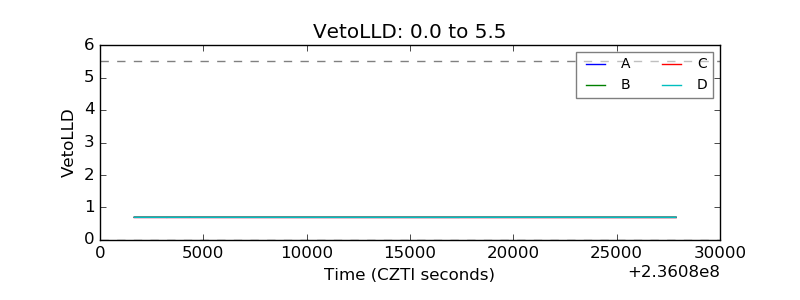 |
| Alpha Counter | 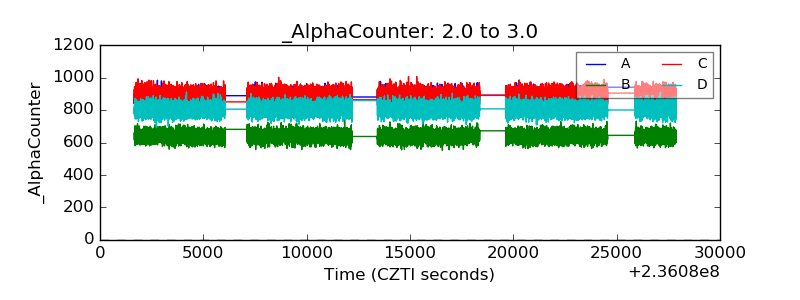 |
| _CPM_Rate | 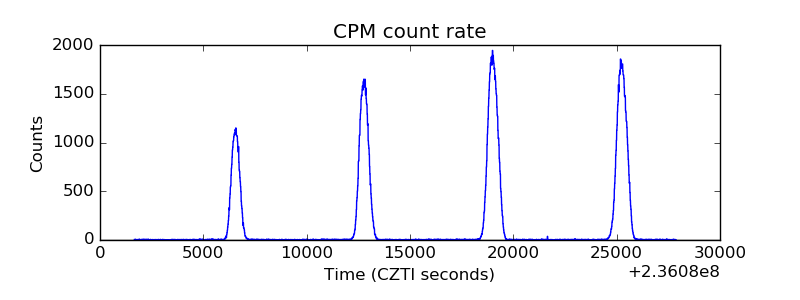 |
| CZT Counter |  |
| +2.5 Volts monitor |  |
| +5 Volts monitor | 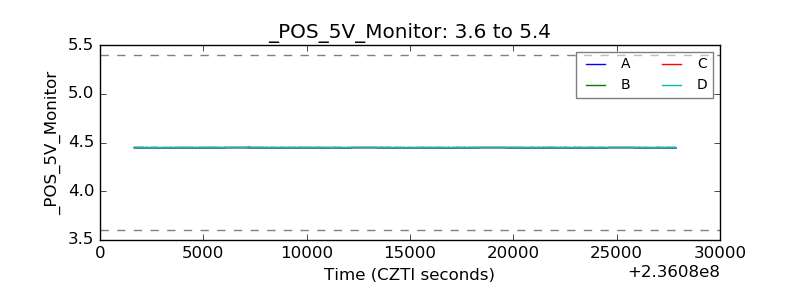 |
| _ROLL_ROT | 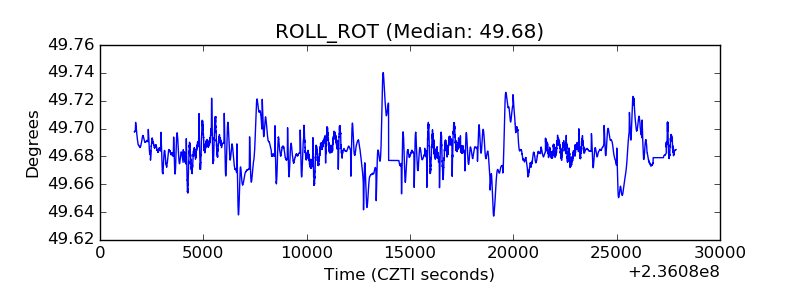 |
| _Roll_DEC | 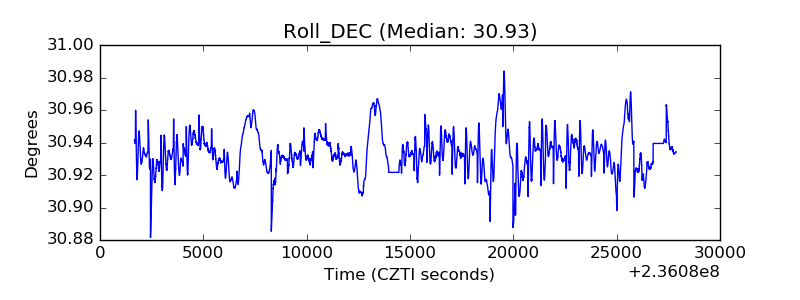 |
| _Roll_RA | 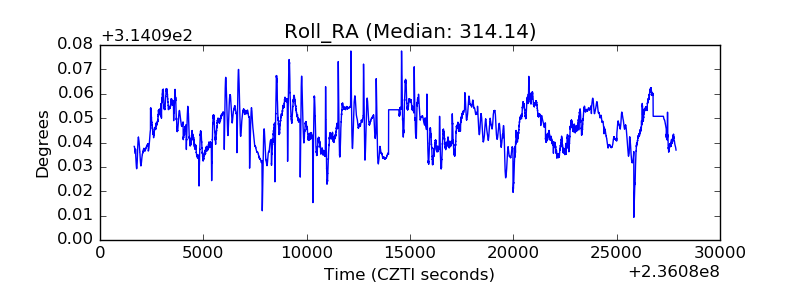 |
| Veto Counter | 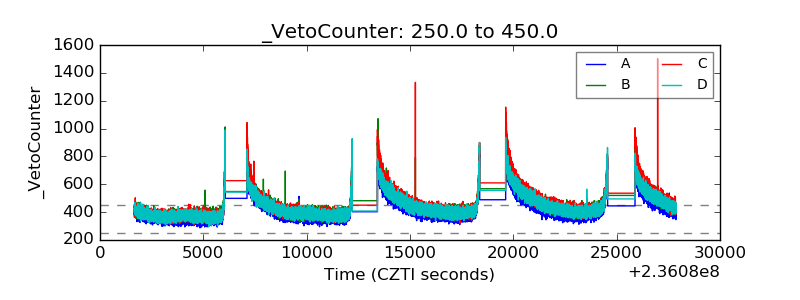 |