| Param | Original file | Final file |
|---|---|---|
| Filename | modeM0/AS1G07_063T01_9000001336cztM0_level2.fits | modeM0/AS1G07_063T01_9000001336cztM0_level2_quad_clean.evt |
| Size (bytes) | 169,007,040 | 147,323,520 |
| Size | 161.2 MB | 140.5 MB |
| Events in quadrant A | 1,004,504 | 829,811 |
| Events in quadrant B | 1,013,555 | 870,928 |
| Events in quadrant C | 904,432 | 709,654 |
| Events in quadrant D | 877,760 | 735,169 |
| Mode SS | |||
|---|---|---|---|
| Quadrant | BADHDUFLAG | Total packets | Discarded packets |
| A | 0 | 384 | 0 |
| B | 0 | 390 | 0 |
| C | 0 | 390 | 0 |
| D | 0 | 402 | 0 |
| Mode M9 | |||
|---|---|---|---|
| Quadrant | BADHDUFLAG | Total packets | Discarded packets |
| A | 0 | 13 | 0 |
| B | 0 | 13 | 0 |
| C | 0 | 13 | 0 |
| D | 0 | 12 | 0 |
| Mode M0 | |||
|---|---|---|---|
| Quadrant | BADHDUFLAG | Total packets | Discarded packets |
| A | 0 | 49196 | 0 |
| B | 0 | 39606 | 0 |
| C | 0 | 55588 | 0 |
| D | 0 | 46669 | 0 |
| Quadrant | Total seconds | Saturated seconds | Saturation percentage |
|---|---|---|---|
| A | 19037 | 307 | 1.612649% |
| B | 19475 | 194 | 0.996149% |
| C | 18409 | 2311 | 12.553642% |
| D | 19309 | 601 | 3.112538% |
Noise dominated data is calculated using 1-second bins in cleaned event files. If a bin has >2000 counts, and if more than 50% of those come from <1% of pixels, then it is considered to be noise-dominated and hence unusable.
| Quadrant | # 1 sec bins | Bins with >0 counts | Bins with >2000 counts | High rate bins dominated by noise | Noise dominated (total time) | Noise dominated (detector-on time) | Marked lightcurve |
|---|---|---|---|---|---|---|---|
| A | 22886 | 20572 | 0 | 0 | 0.00% | 0.00% |  |
| B | 22887 | 20776 | 0 | 0 | 0.00% | 0.00% |  |
| C | 22886 | 19818 | 0 | 0 | 0.00% | 0.00% |  |
| D | 22887 | 20737 | 0 | 0 | 0.00% | 0.00% |  |
Top three noisy pixels from each quadrant. If the there are fewer than three noisy pixels in the level2.evt file, extra rows are filled as -1
| Pixel properties | Quadrant properties | ||||||
|---|---|---|---|---|---|---|---|
| Quadrant | DetID | PixID | Counts | Sigma | Mean | Median | Sigma |
| A | 0 | 29 | 970 | 10.5 | 261 | 243 | 69.2 |
| A | 7 | 110 | 854 | 8.83 | 261 | 243 | 69.2 |
| A | 9 | 19 | 779 | 7.74 | 261 | 243 | 69.2 |
| B | 2 | 9 | 835 | 10.32 | 266 | 252 | 56.5 |
| B | 12 | 226 | 704 | 8.0 | 266 | 252 | 56.5 |
| B | 5 | 225 | 689 | 7.74 | 266 | 252 | 56.5 |
| C | 12 | 241 | 703 | 7.45 | 238 | 219 | 64.9 |
| C | 3 | 158 | 648 | 6.61 | 238 | 219 | 64.9 |
| C | 1 | 80 | 645 | 6.56 | 238 | 219 | 64.9 |
| D | 6 | 231 | 696 | 6.86 | 249 | 226 | 68.6 |
| D | 3 | 14 | 695 | 6.84 | 249 | 226 | 68.6 |
| D | 3 | 31 | 657 | 6.29 | 249 | 226 | 68.6 |
Histogram calculated using DETX and DETY for each event in the final _common_clean file
| Quadrant A | 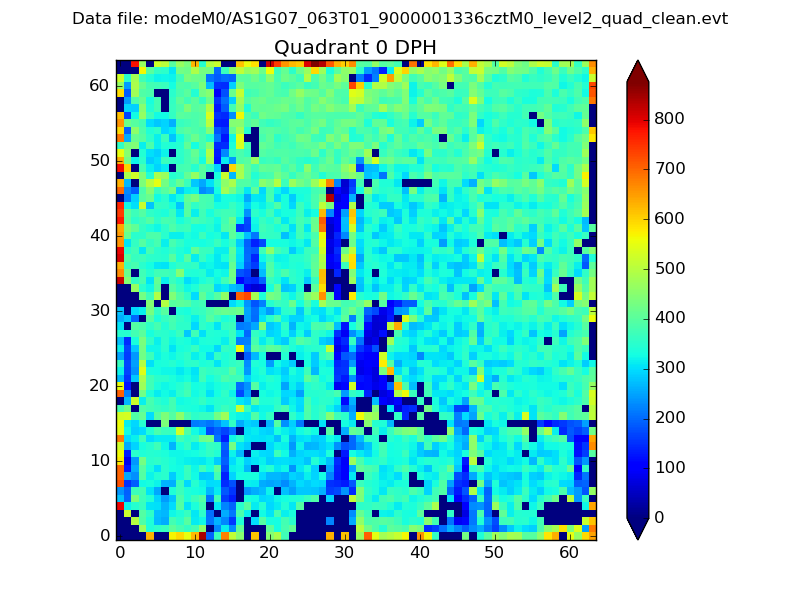 |
 |
Quadrant B |
|---|---|---|---|
| Quadrant D | 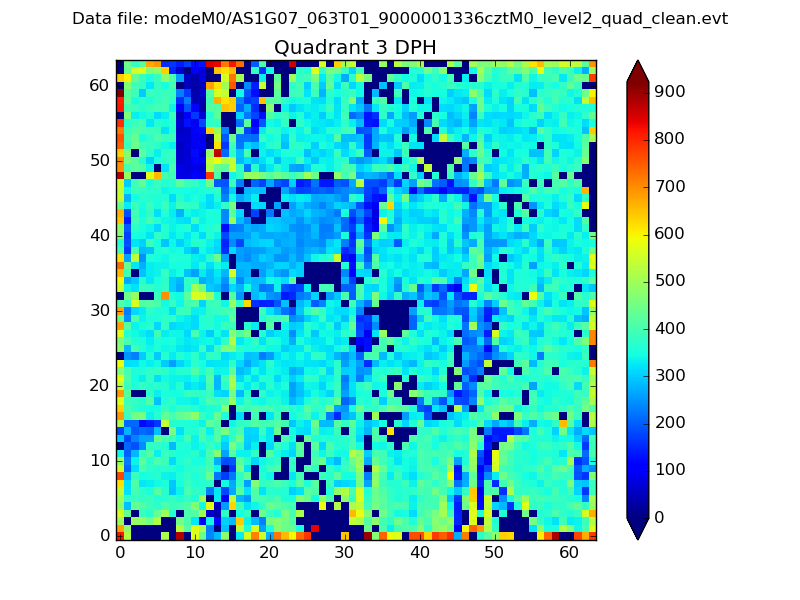 |
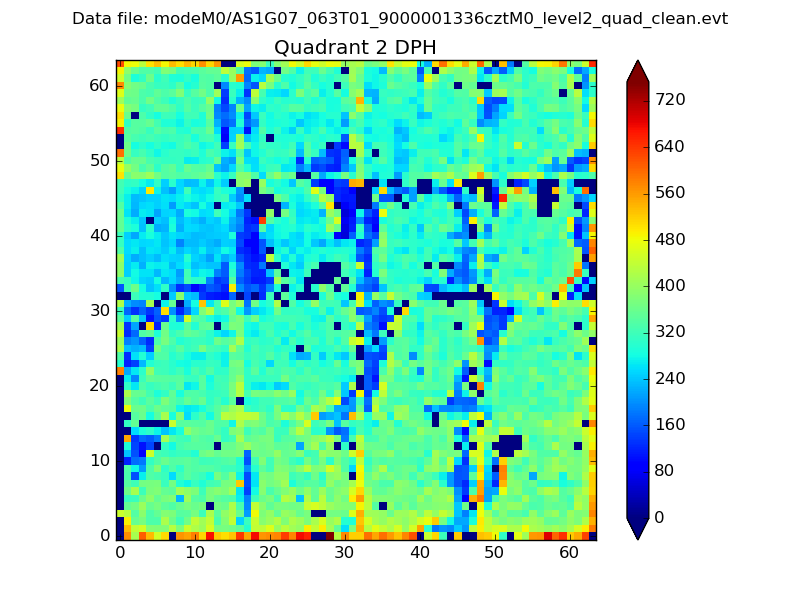 |
Quadrant C |
| Plot type | Count rate plots | Images |
|---|---|---|
| Comparison with Poisson distribution Blue bars denote a histogram of data divided into 1 sec bins. Red curve is a Poisson curve with rate = median count rate of data. |
 |
 |
| Quadrant-wise count rates Data is divided into 100 sec bins |
 |
|
| Module-wise count rates for Quadrant A Data is divided into 100 sec bins |
 |
 |
| Module-wise count rates for Quadrant B Data is divided into 100 sec bins |
 |
 |
| Module-wise count rates for Quadrant C Data is divided into 100 sec bins |
 |
 |
| Module-wise count rates for Quadrant D Data is divided into 100 sec bins |
 |
 |
| Parameter | Plot |
|---|---|
| CZT HV Monitor |  |
| D_VDD | 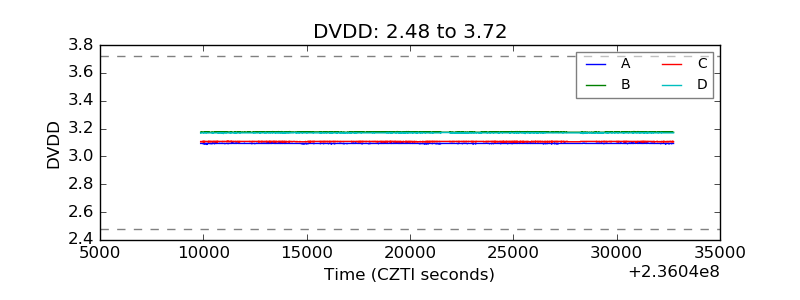 |
| Temperature 1 |  |
| Veto HV Monitor |  |
| Veto LLD |  |
| Alpha Counter |  |
| _CPM_Rate |  |
| CZT Counter |  |
| +2.5 Volts monitor |  |
| +5 Volts monitor |  |
| _ROLL_ROT |  |
| _Roll_DEC |  |
| _Roll_RA |  |
| Veto Counter |  |