| Param | Original file | Final file |
|---|---|---|
| Filename | modeM0/AS1G07_063T01_9000001336_09412cztM0_level2.evt | modeM0/AS1G07_063T01_9000001336_09412cztM0_level2_quad_clean.evt |
| Size (bytes) | 57,075,840 | 16,853,760 |
| Size | 54.4 MB | 16.1 MB |
| Events in quadrant A | 473,538 | 110,580 |
| Events in quadrant B | 390,020 | 111,547 |
| Events in quadrant C | 390,512 | 108,333 |
| Events in quadrant D | 406,492 | 105,631 |
| Mode SS | |||
|---|---|---|---|
| Quadrant | BADHDUFLAG | Total packets | Discarded packets |
| A | 0 | 20 | 0 |
| B | 0 | 20 | 0 |
| C | 0 | 20 | 0 |
| D | 0 | 20 | 0 |
| Mode M0 | |||
|---|---|---|---|
| Quadrant | BADHDUFLAG | Total packets | Discarded packets |
| A | 0 | 2053 | 1 |
| B | 0 | 1894 | 0 |
| C | 0 | 1896 | 2 |
| D | 0 | 2009 | 0 |
| Quadrant | Total seconds | Saturated seconds | Saturation percentage |
|---|---|---|---|
| A | 947 | 0 | 0.000000% |
| B | 947 | 0 | 0.000000% |
| C | 946 | 0 | 0.000000% |
| D | 947 | 2 | 0.211193% |
Noise dominated data is calculated using 1-second bins in cleaned event files. If a bin has >2000 counts, and if more than 50% of those come from <1% of pixels, then it is considered to be noise-dominated and hence unusable.
| Quadrant | # 1 sec bins | Bins with >0 counts | Bins with >2000 counts | High rate bins dominated by noise | Noise dominated (total time) | Noise dominated (detector-on time) | Marked lightcurve |
|---|---|---|---|---|---|---|---|
| A | 947 | 947 | 0 | 0 | 0.00% | 0.00% | 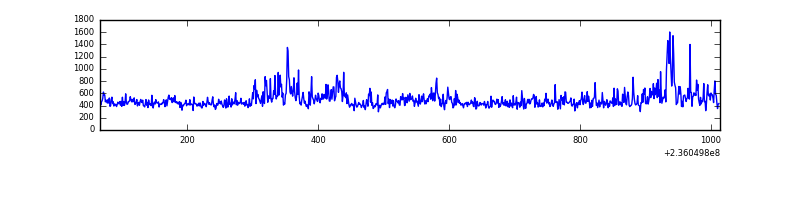 |
| B | 947 | 947 | 0 | 0 | 0.00% | 0.00% | 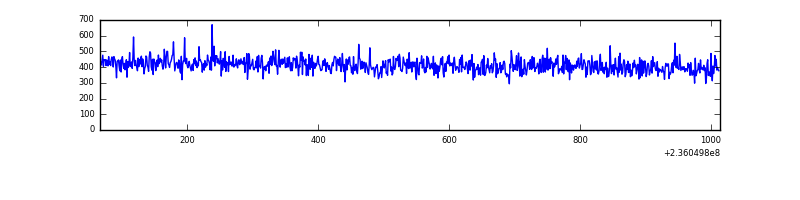 |
| C | 947 | 947 | 0 | 0 | 0.00% | 0.00% | 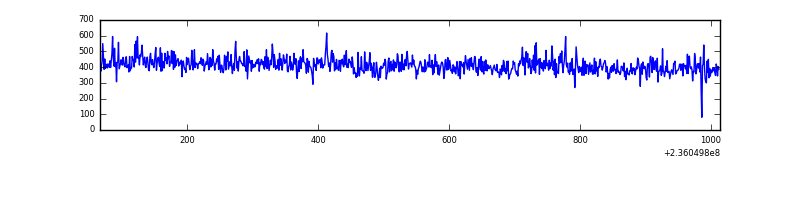 |
| D | 947 | 947 | 0 | 0 | 0.00% | 0.00% | 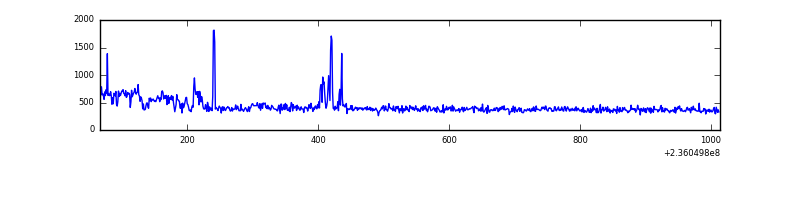 |
Top three noisy pixels from each quadrant. If the there are fewer than three noisy pixels in the level2.evt file, extra rows are filled as -1
| Pixel properties | Quadrant properties | ||||||
|---|---|---|---|---|---|---|---|
| Quadrant | DetID | PixID | Counts | Sigma | Mean | Median | Sigma |
| A | 8 | 5 | 91960 | 4077.37 | 98 | 96 | 22.5 |
| A | 4 | 2 | 1911 | 80.56 | 98 | 96 | 22.5 |
| A | 1 | 162 | 1219 | 49.84 | 98 | 96 | 22.5 |
| B | 12 | 111 | 2193 | 97.38 | 100 | 97 | 21.5 |
| B | 11 | 111 | 1650 | 72.15 | 100 | 97 | 21.5 |
| B | 14 | 111 | 1321 | 56.87 | 100 | 97 | 21.5 |
| C | 9 | 68 | 8240 | 327.94 | 97 | 98 | 24.8 |
| C | 10 | 22 | 883 | 31.62 | 97 | 98 | 24.8 |
| C | 13 | 61 | 780 | 27.47 | 97 | 98 | 24.8 |
| D | 12 | 227 | 29612 | 1142.61 | 94 | 91 | 25.8 |
| D | 13 | 104 | 11673 | 448.28 | 94 | 91 | 25.8 |
| D | 11 | 254 | 4273 | 161.86 | 94 | 91 | 25.8 |
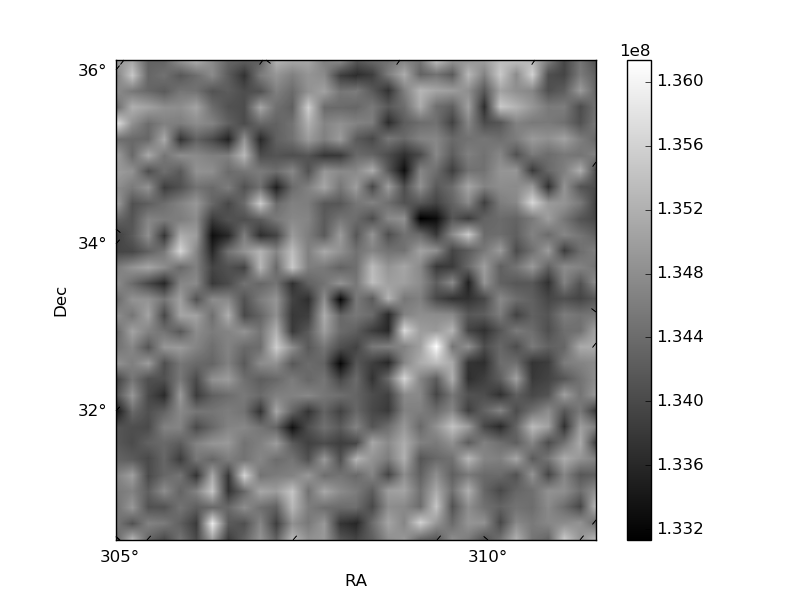
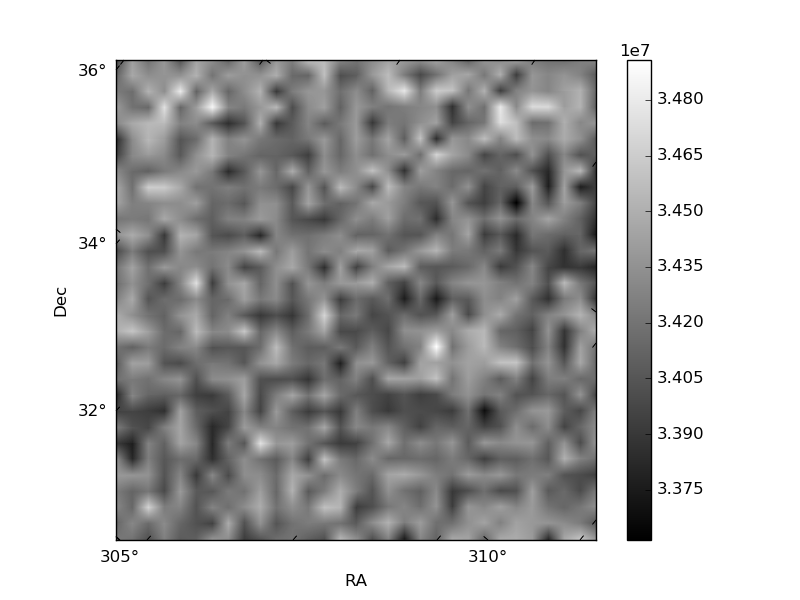
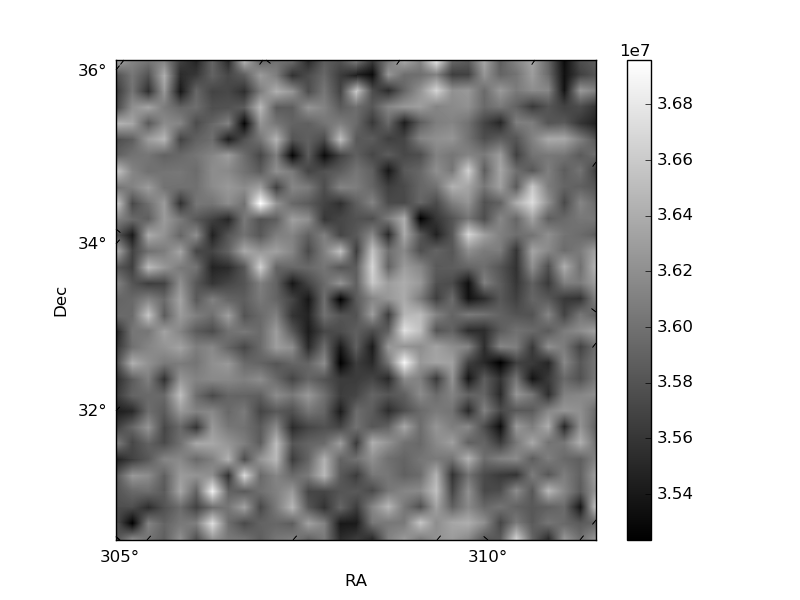
Histogram calculated using DETX and DETY for each event in the final _common_clean file
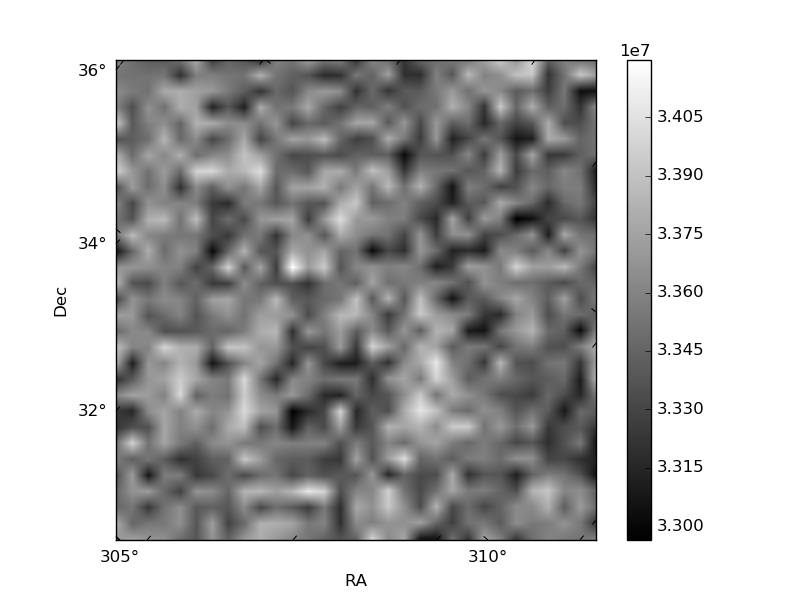
| Quadrant A | 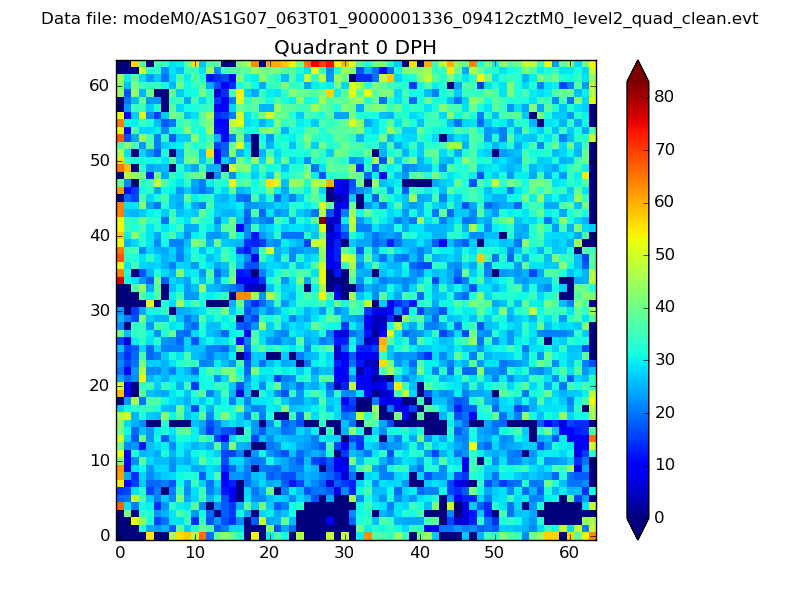 |
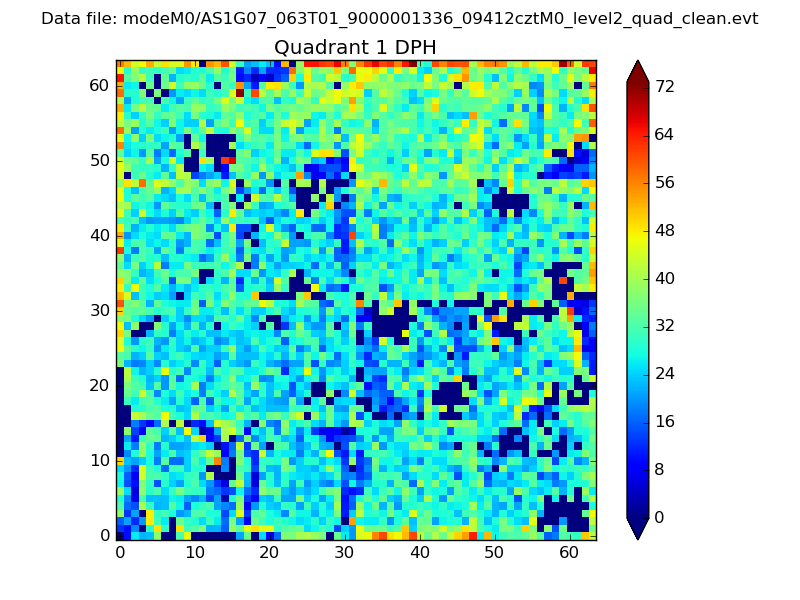 |
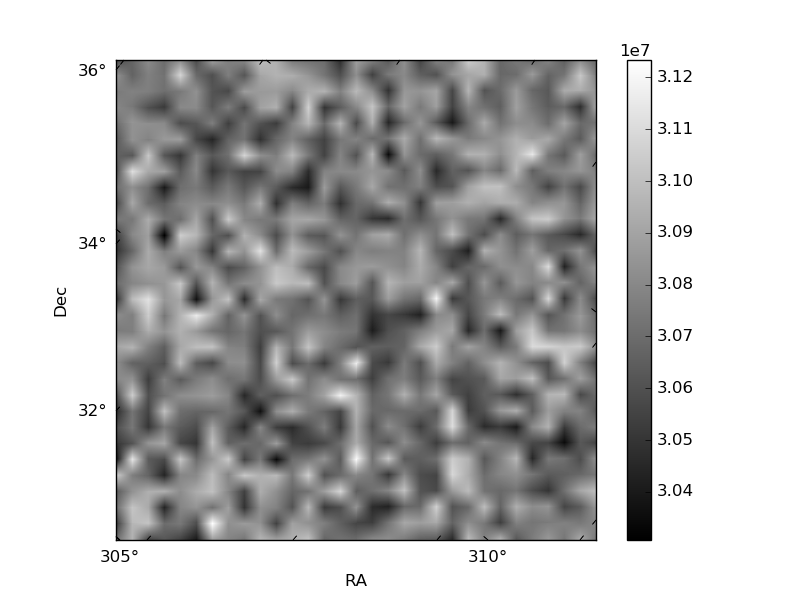
Quadrant B |
|---|---|---|---|
| Quadrant D | 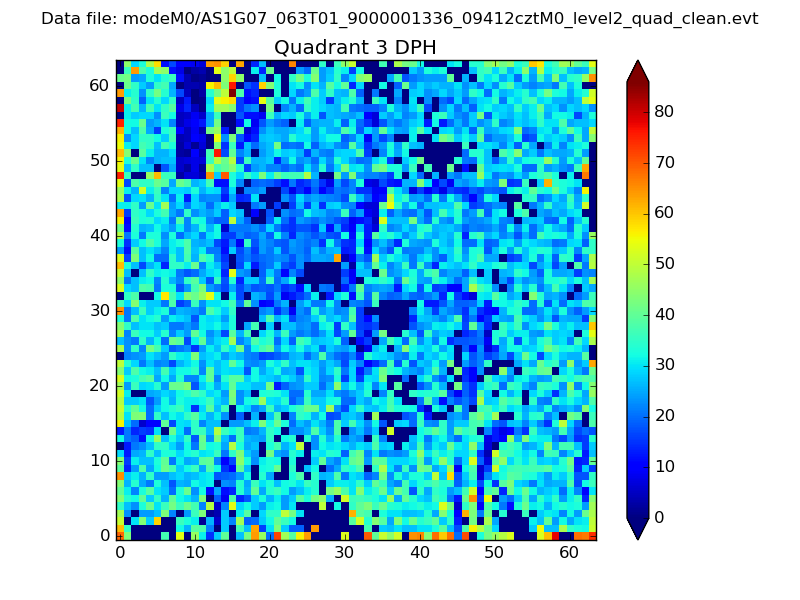 |
 |
Quadrant C |
| Plot type | Count rate plots | Images |
|---|---|---|
| Comparison with Poisson distribution Blue bars denote a histogram of data divided into 1 sec bins. Red curve is a Poisson curve with rate = median count rate of data. |
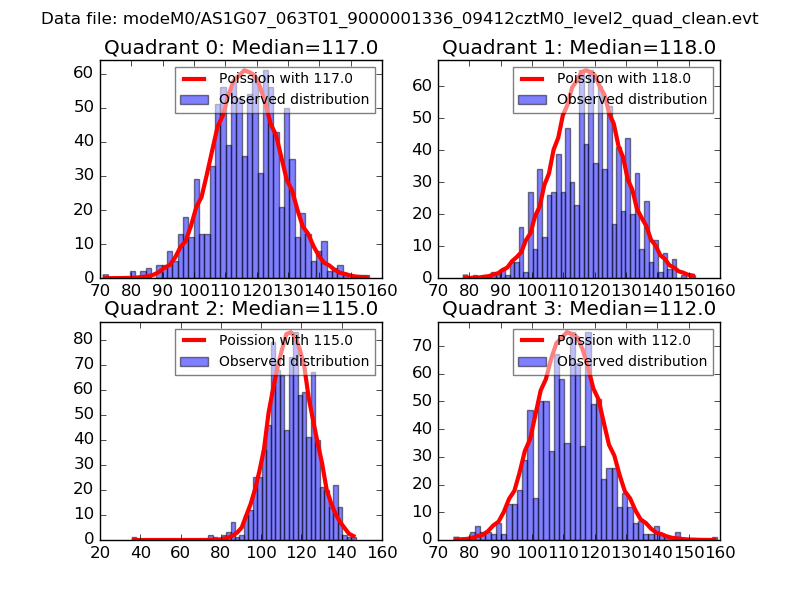 |
 |
| Quadrant-wise count rates Data is divided into 100 sec bins |
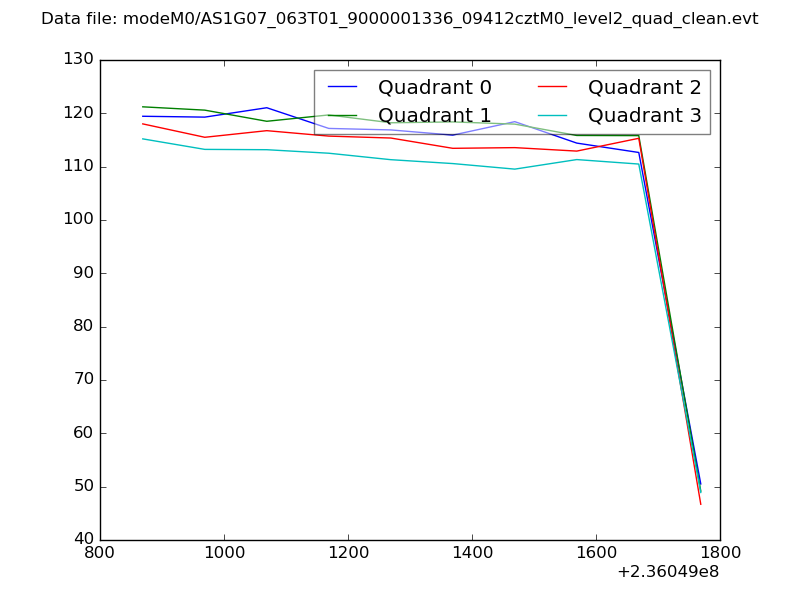 |
|
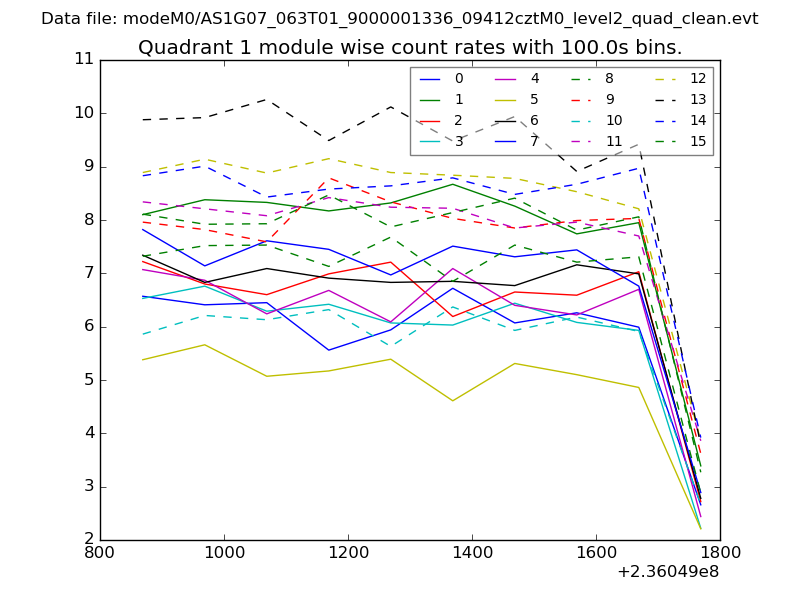
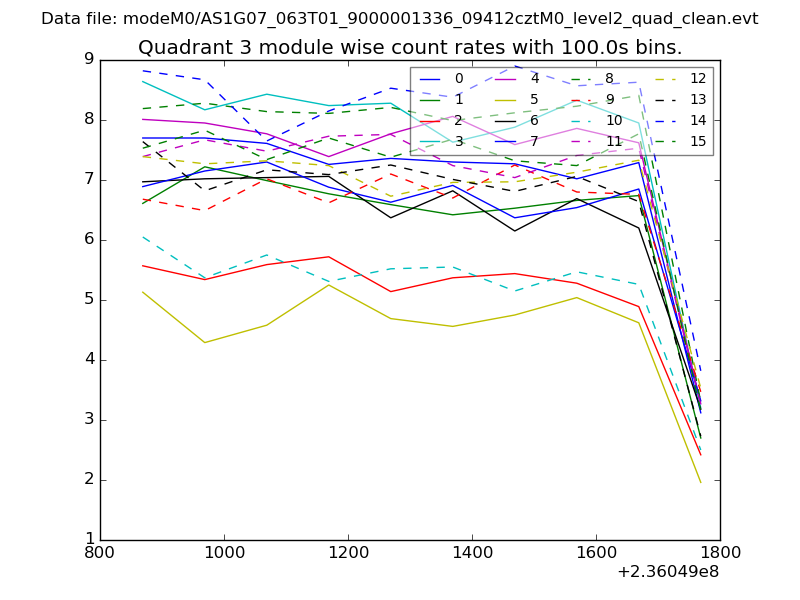
| Module-wise count rates for Quadrant A Data is divided into 100 sec bins |
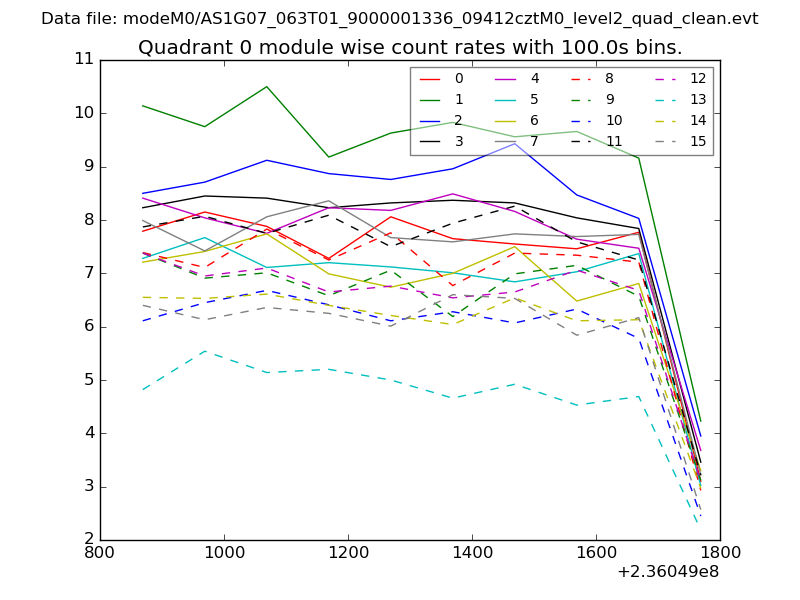 |
 |
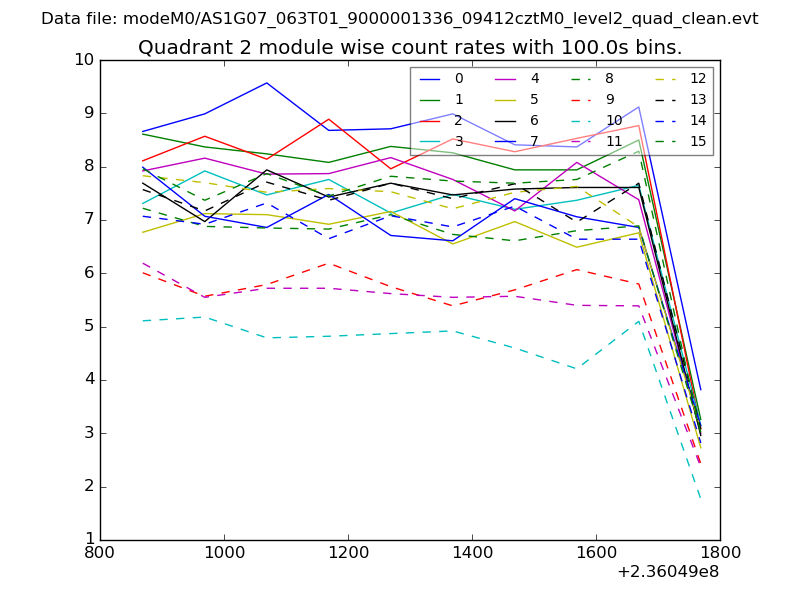
| Module-wise count rates for Quadrant B Data is divided into 100 sec bins |
 |
 |
| Module-wise count rates for Quadrant C Data is divided into 100 sec bins |
 |
 |
| Module-wise count rates for Quadrant D Data is divided into 100 sec bins |
 |
 |
| Parameter | Plot |
|---|---|
| CZT HV Monitor | 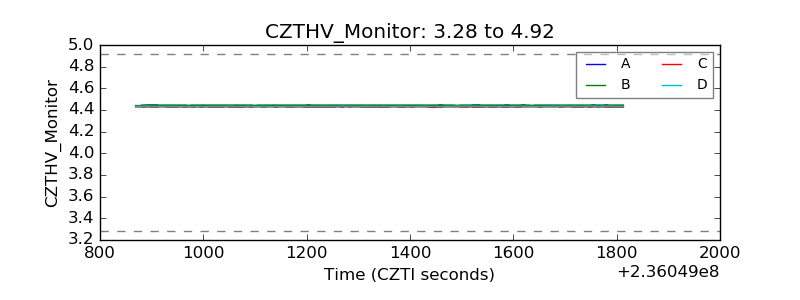 |
| D_VDD | 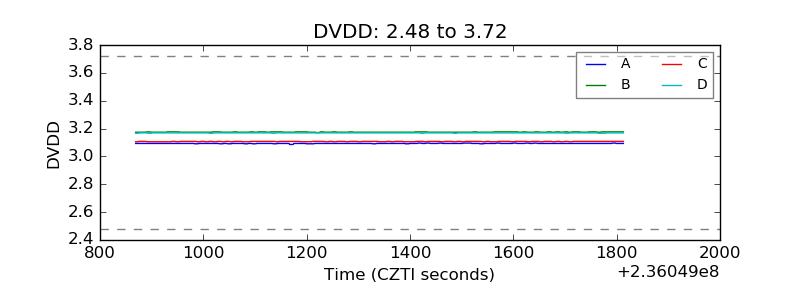 |
| Temperature 1 | 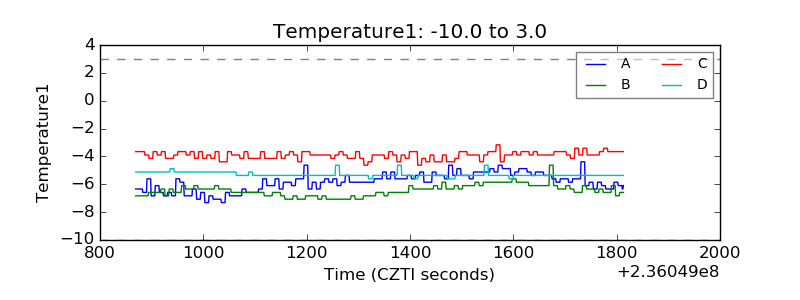 |
| Veto HV Monitor | 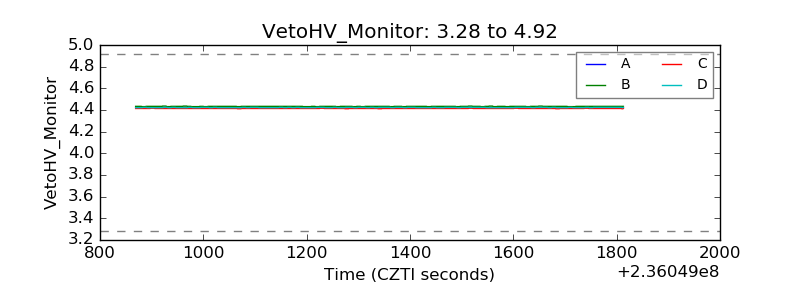 |
| Veto LLD | 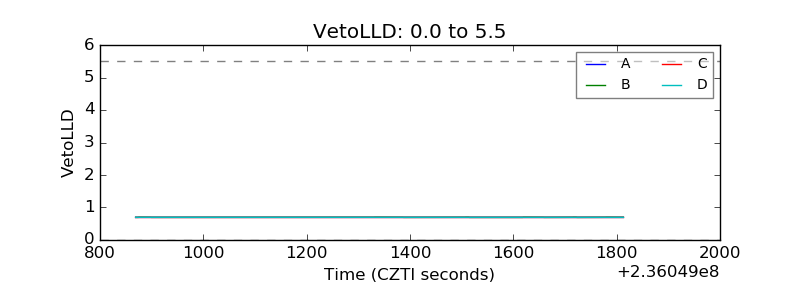 |
| Alpha Counter | 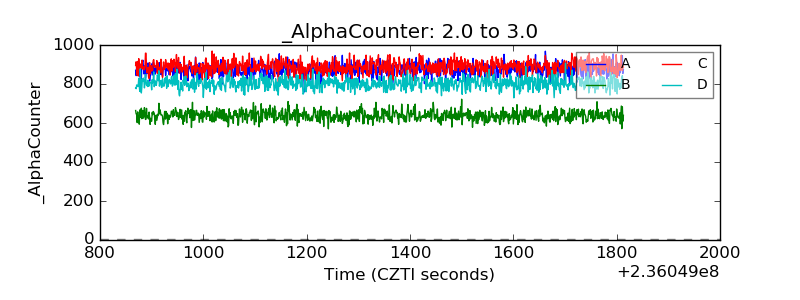 |
| _CPM_Rate | 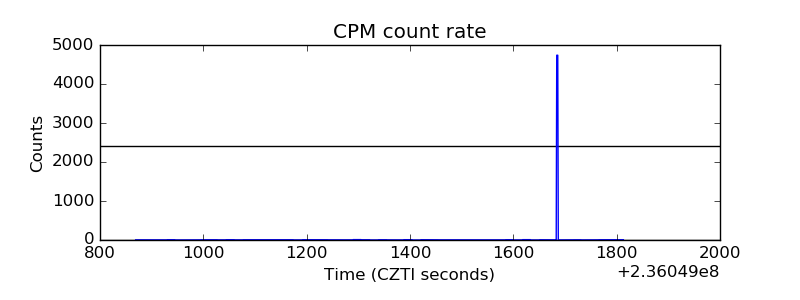 |
| CZT Counter |  |
| +2.5 Volts monitor |  |
| +5 Volts monitor |  |
| _ROLL_ROT | 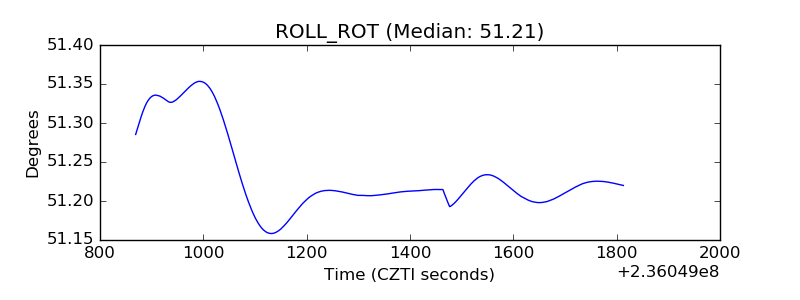 |
| _Roll_DEC | 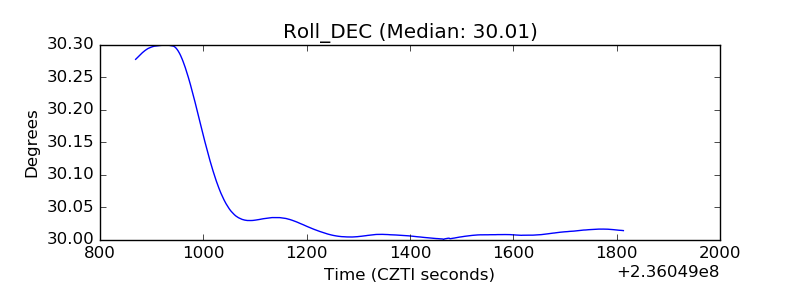 |
| _Roll_RA |  |
| Veto Counter | 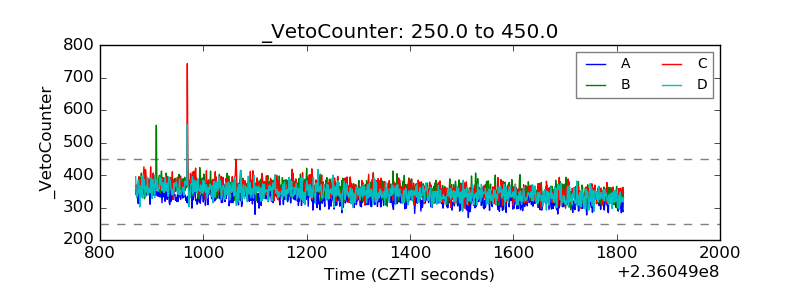 |