| Param | Original file | Final file |
|---|---|---|
| Filename | modeM0/AS1G07_063T01_9000001336_09417cztM0_level2.evt | modeM0/AS1G07_063T01_9000001336_09417cztM0_level2_quad_clean.evt |
| Size (bytes) | 1,122,428,160 | 139,135,680 |
| Size | 1.0 GB | 132.7 MB |
| Events in quadrant A | 8,640,088 | 846,030 |
| Events in quadrant B | 6,038,946 | 892,363 |
| Events in quadrant C | 10,260,670 | 758,166 |
| Events in quadrant D | 8,176,133 | 820,055 |
| Mode SS | |||
|---|---|---|---|
| Quadrant | BADHDUFLAG | Total packets | Discarded packets |
| A | 0 | 296 | 36 |
| B | 0 | 296 | 28 |
| C | 0 | 296 | 30 |
| D | 0 | 296 | 22 |
| Mode M9 | |||
|---|---|---|---|
| Quadrant | BADHDUFLAG | Total packets | Discarded packets |
| A | 0 | 10 | 0 |
| B | 0 | 10 | 0 |
| C | 0 | 10 | 0 |
| D | 0 | 10 | 1 |
| Mode M0 | |||
|---|---|---|---|
| Quadrant | BADHDUFLAG | Total packets | Discarded packets |
| A | 0 | 38995 | 4567 |
| B | 0 | 29672 | 2721 |
| C | 0 | 53677 | 14744 |
| D | 0 | 37277 | 3750 |
| Quadrant | Total seconds | Saturated seconds | Saturation percentage |
|---|---|---|---|
| A | 12975 | 206 | 1.587669% |
| B | 13301 | 90 | 0.676641% |
| C | 12330 | 1937 | 15.709651% |
| D | 13151 | 504 | 3.832408% |
Noise dominated data is calculated using 1-second bins in cleaned event files. If a bin has >2000 counts, and if more than 50% of those come from <1% of pixels, then it is considered to be noise-dominated and hence unusable.
| Quadrant | # 1 sec bins | Bins with >0 counts | Bins with >2000 counts | High rate bins dominated by noise | Noise dominated (total time) | Noise dominated (detector-on time) | Marked lightcurve |
|---|---|---|---|---|---|---|---|
| A | 15687 | 14056 | 48 | 48 | 0.31% | 0.34% | 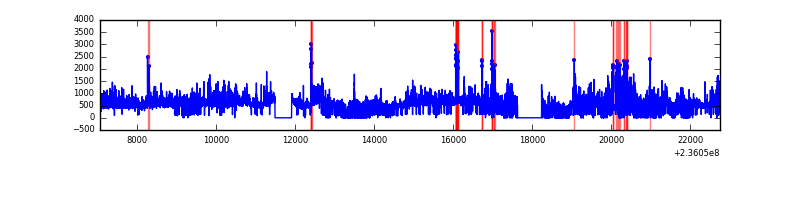 |
| B | 15688 | 14180 | 0 | 0 | 0.00% | 0.00% | 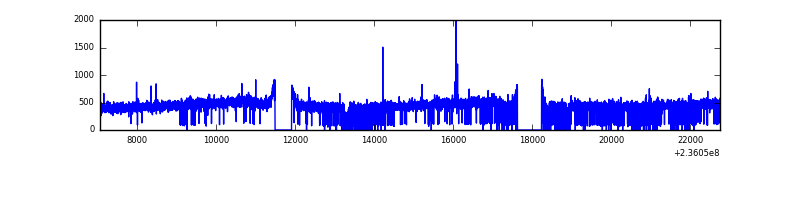 |
| C | 15688 | 13357 | 1357 | 1357 | 8.65% | 10.16% | 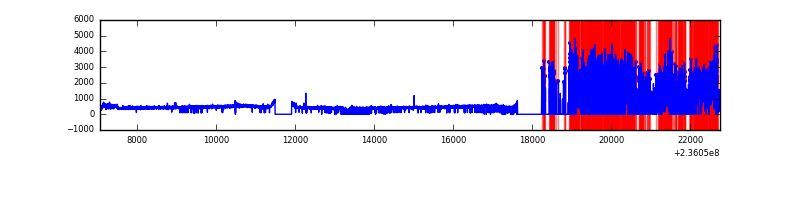 |
| D | 15688 | 14147 | 356 | 356 | 2.27% | 2.52% | 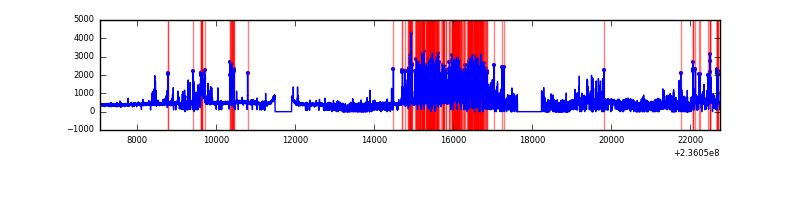 |
Top three noisy pixels from each quadrant. If the there are fewer than three noisy pixels in the level2.evt file, extra rows are filled as -1
| Pixel properties | Quadrant properties | ||||||
|---|---|---|---|---|---|---|---|
| Quadrant | DetID | PixID | Counts | Sigma | Mean | Median | Sigma |
| A | 8 | 5 | 2726046 | 8825.36 | 1499 | 1466 | 308.7 |
| A | 1 | 162 | 79275 | 252.04 | 1499 | 1466 | 308.7 |
| A | 1 | 178 | 25380 | 77.46 | 1499 | 1466 | 308.7 |
| B | 12 | 111 | 34873 | 111.9 | 1545 | 1505 | 298.2 |
| B | 11 | 111 | 28376 | 90.12 | 1545 | 1505 | 298.2 |
| B | 14 | 111 | 21247 | 66.21 | 1545 | 1505 | 298.2 |
| C | 4 | 254 | 5149537 | 17272.32 | 1288 | 1294 | 298.1 |
| C | 9 | 68 | 77568 | 255.9 | 1288 | 1294 | 298.1 |
| C | 13 | 61 | 9681 | 28.14 | 1288 | 1294 | 298.1 |
| D | 1 | 52 | 2027285 | 5442.61 | 1458 | 1424 | 372.2 |
| D | 13 | 122 | 458895 | 1229.03 | 1458 | 1424 | 372.2 |
| D | 8 | 195 | 61604 | 161.68 | 1458 | 1424 | 372.2 |
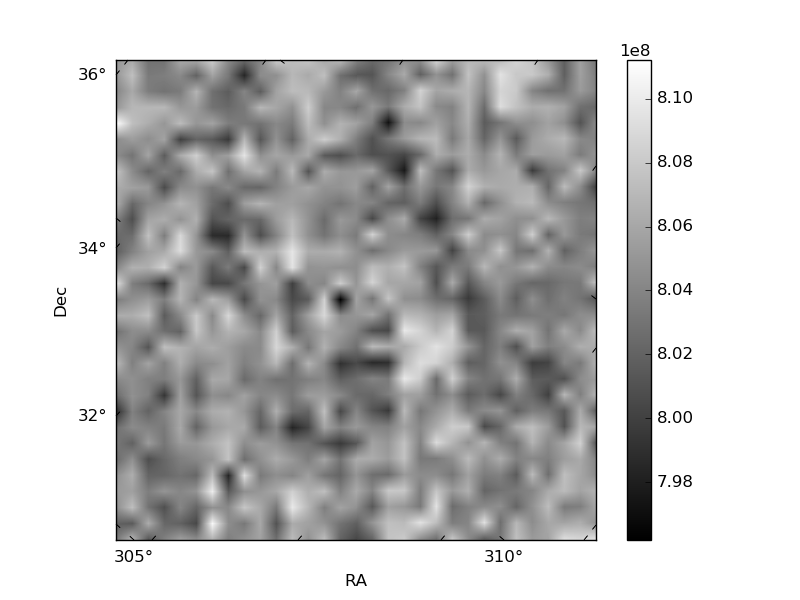
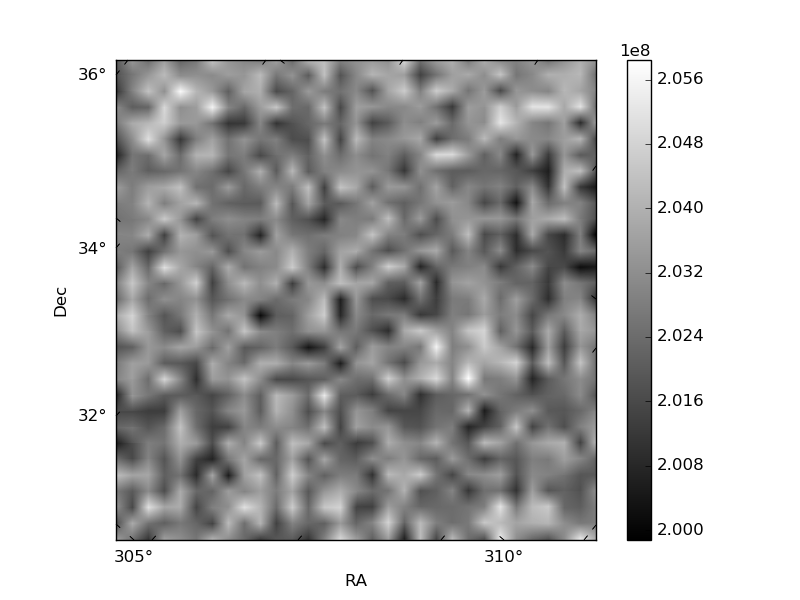
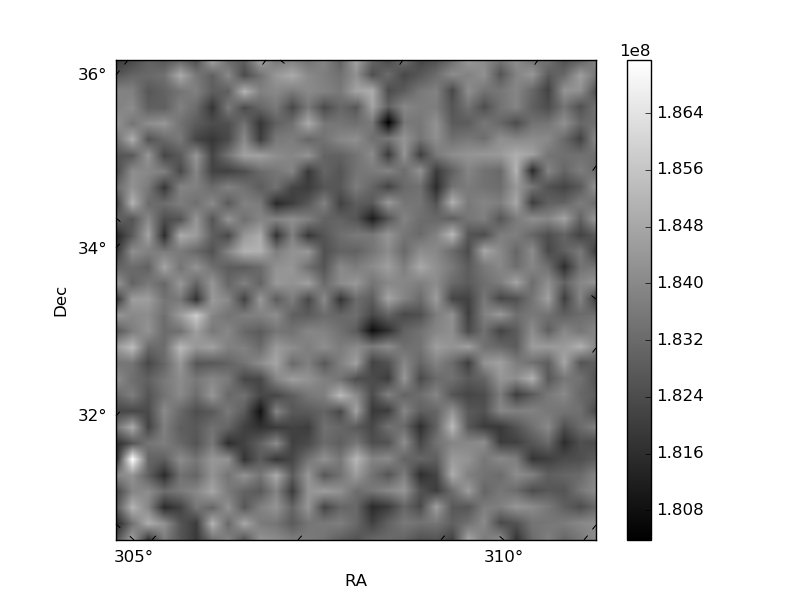
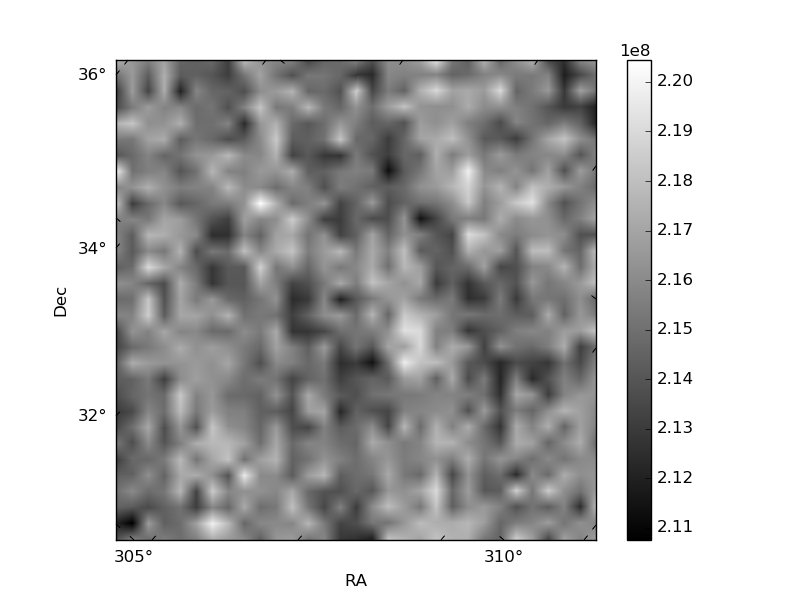
Histogram calculated using DETX and DETY for each event in the final _common_clean file
| Quadrant A |  |
 |
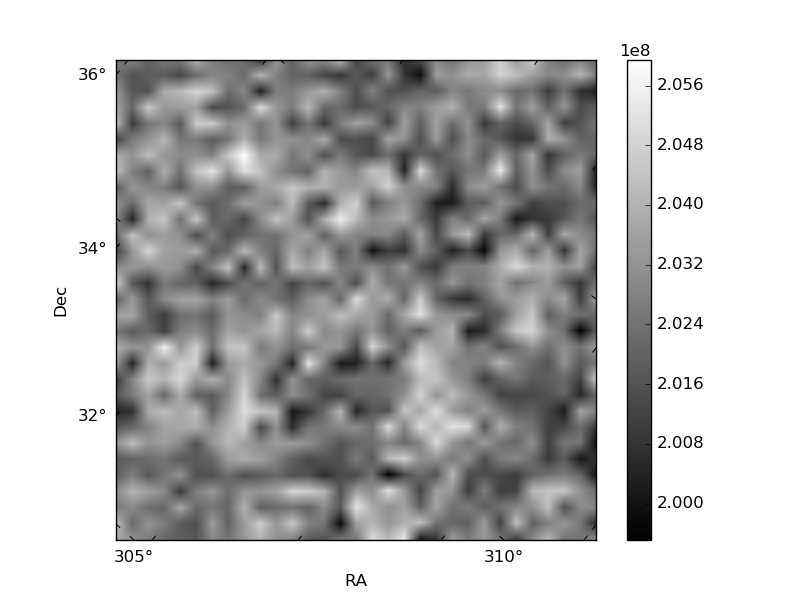
Quadrant B |
|---|---|---|---|
| Quadrant D |  |
 |
Quadrant C |
| Plot type | Count rate plots | Images |
|---|---|---|
| Comparison with Poisson distribution Blue bars denote a histogram of data divided into 1 sec bins. Red curve is a Poisson curve with rate = median count rate of data. |
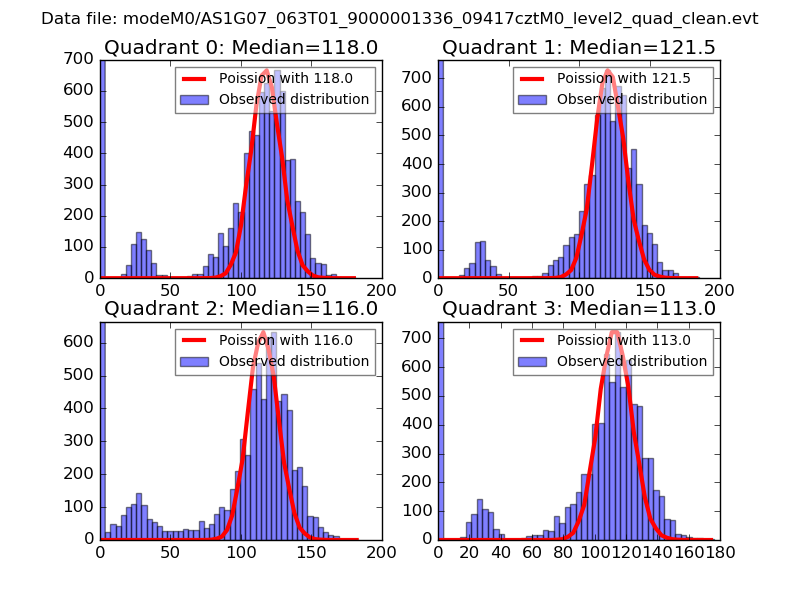 |
 |
| Quadrant-wise count rates Data is divided into 100 sec bins |
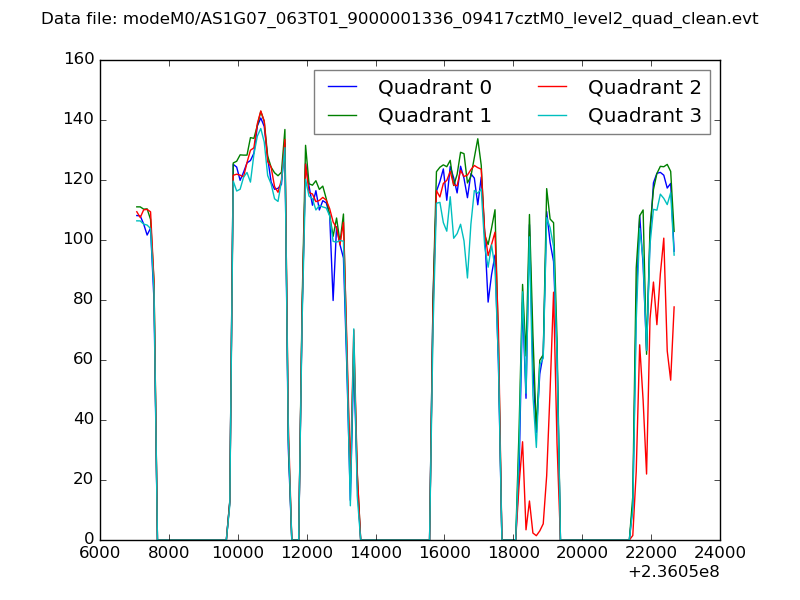 |
|
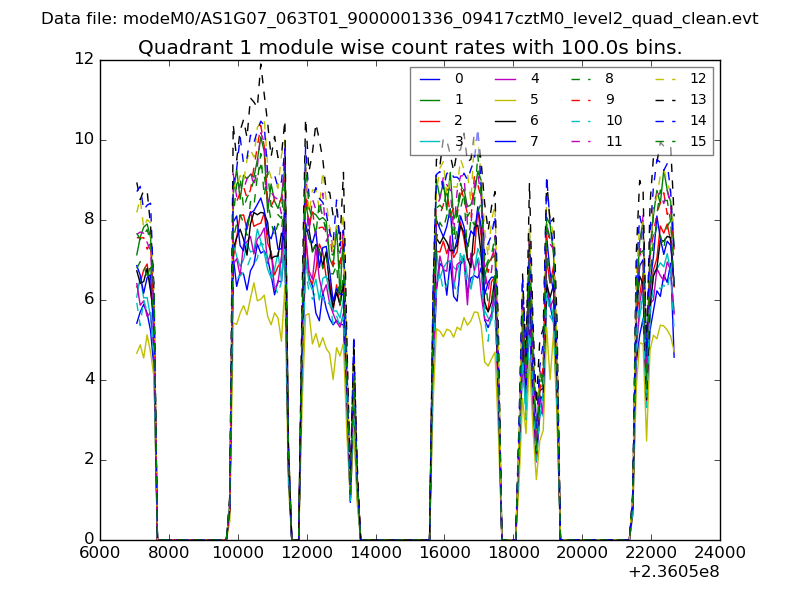
| Module-wise count rates for Quadrant A Data is divided into 100 sec bins |
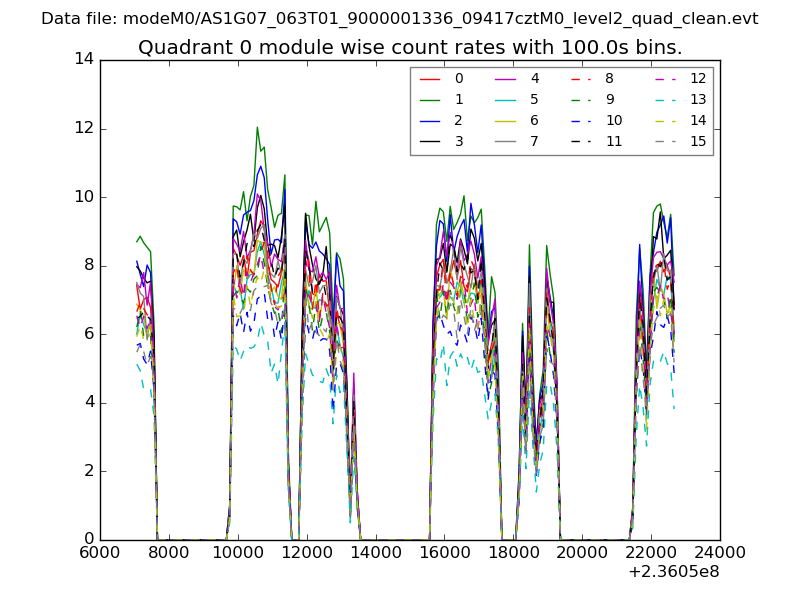 |
 |
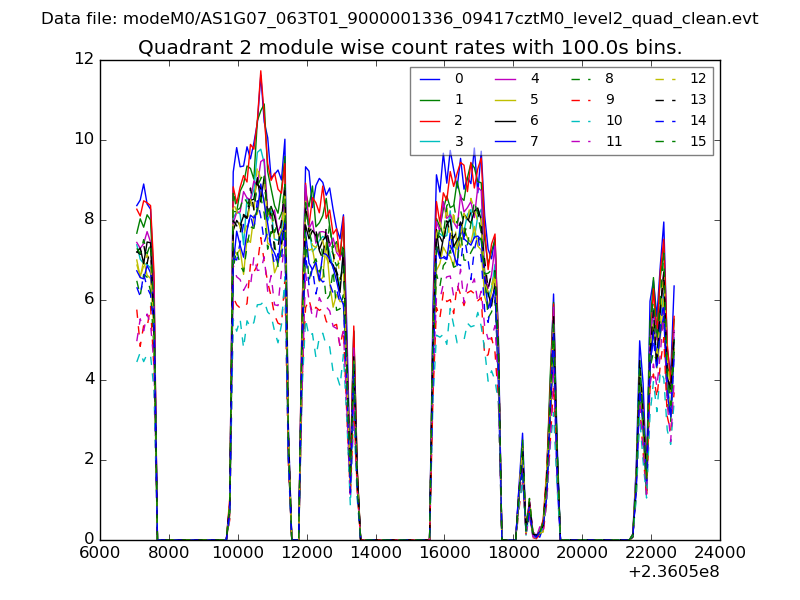
| Module-wise count rates for Quadrant B Data is divided into 100 sec bins |
 |
 |
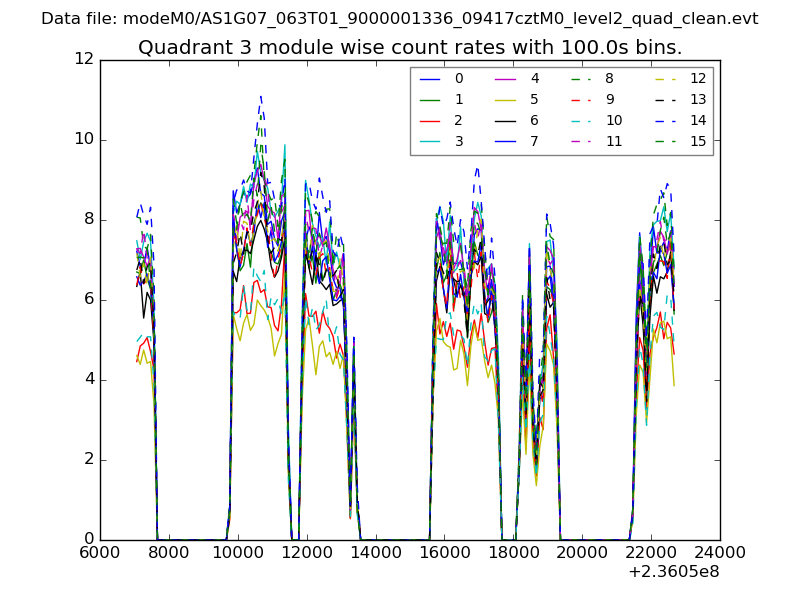
| Module-wise count rates for Quadrant C Data is divided into 100 sec bins |
 |
 |
| Module-wise count rates for Quadrant D Data is divided into 100 sec bins |
 |
 |
| Parameter | Plot |
|---|---|
| CZT HV Monitor |  |
| D_VDD | 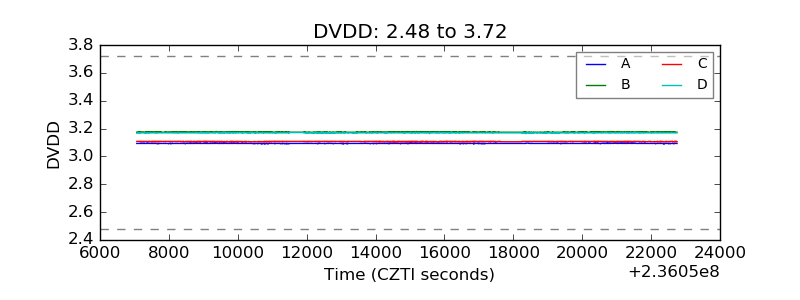 |
| Temperature 1 | 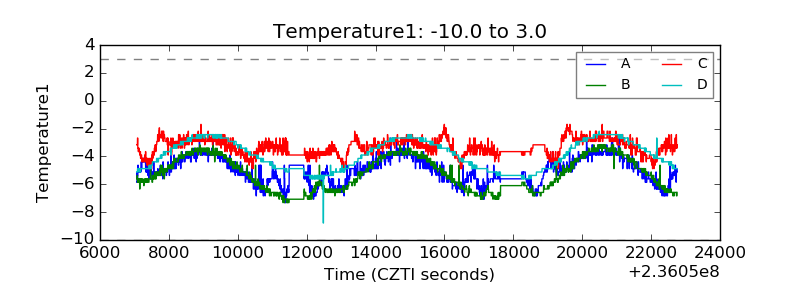 |
| Veto HV Monitor | 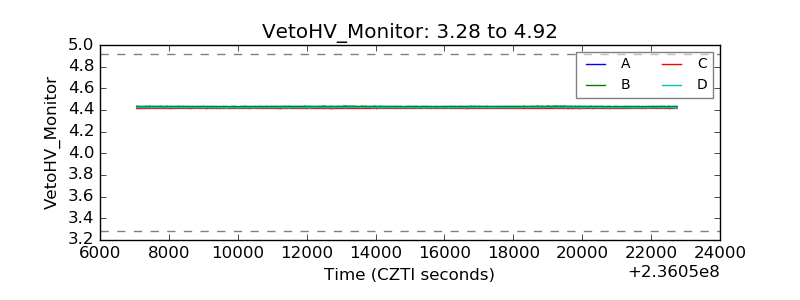 |
| Veto LLD | 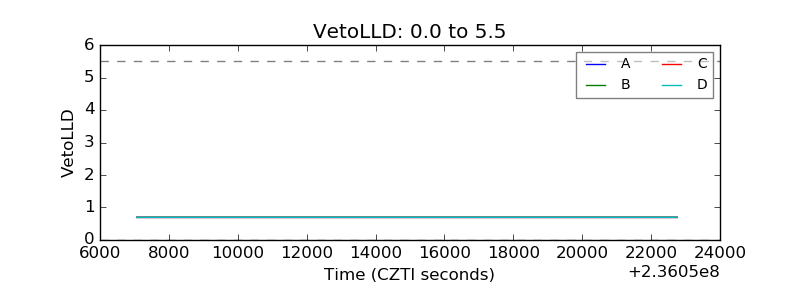 |
| Alpha Counter | 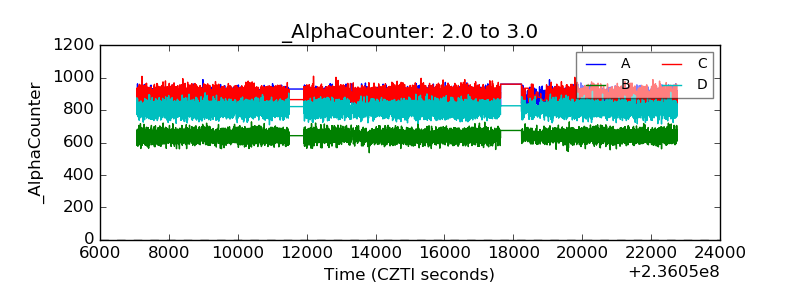 |
| _CPM_Rate | 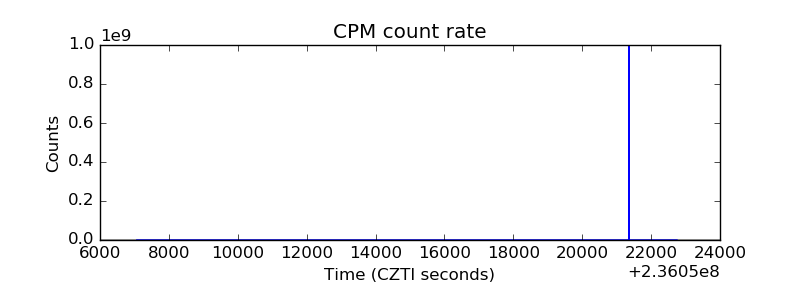 |
| CZT Counter | 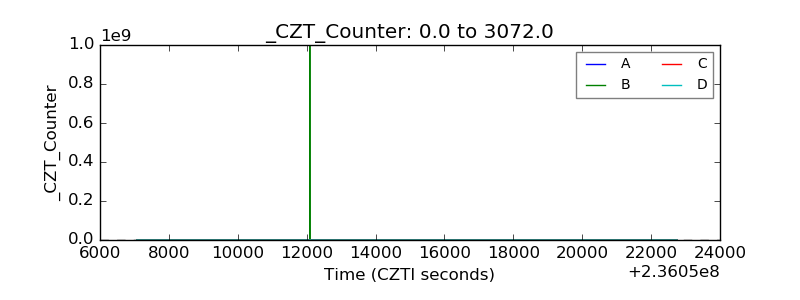 |
| +2.5 Volts monitor |  |
| +5 Volts monitor |  |
| _ROLL_ROT | 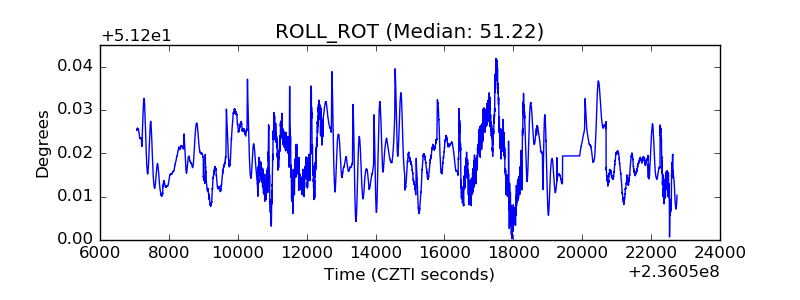 |
| _Roll_DEC | 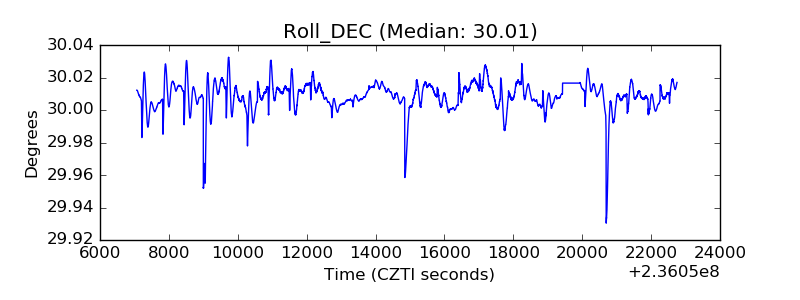 |
| _Roll_RA | 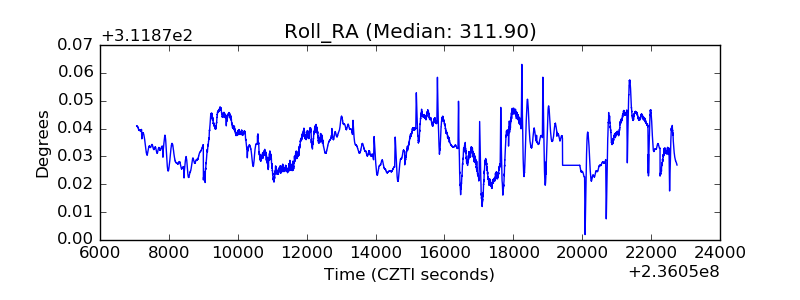 |
| Veto Counter | 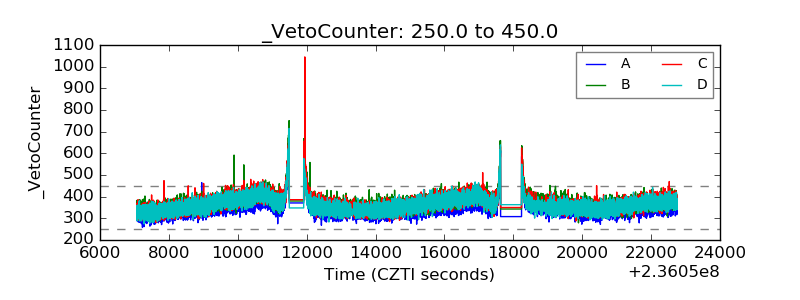 |