| Param | Original file | Final file |
|---|---|---|
| Filename | modeM0/AS1C02_045T01_9000001342cztM0_level2.fits | modeM0/AS1C02_045T01_9000001342cztM0_level2_quad_clean.evt |
| Size (bytes) | 174,870,720 | 158,924,160 |
| Size | 166.8 MB | 151.6 MB |
| Events in quadrant A | 1,040,930 | 904,464 |
| Events in quadrant B | 1,003,322 | 898,886 |
| Events in quadrant C | 1,025,574 | 870,456 |
| Events in quadrant D | 902,896 | 815,233 |
| Mode SS | |||
|---|---|---|---|
| Quadrant | BADHDUFLAG | Total packets | Discarded packets |
| A | 0 | 398 | 0 |
| B | 0 | 394 | 0 |
| C | 0 | 390 | 0 |
| D | 0 | 396 | 0 |
| Mode M9 | |||
|---|---|---|---|
| Quadrant | BADHDUFLAG | Total packets | Discarded packets |
| A | 1 | 140397449234472 | 140393890971694 |
| B | 1 | 140397449234472 | 140393890971694 |
| C | 1 | 140397449234472 | 140393890971694 |
| D | 1 | 140397449234472 | 140393890971694 |
| Mode M0 | |||
|---|---|---|---|
| Quadrant | BADHDUFLAG | Total packets | Discarded packets |
| A | 0 | 45203 | 0 |
| B | 0 | 40341 | 0 |
| C | 0 | 39982 | 0 |
| D | 0 | 42567 | 0 |
| Quadrant | Total seconds | Saturated seconds | Saturation percentage |
|---|---|---|---|
| A | 19170 | 224 | 1.168492% |
| B | 19207 | 192 | 0.999636% |
| C | 19180 | 105 | 0.547445% |
| D | 19199 | 217 | 1.130267% |
Noise dominated data is calculated using 1-second bins in cleaned event files. If a bin has >2000 counts, and if more than 50% of those come from <1% of pixels, then it is considered to be noise-dominated and hence unusable.
| Quadrant | # 1 sec bins | Bins with >0 counts | Bins with >2000 counts | High rate bins dominated by noise | Noise dominated (total time) | Noise dominated (detector-on time) | Marked lightcurve |
|---|---|---|---|---|---|---|---|
| A | 22530 | 19309 | 0 | 0 | 0.00% | 0.00% |  |
| B | 22554 | 19369 | 0 | 0 | 0.00% | 0.00% |  |
| C | 22550 | 19348 | 0 | 0 | 0.00% | 0.00% |  |
| D | 22535 | 19363 | 0 | 0 | 0.00% | 0.00% |  |
Top three noisy pixels from each quadrant. If the there are fewer than three noisy pixels in the level2.evt file, extra rows are filled as -1
| Pixel properties | Quadrant properties | ||||||
|---|---|---|---|---|---|---|---|
| Quadrant | DetID | PixID | Counts | Sigma | Mean | Median | Sigma |
| A | 0 | 29 | 978 | 10.4 | 271 | 254 | 69.6 |
| A | 7 | 110 | 885 | 9.06 | 271 | 254 | 69.6 |
| A | 0 | 30 | 786 | 7.64 | 271 | 254 | 69.6 |
| B | 2 | 9 | 857 | 11.01 | 265 | 252 | 54.9 |
| B | 14 | 254 | 725 | 8.6 | 265 | 252 | 54.9 |
| B | 2 | 8 | 663 | 7.47 | 265 | 252 | 54.9 |
| C | 2 | 191 | 745 | 6.86 | 270 | 252 | 71.8 |
| C | 7 | 111 | 720 | 6.51 | 270 | 252 | 71.8 |
| C | 12 | 241 | 719 | 6.5 | 270 | 252 | 71.8 |
| D | 3 | 14 | 683 | 6.5 | 255 | 232 | 69.4 |
| D | 6 | 231 | 668 | 6.28 | 255 | 232 | 69.4 |
| D | 7 | 5 | 645 | 5.95 | 255 | 232 | 69.4 |
Histogram calculated using DETX and DETY for each event in the final _common_clean file
| Quadrant A |  |
 |
Quadrant B |
|---|---|---|---|
| Quadrant D |  |
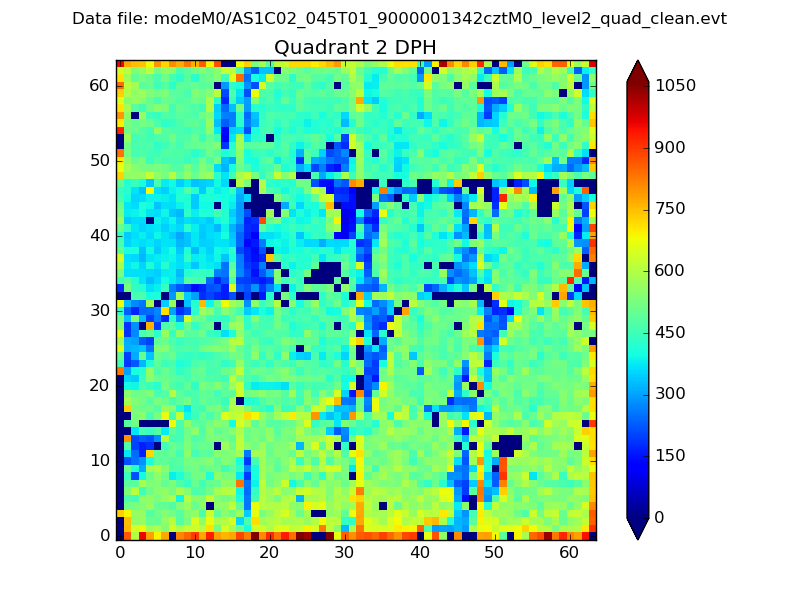 |
Quadrant C |
| Plot type | Count rate plots | Images |
|---|---|---|
| Comparison with Poisson distribution Blue bars denote a histogram of data divided into 1 sec bins. Red curve is a Poisson curve with rate = median count rate of data. |
 |
 |
| Quadrant-wise count rates Data is divided into 100 sec bins |
 |
|
| Module-wise count rates for Quadrant A Data is divided into 100 sec bins |
 |
 |
| Module-wise count rates for Quadrant B Data is divided into 100 sec bins |
 |
 |
| Module-wise count rates for Quadrant C Data is divided into 100 sec bins |
 |
 |
| Module-wise count rates for Quadrant D Data is divided into 100 sec bins |
 |
 |
| Parameter | Plot |
|---|---|
| CZT HV Monitor |  |
| D_VDD | 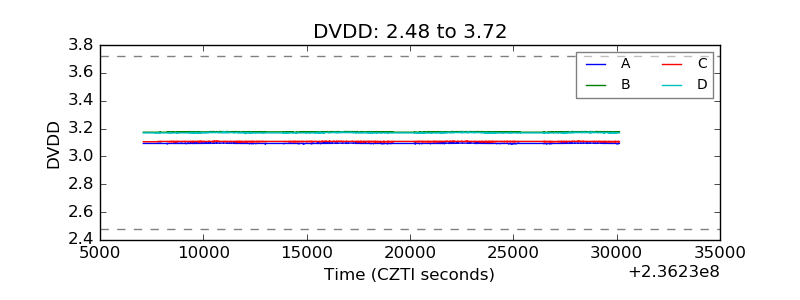 |
| Temperature 1 |  |
| Veto HV Monitor |  |
| Veto LLD |  |
| Alpha Counter |  |
| _CPM_Rate |  |
| CZT Counter |  |
| +2.5 Volts monitor |  |
| +5 Volts monitor |  |
| _ROLL_ROT |  |
| _Roll_DEC | 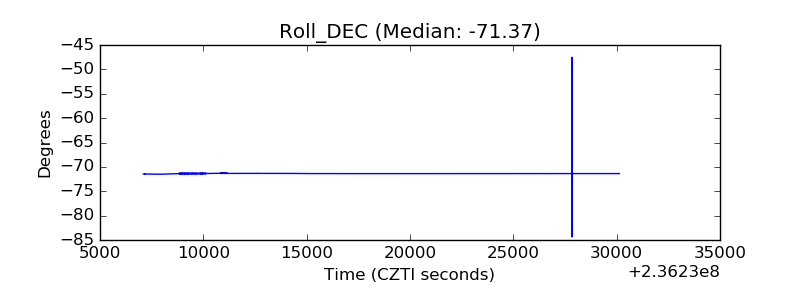 |
| _Roll_RA |  |
| Veto Counter |  |