| Param | Original file | Final file |
|---|---|---|
| Filename | modeM0/AS1C02_045T01_9000001342_09446cztM0_level2.evt | modeM0/AS1C02_045T01_9000001342_09446cztM0_level2_quad_clean.evt |
| Size (bytes) | 18,097,920 | 5,281,920 |
| Size | 17.3 MB | 5.0 MB |
| Events in quadrant A | 137,840 | 29,344 |
| Events in quadrant B | 137,074 | 36,732 |
| Events in quadrant C | 123,515 | 32,522 |
| Events in quadrant D | 127,350 | 33,439 |
| Mode SS | |||
|---|---|---|---|
| Quadrant | BADHDUFLAG | Total packets | Discarded packets |
| A | 0 | 16 | 10 |
| B | 0 | 16 | 8 |
| C | 0 | 16 | 12 |
| D | 0 | 16 | 12 |
| Mode M9 | |||
|---|---|---|---|
| Quadrant | BADHDUFLAG | Total packets | Discarded packets |
| A | 0 | 5 | 5 |
| B | 0 | 5 | 4 |
| C | 0 | 4 | 4 |
| D | 0 | 5 | 5 |
| Mode M0 | |||
|---|---|---|---|
| Quadrant | BADHDUFLAG | Total packets | Discarded packets |
| A | 0 | 1897 | 1338 |
| B | 0 | 1548 | 958 |
| C | 0 | 1550 | 1012 |
| D | 0 | 1553 | 986 |
| Quadrant | Total seconds | Saturated seconds | Saturation percentage |
|---|---|---|---|
| A | 242 | 2 | 0.826446% |
| B | 295 | 1 | 0.338983% |
| C | 269 | 1 | 0.371747% |
| D | 283 | 0 | 0.000000% |
Noise dominated data is calculated using 1-second bins in cleaned event files. If a bin has >2000 counts, and if more than 50% of those come from <1% of pixels, then it is considered to be noise-dominated and hence unusable.
| Quadrant | # 1 sec bins | Bins with >0 counts | Bins with >2000 counts | High rate bins dominated by noise | Noise dominated (total time) | Noise dominated (detector-on time) | Marked lightcurve |
|---|---|---|---|---|---|---|---|
| A | 765 | 348 | 0 | 0 | 0.00% | 0.00% | 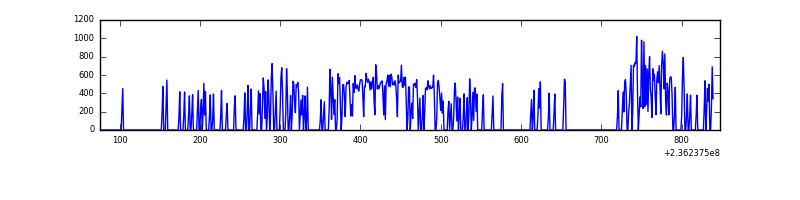 |
| B | 769 | 415 | 0 | 0 | 0.00% | 0.00% | 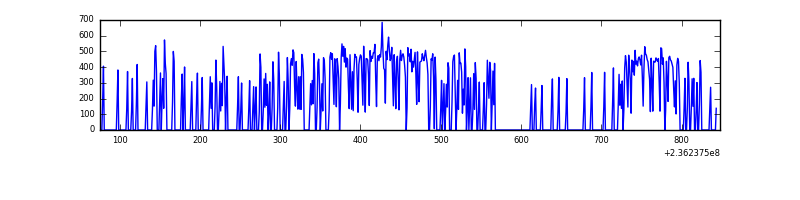 |
| C | 769 | 395 | 0 | 0 | 0.00% | 0.00% | 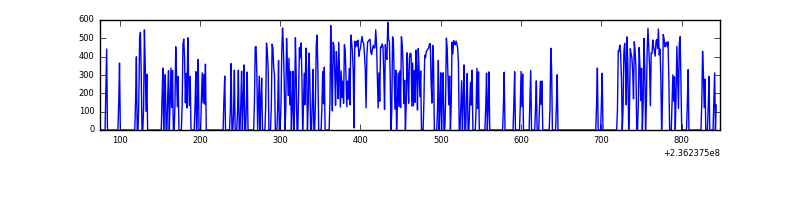 |
| D | 749 | 407 | 0 | 0 | 0.00% | 0.00% | 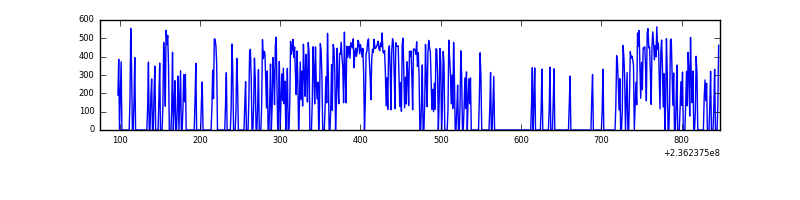 |
Top three noisy pixels from each quadrant. If the there are fewer than three noisy pixels in the level2.evt file, extra rows are filled as -1
| Pixel properties | Quadrant properties | ||||||
|---|---|---|---|---|---|---|---|
| Quadrant | DetID | PixID | Counts | Sigma | Mean | Median | Sigma |
| A | 8 | 5 | 21066 | 2673.0 | 28 | 27 | 7.9 |
| A | 1 | 162 | 4079 | 514.8 | 28 | 27 | 7.9 |
| A | 1 | 178 | 1504 | 187.65 | 28 | 27 | 7.9 |
| B | 0 | 219 | 1382 | 151.09 | 34 | 34 | 8.9 |
| B | 12 | 111 | 791 | 84.85 | 34 | 34 | 8.9 |
| B | 11 | 111 | 582 | 61.42 | 34 | 34 | 8.9 |
| C | 13 | 61 | 225 | 21.07 | 31 | 31 | 9.2 |
| C | 8 | 222 | 176 | 15.75 | 31 | 31 | 9.2 |
| C | 14 | 67 | 105 | 8.04 | 31 | 31 | 9.2 |
| D | 1 | 52 | 1757 | 178.7 | 32 | 31 | 9.7 |
| D | 2 | 234 | 983 | 98.57 | 32 | 31 | 9.7 |
| D | 7 | 9 | 942 | 94.32 | 32 | 31 | 9.7 |
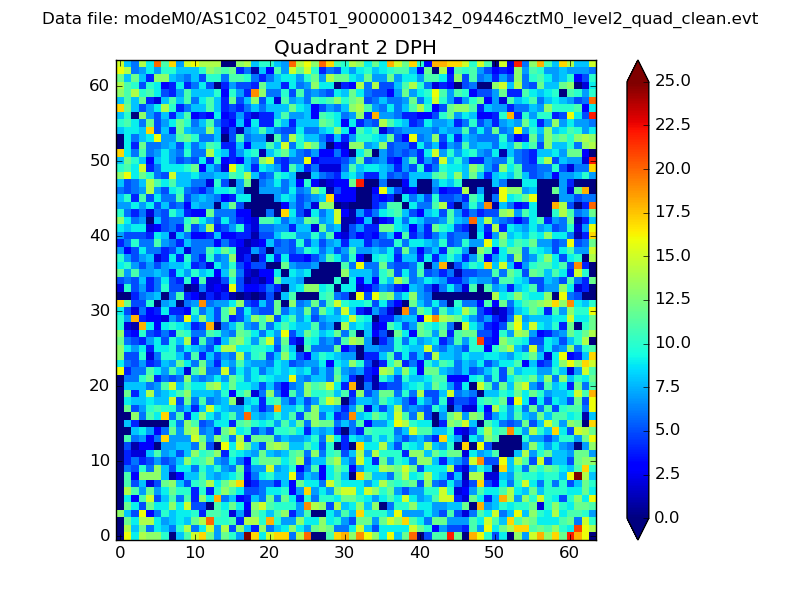
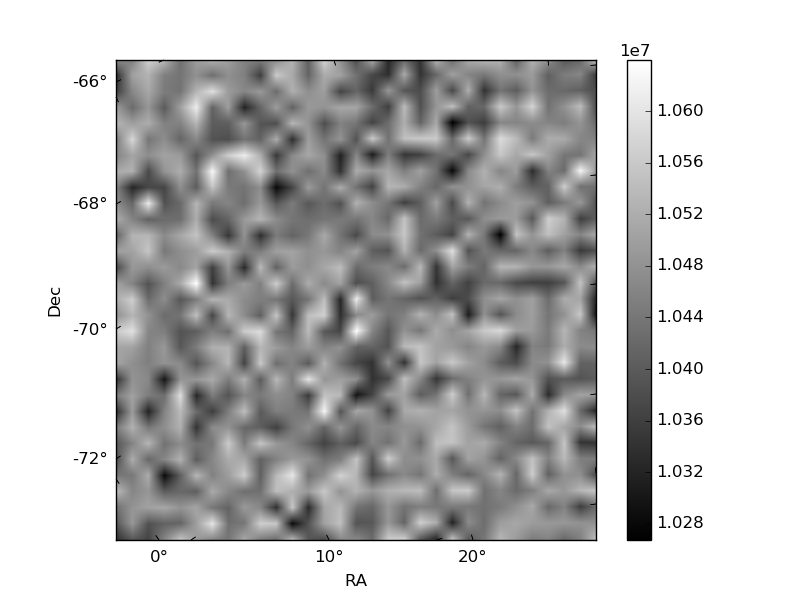
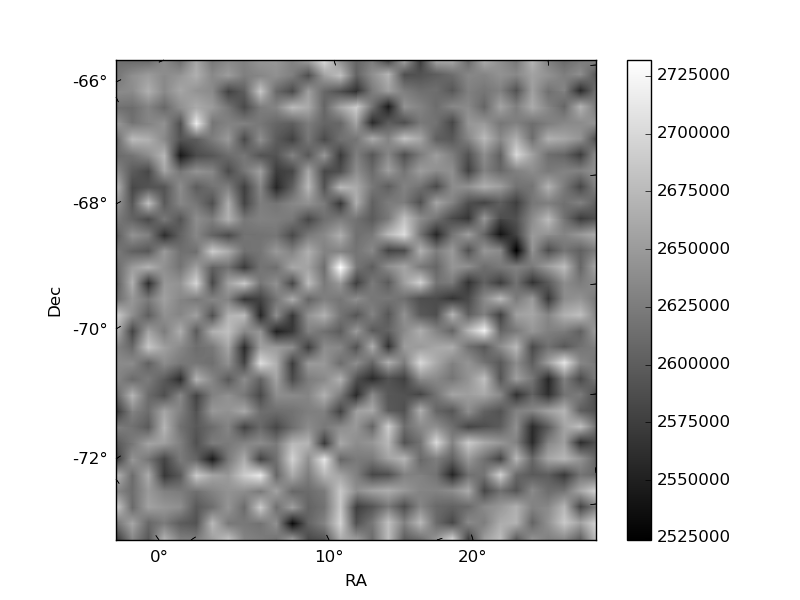
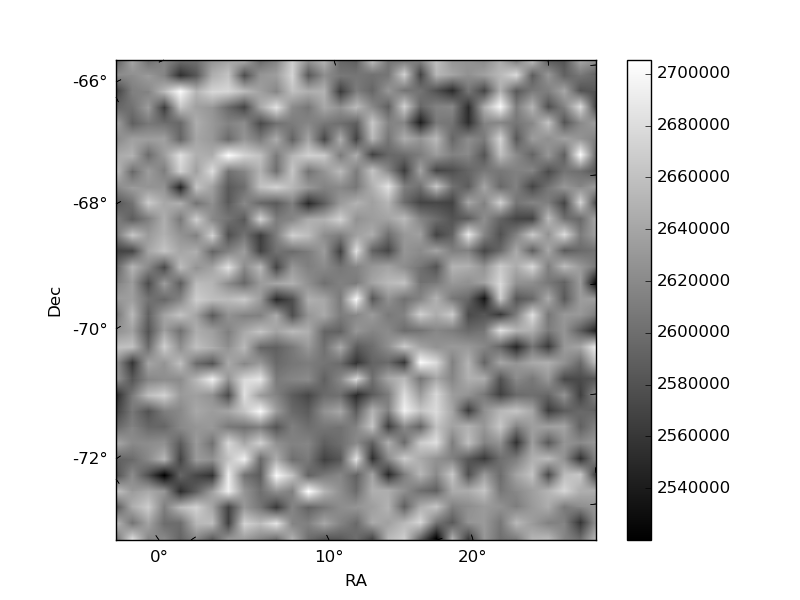
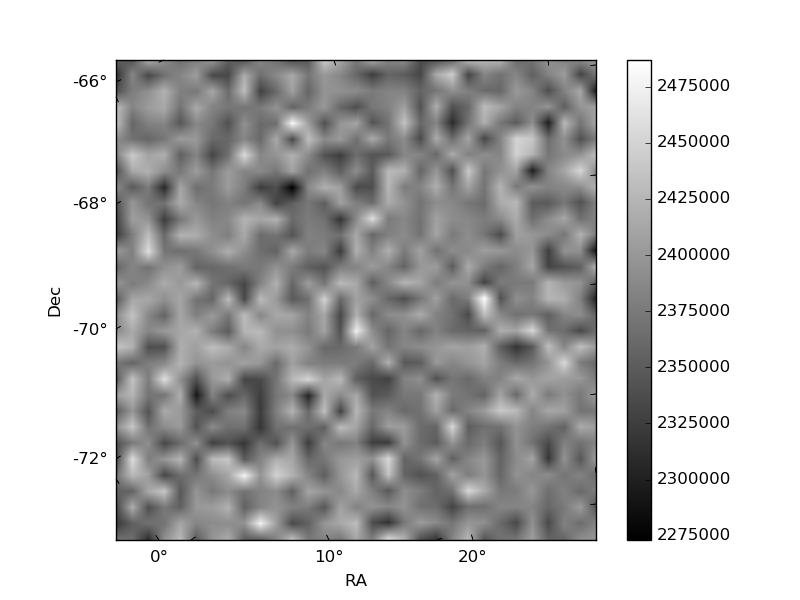
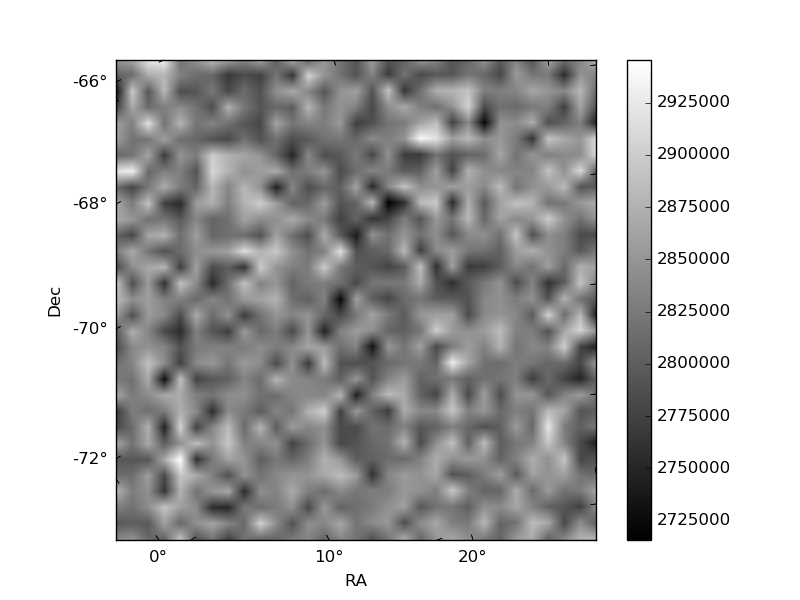
Histogram calculated using DETX and DETY for each event in the final _common_clean file
| Quadrant A | 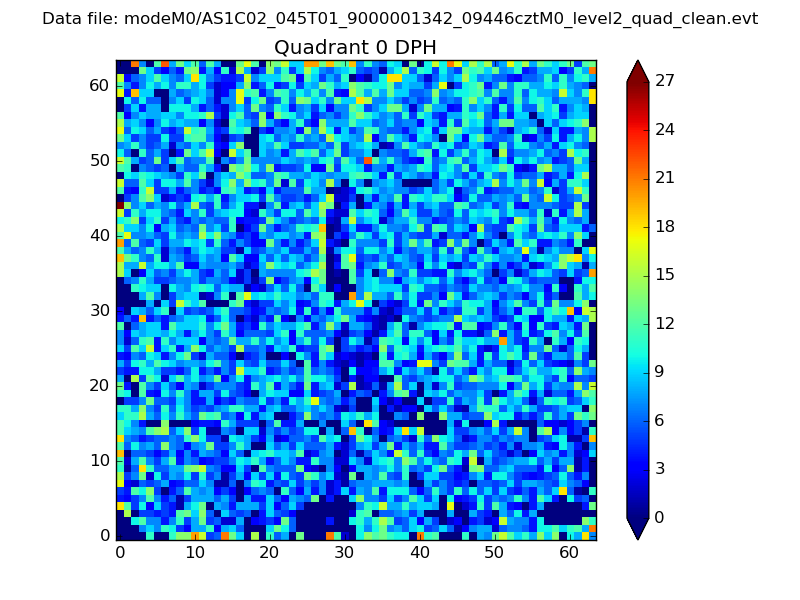 |
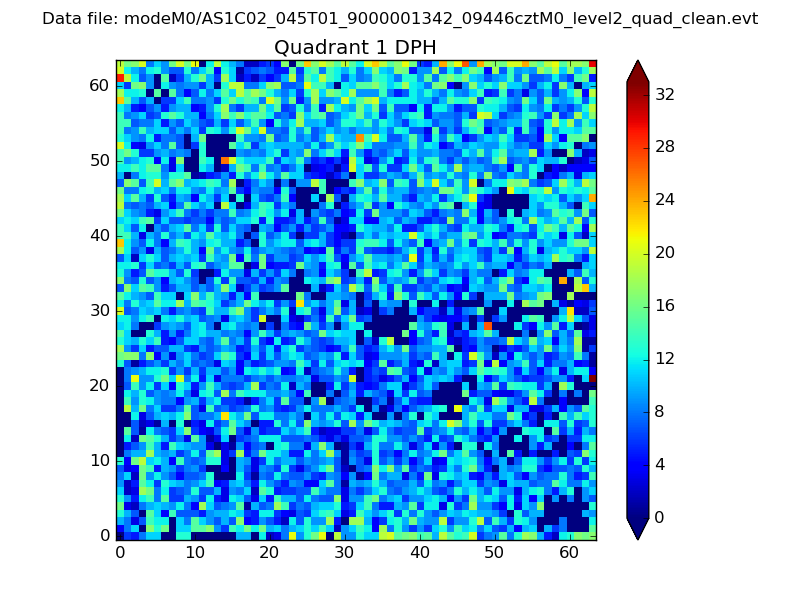 |
Quadrant B |
|---|---|---|---|
| Quadrant D | 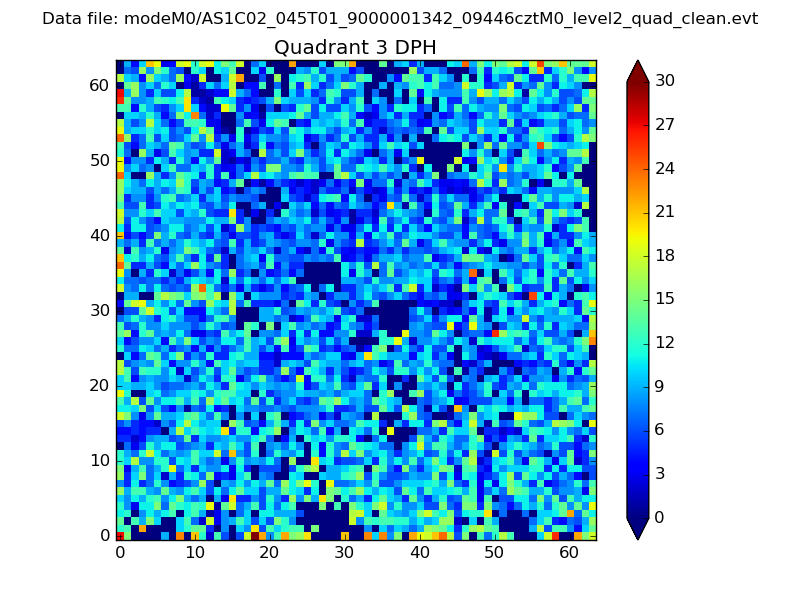 |
 |
Quadrant C |
| Plot type | Count rate plots | Images |
|---|---|---|
| Comparison with Poisson distribution Blue bars denote a histogram of data divided into 1 sec bins. Red curve is a Poisson curve with rate = median count rate of data. |
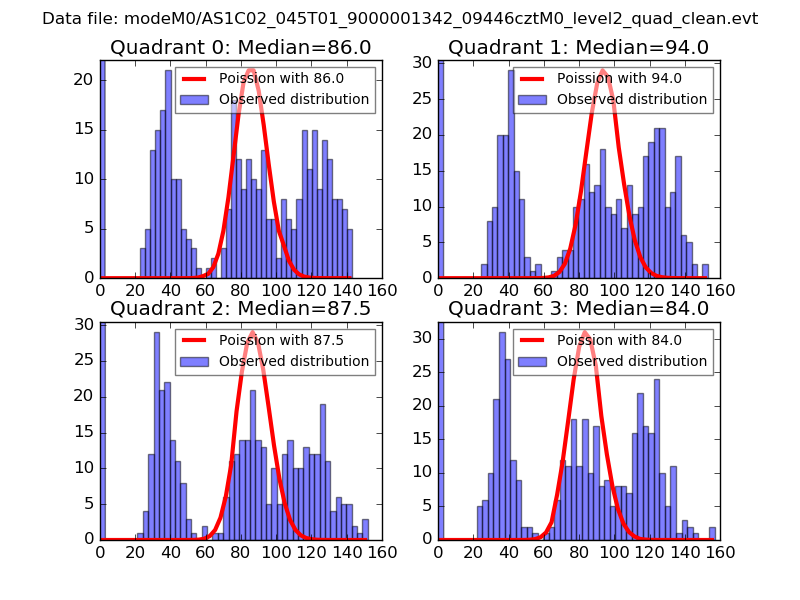 |
 |
| Quadrant-wise count rates Data is divided into 100 sec bins |
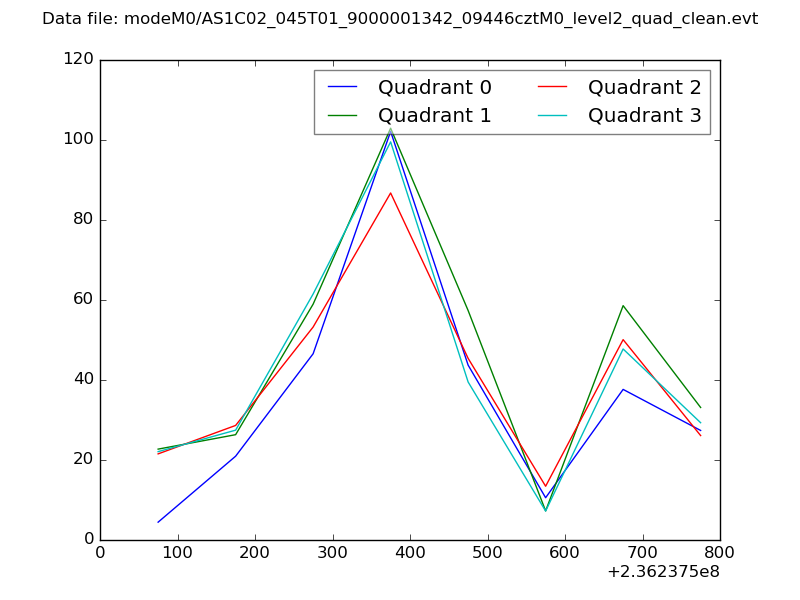 |
|
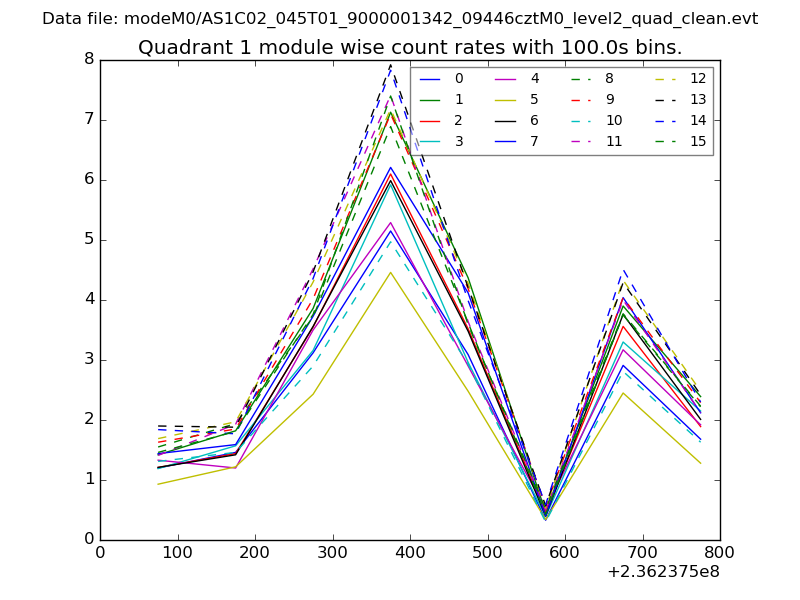
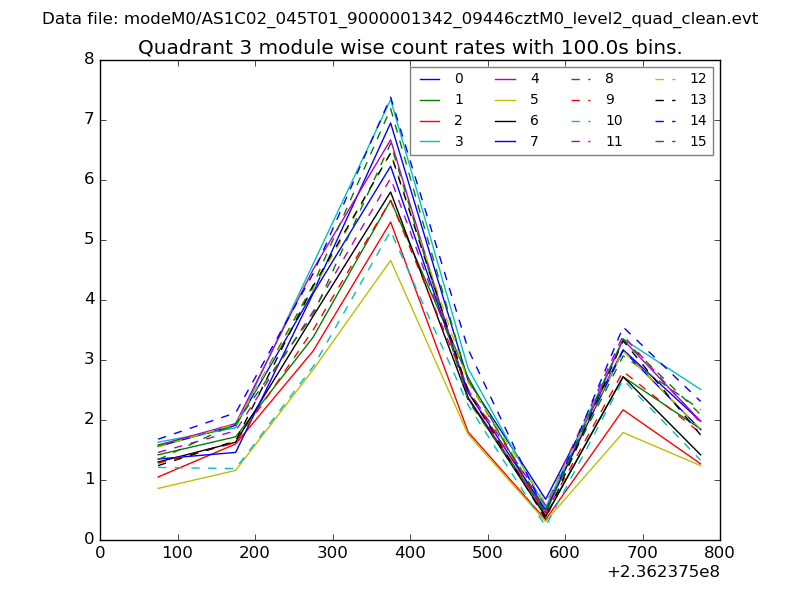
| Module-wise count rates for Quadrant A Data is divided into 100 sec bins |
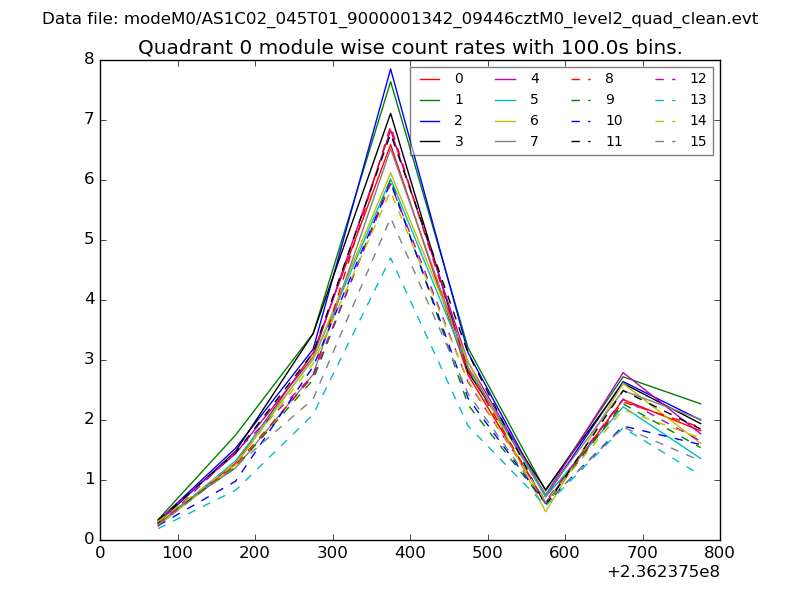 |
 |
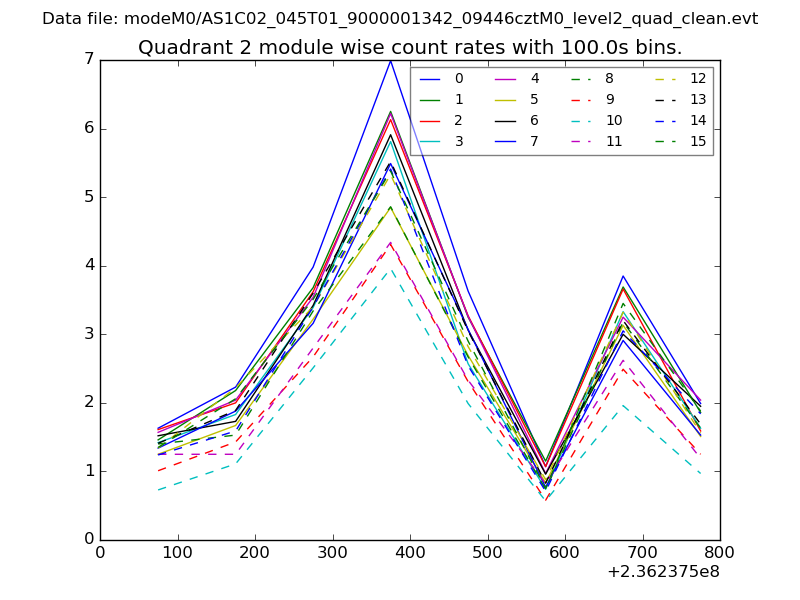
| Module-wise count rates for Quadrant B Data is divided into 100 sec bins |
 |
 |
| Module-wise count rates for Quadrant C Data is divided into 100 sec bins |
 |
 |
| Module-wise count rates for Quadrant D Data is divided into 100 sec bins |
 |
 |
| Parameter | Plot |
|---|---|
| CZT HV Monitor | 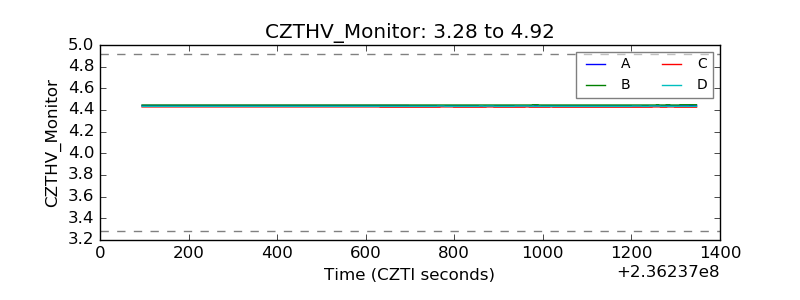 |
| D_VDD |  |
| Temperature 1 | 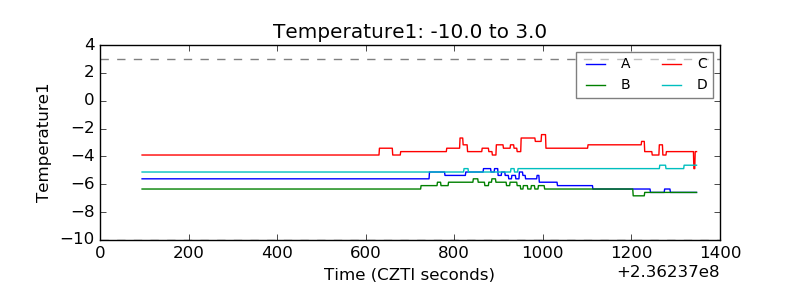 |
| Veto HV Monitor | 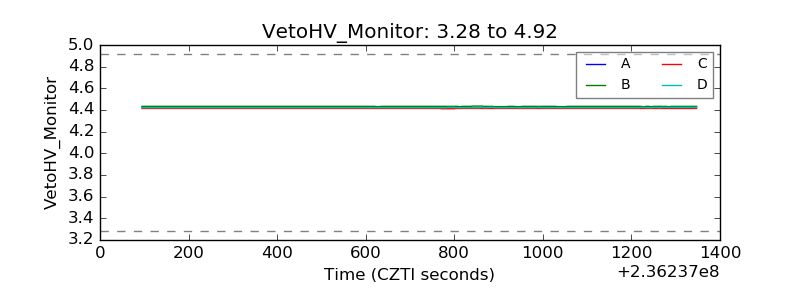 |
| Veto LLD | 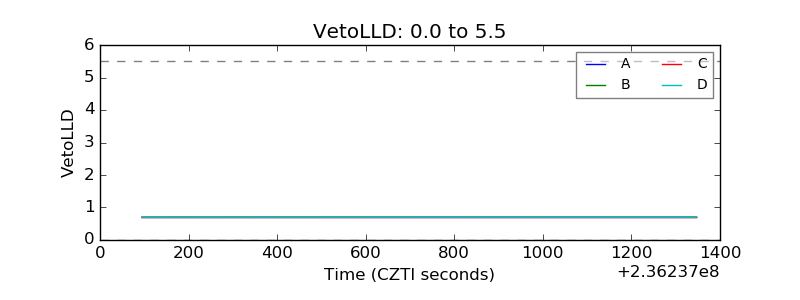 |
| Alpha Counter | 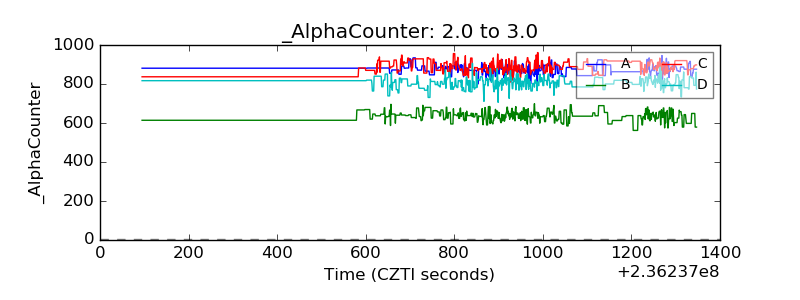 |
| _CPM_Rate | 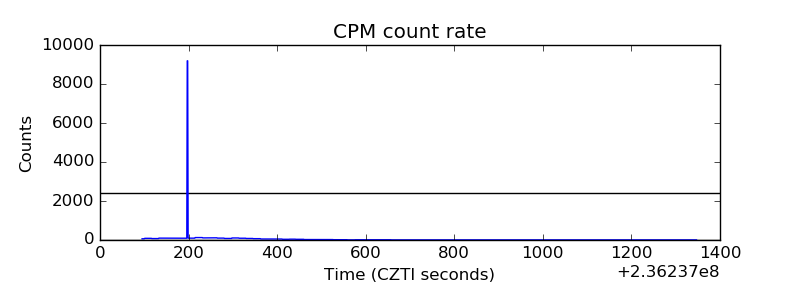 |
| CZT Counter | 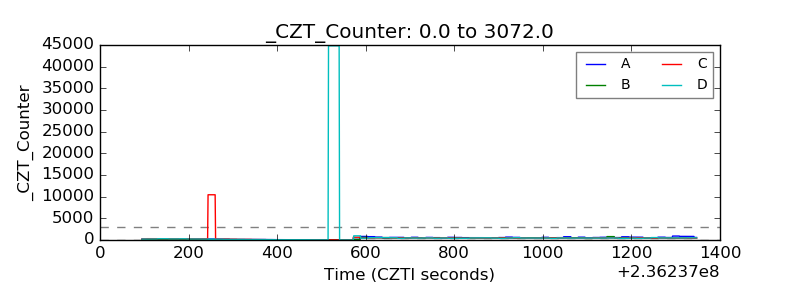 |
| +2.5 Volts monitor |  |
| +5 Volts monitor |  |
| _ROLL_ROT | 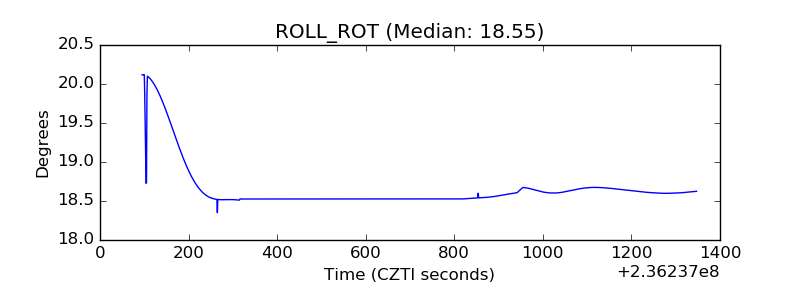 |
| _Roll_DEC | 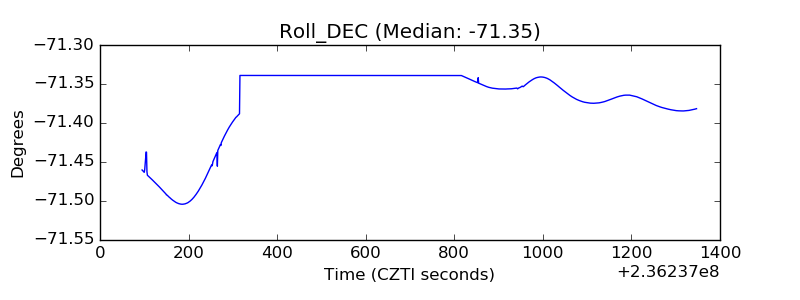 |
| _Roll_RA | 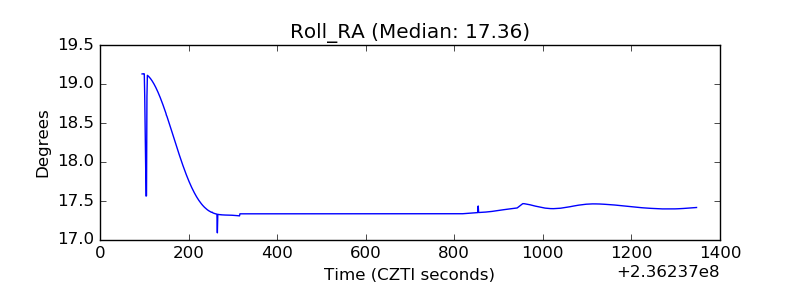 |
| Veto Counter | 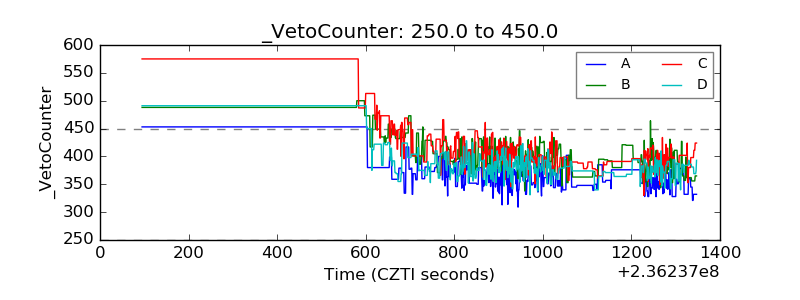 |