| Param | Original file | Final file |
|---|---|---|
| Filename | modeM0/AS1C02_045T01_9000001342_09448cztM0_level2.evt | modeM0/AS1C02_045T01_9000001342_09448cztM0_level2_quad_clean.evt |
| Size (bytes) | 1,215,397,440 | 274,173,120 |
| Size | 1.1 GB | 261.5 MB |
| Events in quadrant A | 9,883,983 | 1,775,685 |
| Events in quadrant B | 8,527,130 | 1,793,311 |
| Events in quadrant C | 8,156,260 | 1,787,633 |
| Events in quadrant D | 9,059,653 | 1,743,327 |
| Mode SS | |||
|---|---|---|---|
| Quadrant | BADHDUFLAG | Total packets | Discarded packets |
| A | 0 | 360 | 4 |
| B | 0 | 360 | 2 |
| C | 0 | 360 | 2 |
| D | 0 | 360 | 4 |
| Mode M9 | |||
|---|---|---|---|
| Quadrant | BADHDUFLAG | Total packets | Discarded packets |
| A | 0 | 33 | 1 |
| B | 0 | 33 | 1 |
| C | 0 | 33 | 2 |
| D | 0 | 33 | 0 |
| Mode M0 | |||
|---|---|---|---|
| Quadrant | BADHDUFLAG | Total packets | Discarded packets |
| A | 0 | 41017 | 382 |
| B | 0 | 37062 | 320 |
| C | 0 | 36867 | 329 |
| D | 0 | 39371 | 355 |
| Quadrant | Total seconds | Saturated seconds | Saturation percentage |
|---|---|---|---|
| A | 17473 | 168 | 0.961483% |
| B | 17467 | 187 | 1.070590% |
| C | 17466 | 104 | 0.595443% |
| D | 17467 | 213 | 1.219442% |
Noise dominated data is calculated using 1-second bins in cleaned event files. If a bin has >2000 counts, and if more than 50% of those come from <1% of pixels, then it is considered to be noise-dominated and hence unusable.
| Quadrant | # 1 sec bins | Bins with >0 counts | Bins with >2000 counts | High rate bins dominated by noise | Noise dominated (total time) | Noise dominated (detector-on time) | Marked lightcurve |
|---|---|---|---|---|---|---|---|
| A | 20444 | 17543 | 15 | 15 | 0.07% | 0.09% | 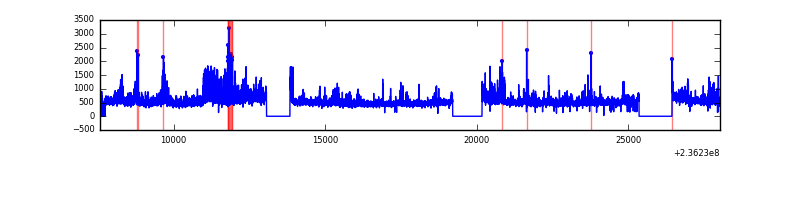 |
| B | 20444 | 17550 | 70 | 70 | 0.34% | 0.40% | 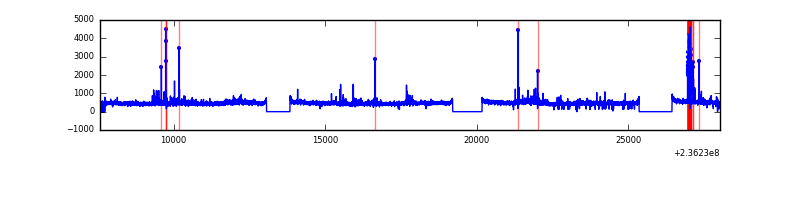 |
| C | 20449 | 17549 | 26 | 26 | 0.13% | 0.15% | 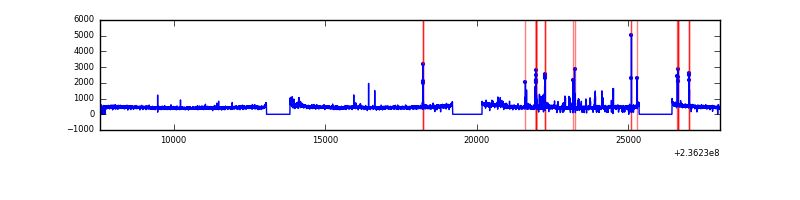 |
| D | 20449 | 17540 | 114 | 114 | 0.56% | 0.65% | 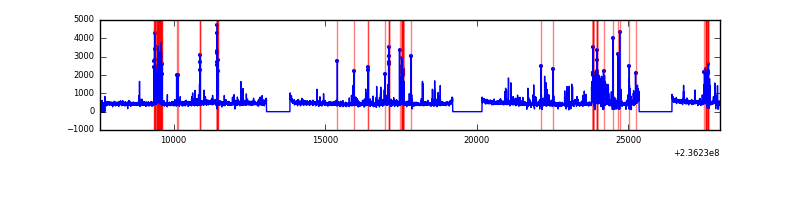 |
Top three noisy pixels from each quadrant. If the there are fewer than three noisy pixels in the level2.evt file, extra rows are filled as -1
| Pixel properties | Quadrant properties | ||||||
|---|---|---|---|---|---|---|---|
| Quadrant | DetID | PixID | Counts | Sigma | Mean | Median | Sigma |
| A | 8 | 5 | 1799358 | 4439.91 | 2009 | 1964 | 404.8 |
| A | 1 | 162 | 183817 | 449.21 | 2009 | 1964 | 404.8 |
| A | 1 | 178 | 63111 | 151.04 | 2009 | 1964 | 404.8 |
| B | 0 | 187 | 298374 | 790.42 | 1998 | 1945 | 375.0 |
| B | 0 | 214 | 185651 | 489.85 | 1998 | 1945 | 375.0 |
| B | 0 | 219 | 103664 | 271.23 | 1998 | 1945 | 375.0 |
| C | 9 | 68 | 378226 | 843.78 | 1950 | 1958 | 445.9 |
| C | 4 | 254 | 155511 | 344.34 | 1950 | 1958 | 445.9 |
| C | 13 | 61 | 14624 | 28.4 | 1950 | 1958 | 445.9 |
| D | 1 | 52 | 911267 | 1876.43 | 1950 | 1903 | 484.6 |
| D | 12 | 233 | 281591 | 577.12 | 1950 | 1903 | 484.6 |
| D | 7 | 9 | 145016 | 295.31 | 1950 | 1903 | 484.6 |
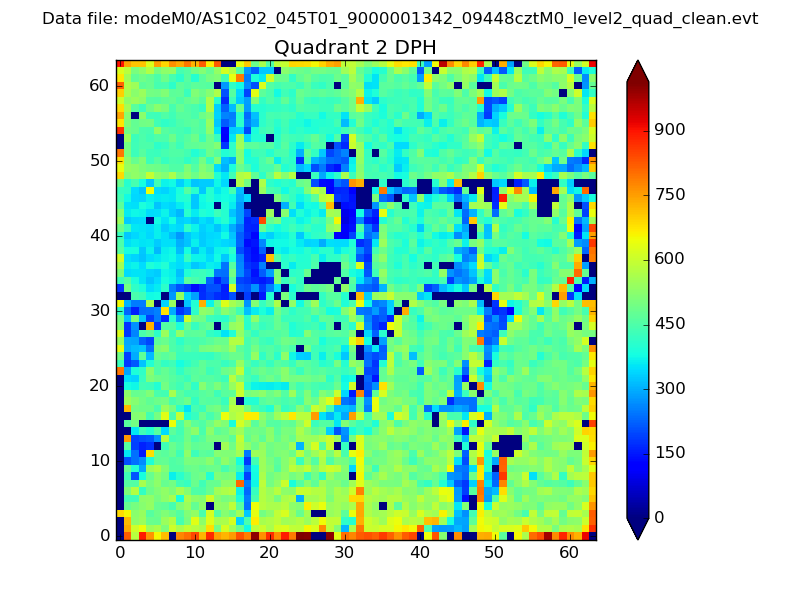
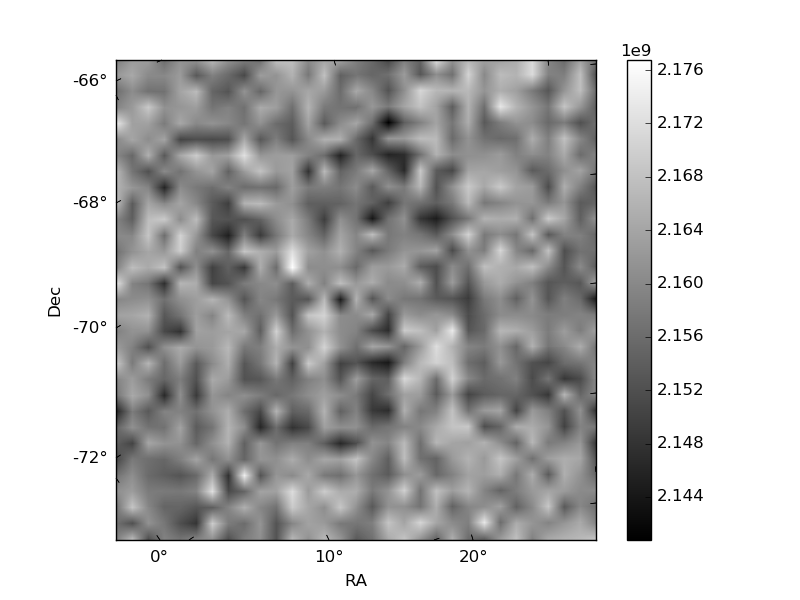
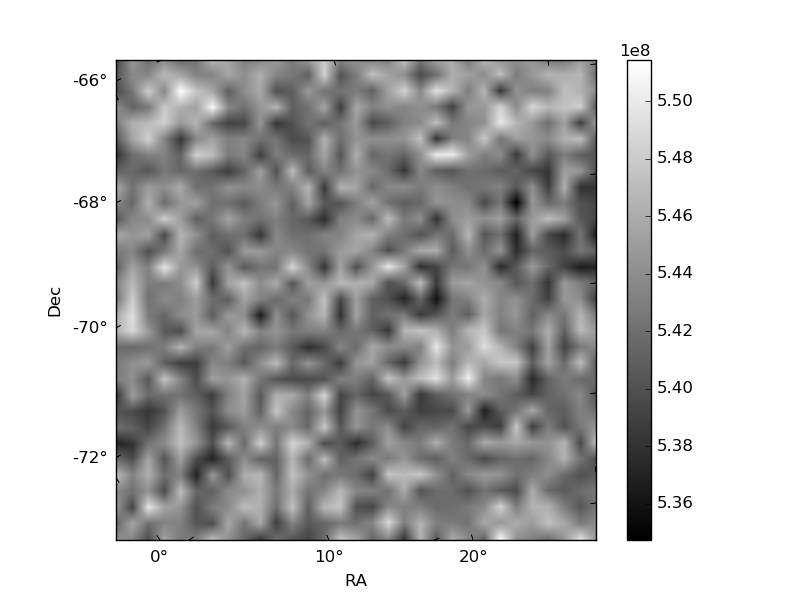
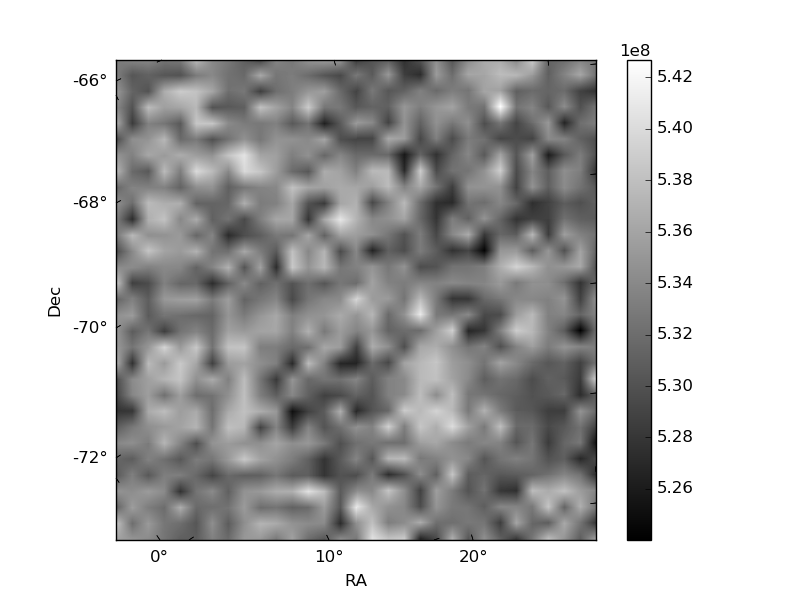
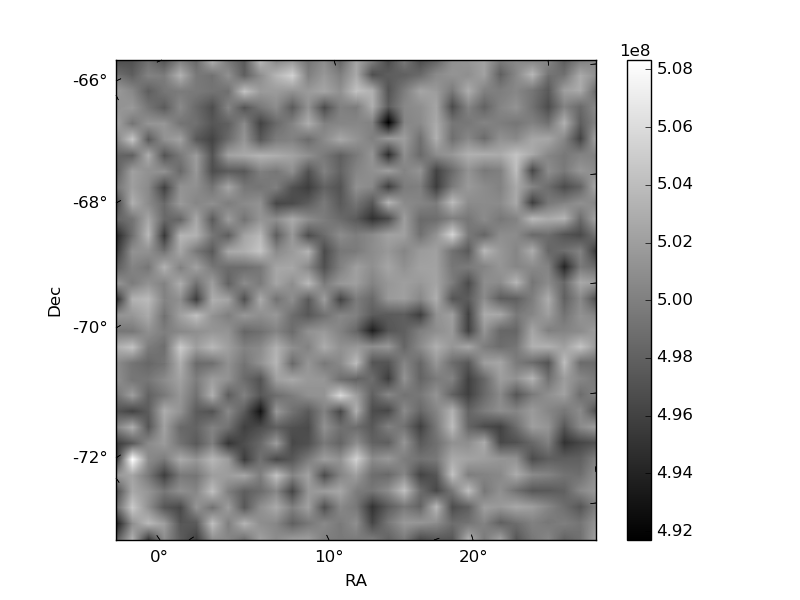
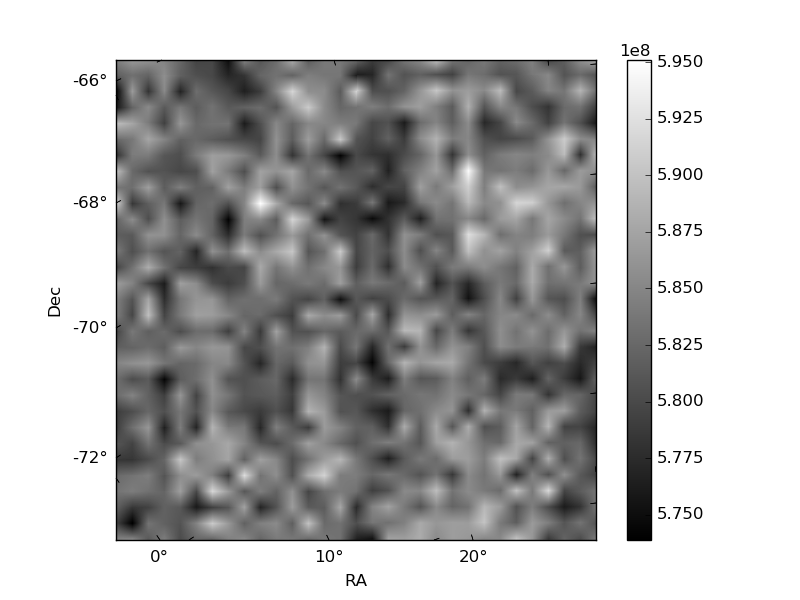
Histogram calculated using DETX and DETY for each event in the final _common_clean file
| Quadrant A | 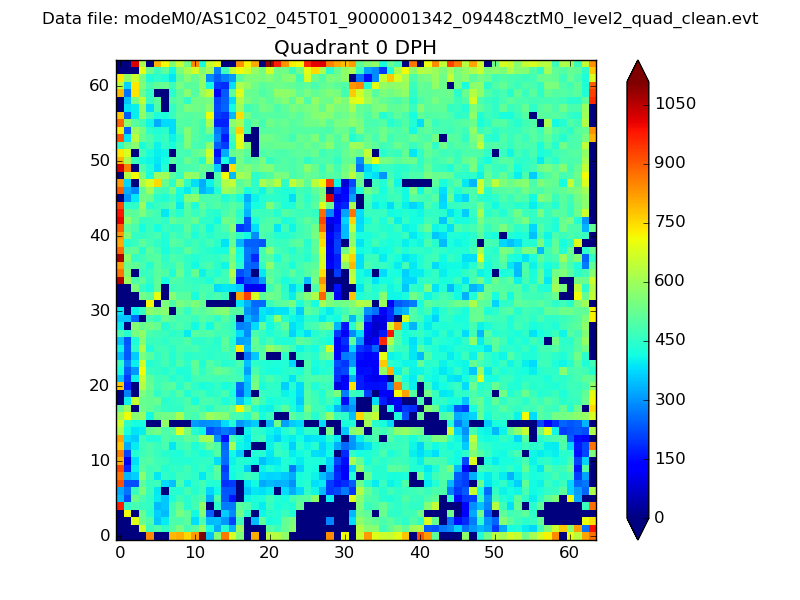 |
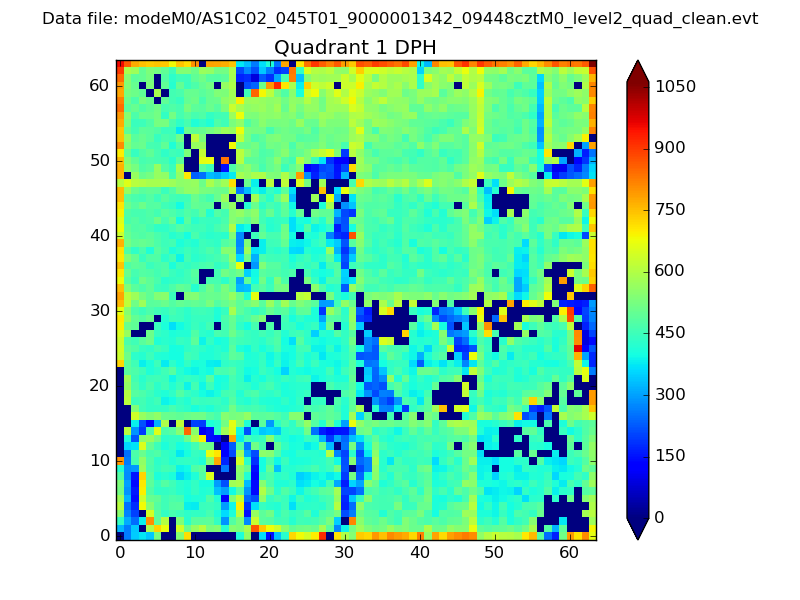 |
Quadrant B |
|---|---|---|---|
| Quadrant D | 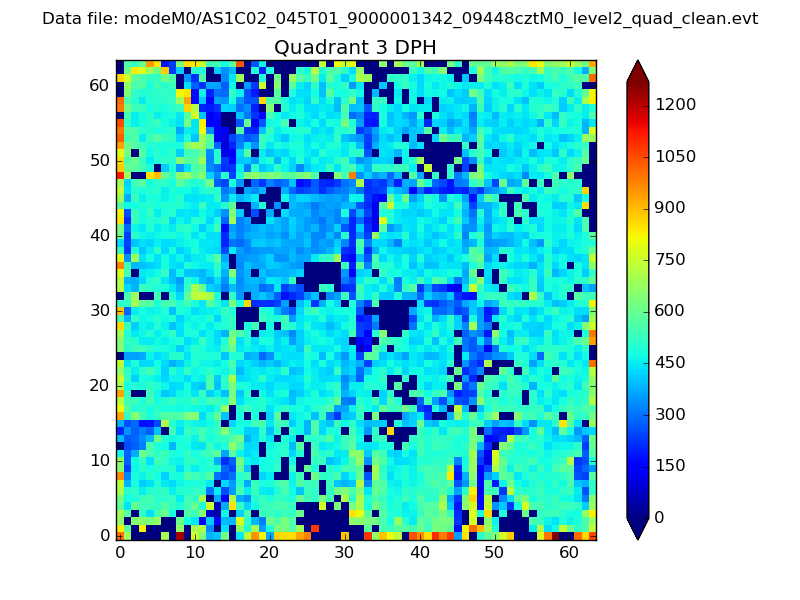 |
 |
Quadrant C |
| Plot type | Count rate plots | Images |
|---|---|---|
| Comparison with Poisson distribution Blue bars denote a histogram of data divided into 1 sec bins. Red curve is a Poisson curve with rate = median count rate of data. |
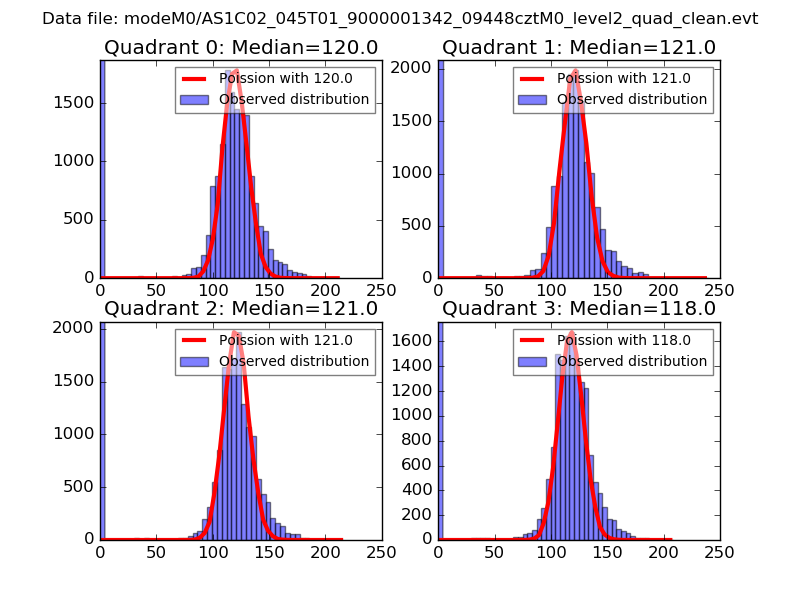 |
 |
| Quadrant-wise count rates Data is divided into 100 sec bins |
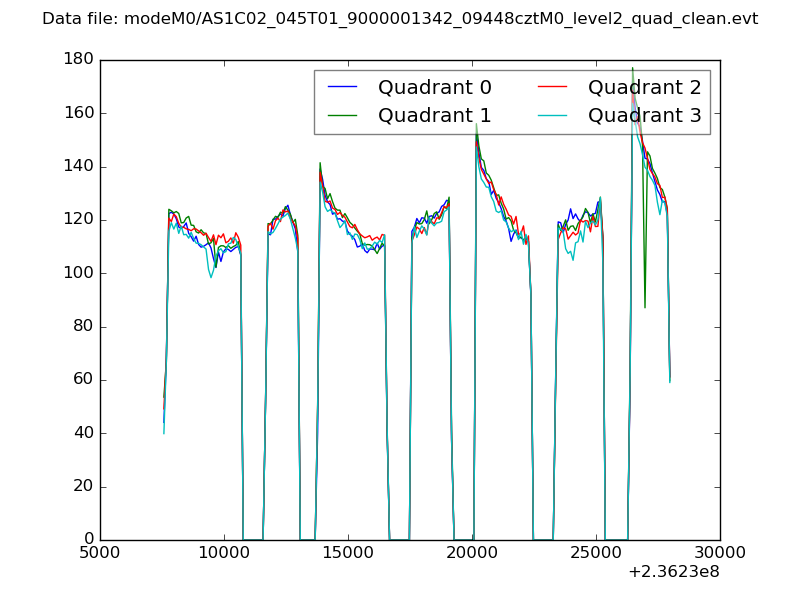 |
|
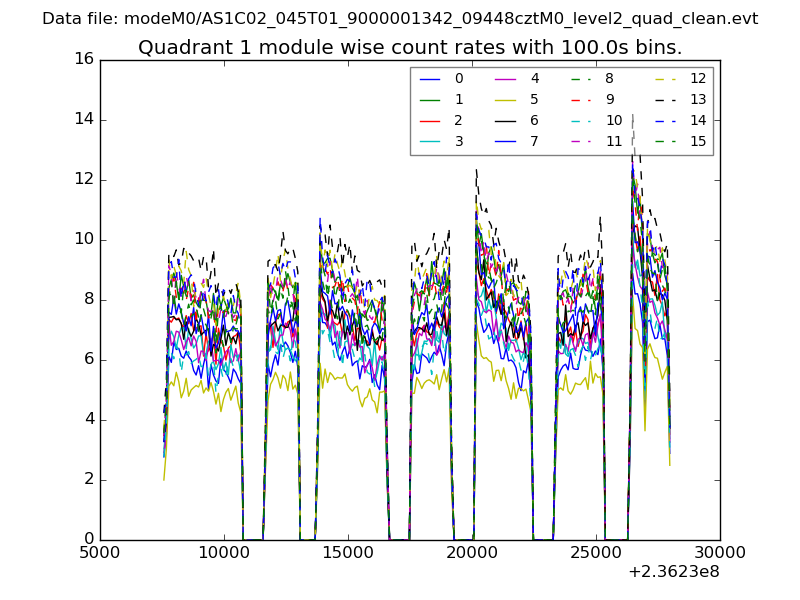
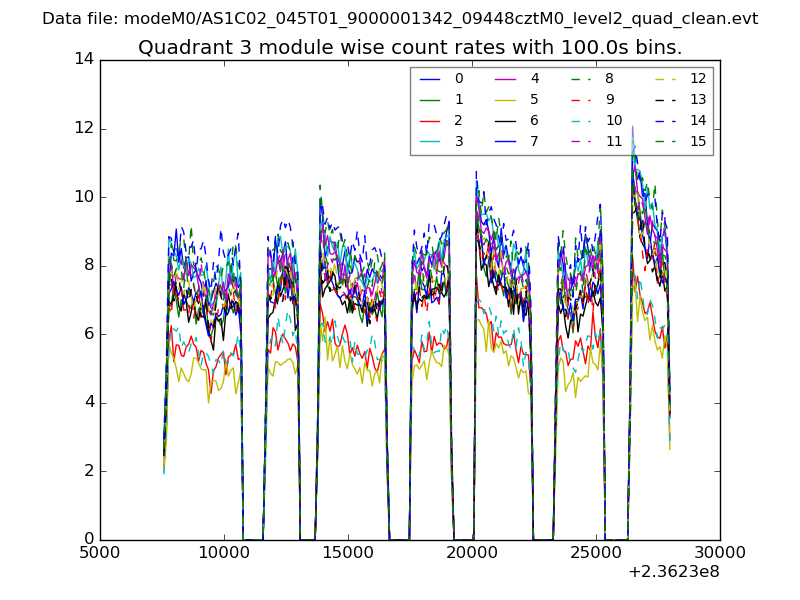
| Module-wise count rates for Quadrant A Data is divided into 100 sec bins |
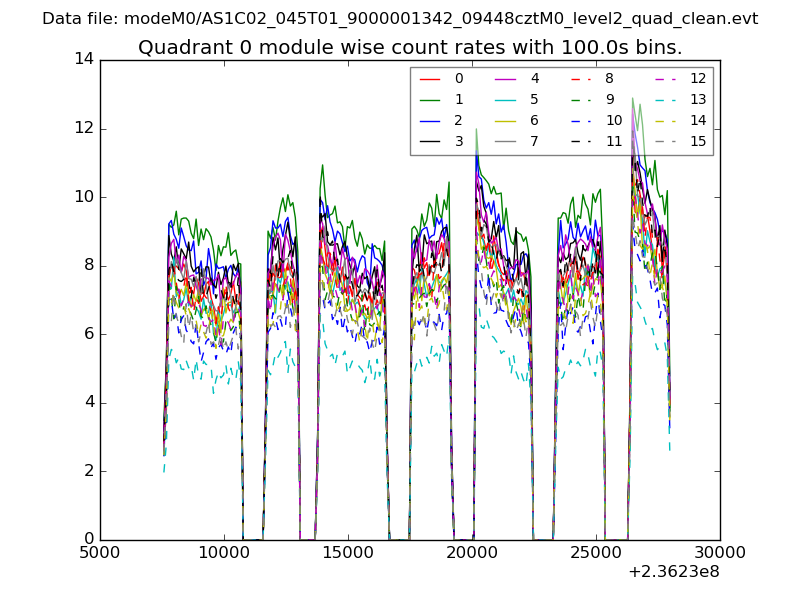 |
 |
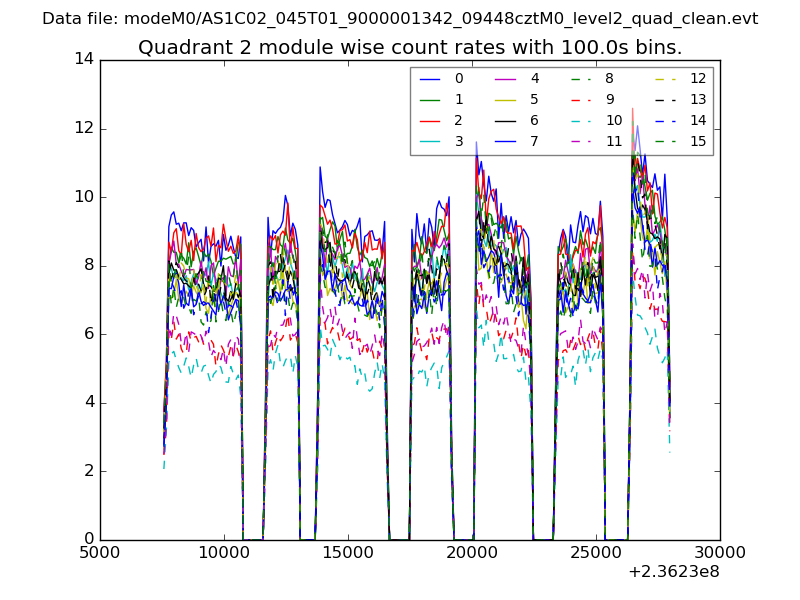
| Module-wise count rates for Quadrant B Data is divided into 100 sec bins |
 |
 |
| Module-wise count rates for Quadrant C Data is divided into 100 sec bins |
 |
 |
| Module-wise count rates for Quadrant D Data is divided into 100 sec bins |
 |
 |
| Parameter | Plot |
|---|---|
| CZT HV Monitor | 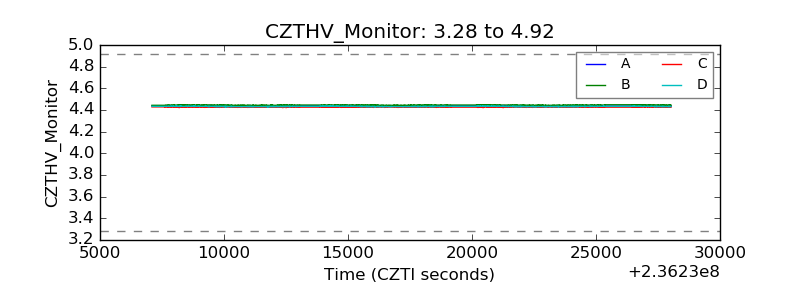 |
| D_VDD | 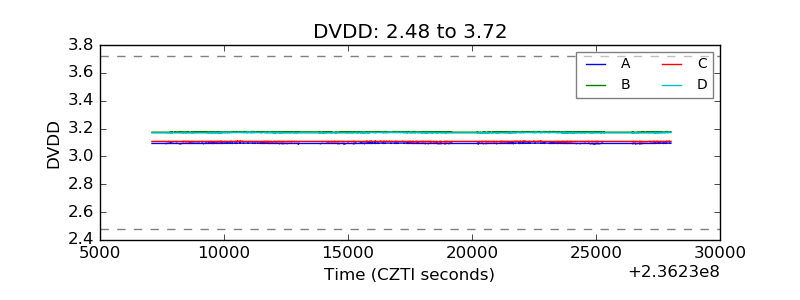 |
| Temperature 1 | 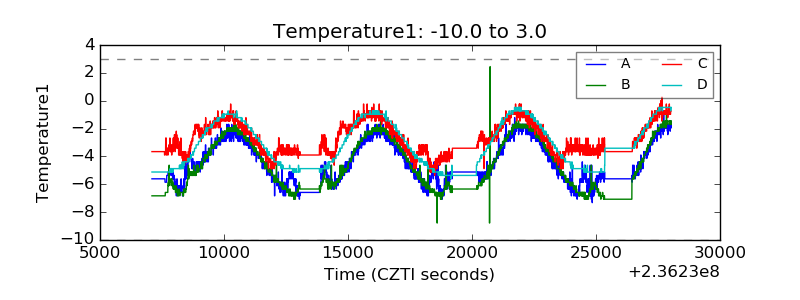 |
| Veto HV Monitor | 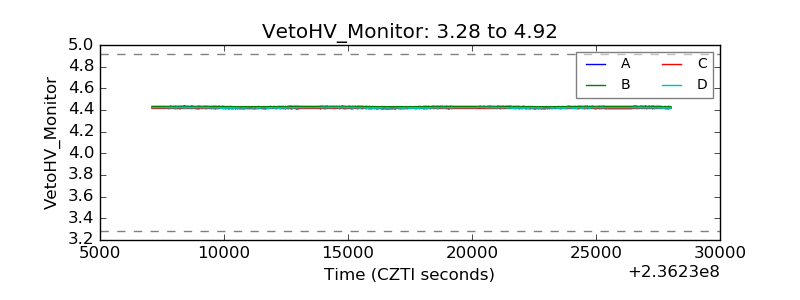 |
| Veto LLD | 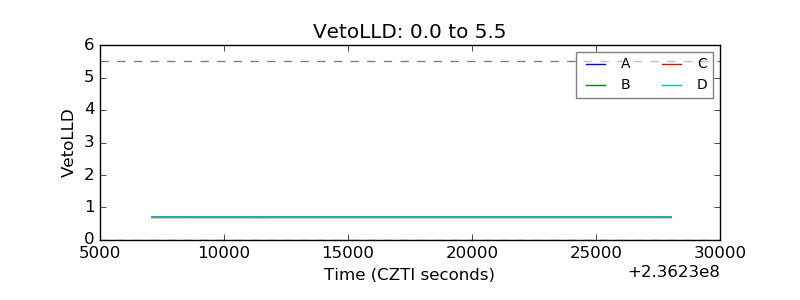 |
| Alpha Counter | 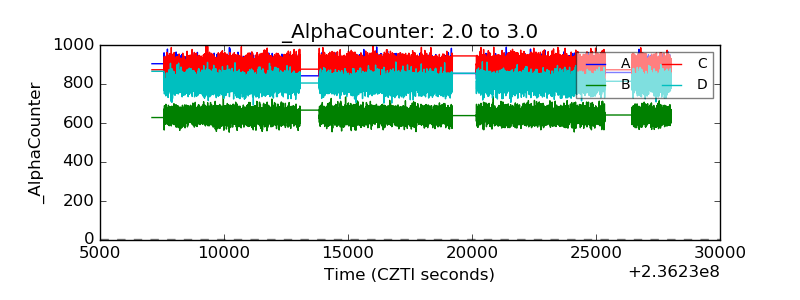 |
| _CPM_Rate |  |
| CZT Counter | 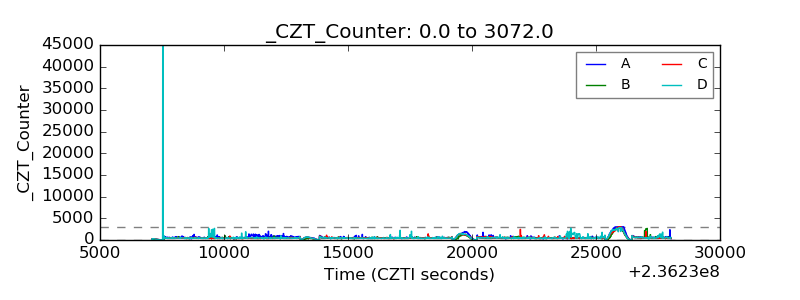 |
| +2.5 Volts monitor |  |
| +5 Volts monitor |  |
| _ROLL_ROT | 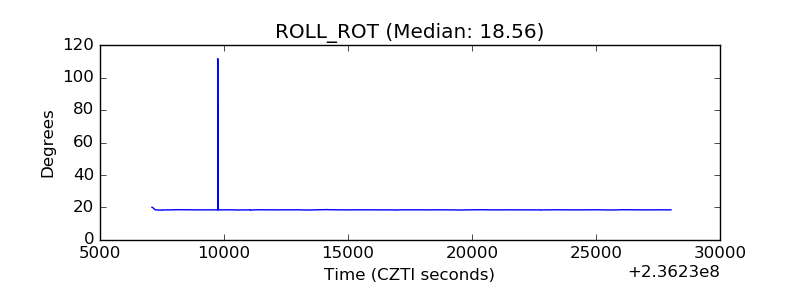 |
| _Roll_DEC |  |
| _Roll_RA | 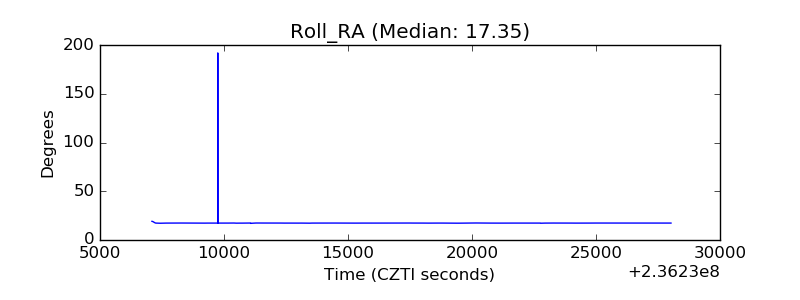 |
| Veto Counter | 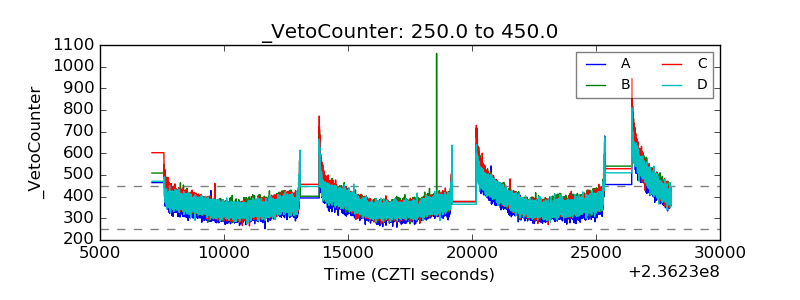 |