| Param | Original file | Final file |
|---|---|---|
| Filename | modeM0/AS1C02_045T01_9000001342_09449cztM0_level2.evt | modeM0/AS1C02_045T01_9000001342_09449cztM0_level2_quad_clean.evt |
| Size (bytes) | 893,197,440 | 192,850,560 |
| Size | 851.8 MB | 183.9 MB |
| Events in quadrant A | 7,704,171 | 1,224,782 |
| Events in quadrant B | 6,287,732 | 1,246,365 |
| Events in quadrant C | 5,775,800 | 1,248,081 |
| Events in quadrant D | 6,398,058 | 1,219,541 |
| Mode SS | |||
|---|---|---|---|
| Quadrant | BADHDUFLAG | Total packets | Discarded packets |
| A | 0 | 292 | 36 |
| B | 0 | 291 | 32 |
| C | 0 | 292 | 28 |
| D | 0 | 292 | 24 |
| Mode M9 | |||
|---|---|---|---|
| Quadrant | BADHDUFLAG | Total packets | Discarded packets |
| A | 0 | 22 | 7 |
| B | 0 | 22 | 7 |
| C | 0 | 22 | 7 |
| D | 0 | 22 | 4 |
| Mode M0 | |||
|---|---|---|---|
| Quadrant | BADHDUFLAG | Total packets | Discarded packets |
| A | 0 | 34365 | 2936 |
| B | 0 | 29807 | 2398 |
| C | 0 | 29213 | 2570 |
| D | 0 | 30723 | 2580 |
| Quadrant | Total seconds | Saturated seconds | Saturation percentage |
|---|---|---|---|
| A | 12977 | 147 | 1.132773% |
| B | 13107 | 129 | 0.984207% |
| C | 13084 | 40 | 0.305717% |
| D | 13053 | 138 | 1.057228% |
Noise dominated data is calculated using 1-second bins in cleaned event files. If a bin has >2000 counts, and if more than 50% of those come from <1% of pixels, then it is considered to be noise-dominated and hence unusable.
| Quadrant | # 1 sec bins | Bins with >0 counts | Bins with >2000 counts | High rate bins dominated by noise | Noise dominated (total time) | Noise dominated (detector-on time) | Marked lightcurve |
|---|---|---|---|---|---|---|---|
| A | 22558 | 13588 | 41 | 41 | 0.18% | 0.30% | 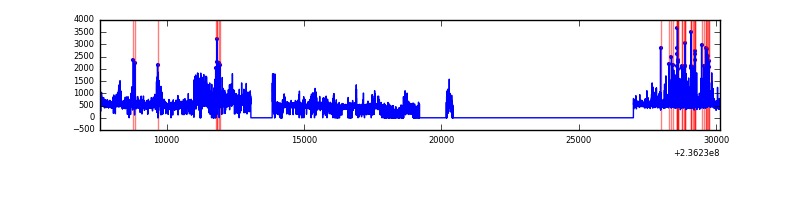 |
| B | 22558 | 13657 | 55 | 55 | 0.24% | 0.40% | 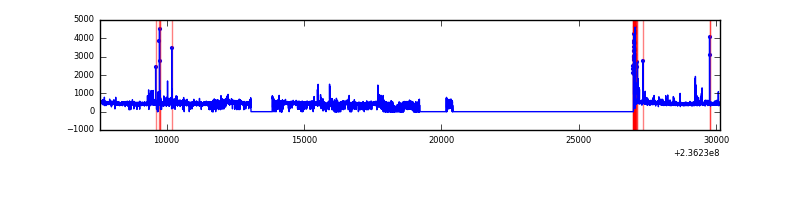 |
| C | 22558 | 13649 | 3 | 3 | 0.01% | 0.02% | 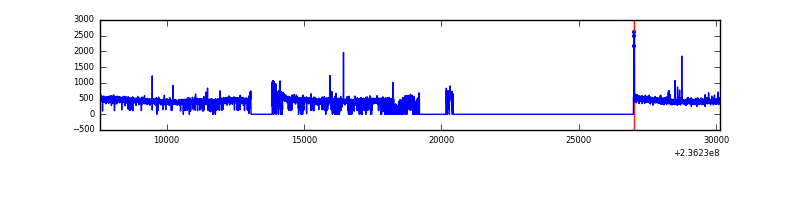 |
| D | 22558 | 13619 | 90 | 90 | 0.40% | 0.66% | 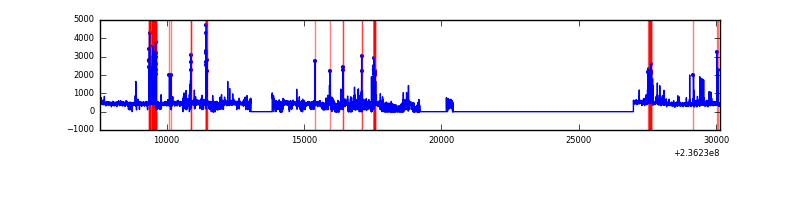 |
Top three noisy pixels from each quadrant. If the there are fewer than three noisy pixels in the level2.evt file, extra rows are filled as -1
| Pixel properties | Quadrant properties | ||||||
|---|---|---|---|---|---|---|---|
| Quadrant | DetID | PixID | Counts | Sigma | Mean | Median | Sigma |
| A | 8 | 5 | 1695871 | 5706.3 | 1465 | 1434 | 296.9 |
| A | 1 | 162 | 188644 | 630.46 | 1465 | 1434 | 296.9 |
| A | 1 | 178 | 66673 | 219.7 | 1465 | 1434 | 296.9 |
| B | 0 | 187 | 169861 | 607.49 | 1473 | 1433 | 277.3 |
| B | 0 | 214 | 137290 | 490.01 | 1473 | 1433 | 277.3 |
| B | 0 | 219 | 78366 | 277.48 | 1473 | 1433 | 277.3 |
| C | 9 | 68 | 147009 | 441.97 | 1432 | 1439 | 329.4 |
| C | 4 | 254 | 27802 | 80.04 | 1432 | 1439 | 329.4 |
| C | 13 | 61 | 10783 | 28.37 | 1432 | 1439 | 329.4 |
| D | 1 | 52 | 312918 | 865.94 | 1433 | 1396 | 359.8 |
| D | 12 | 233 | 245721 | 679.15 | 1433 | 1396 | 359.8 |
| D | 7 | 9 | 136214 | 374.75 | 1433 | 1396 | 359.8 |
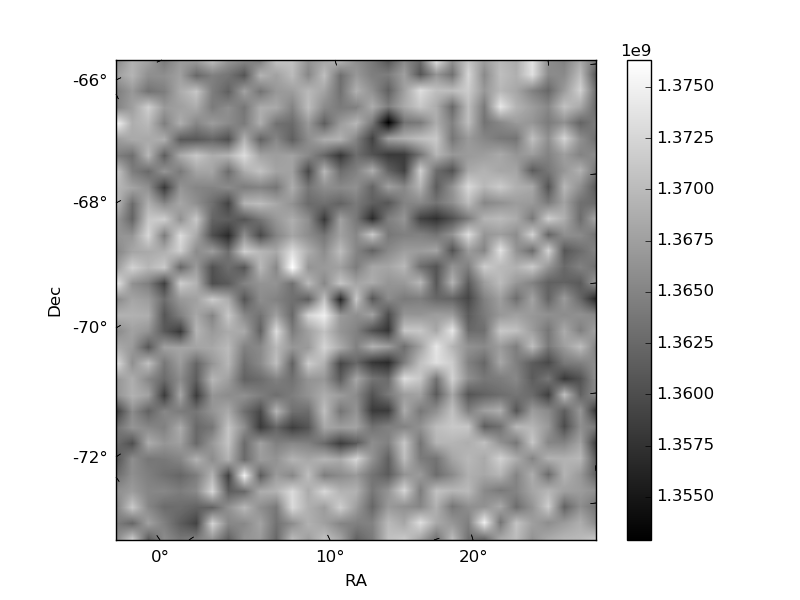
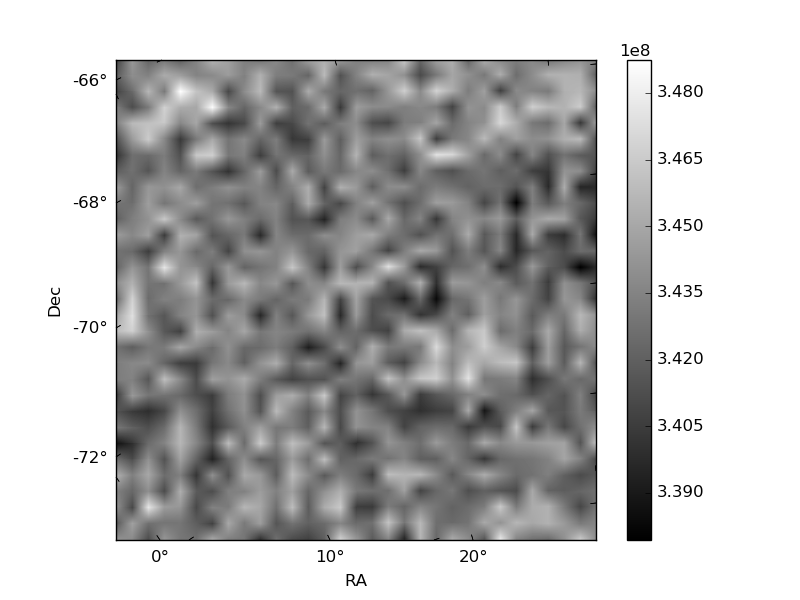
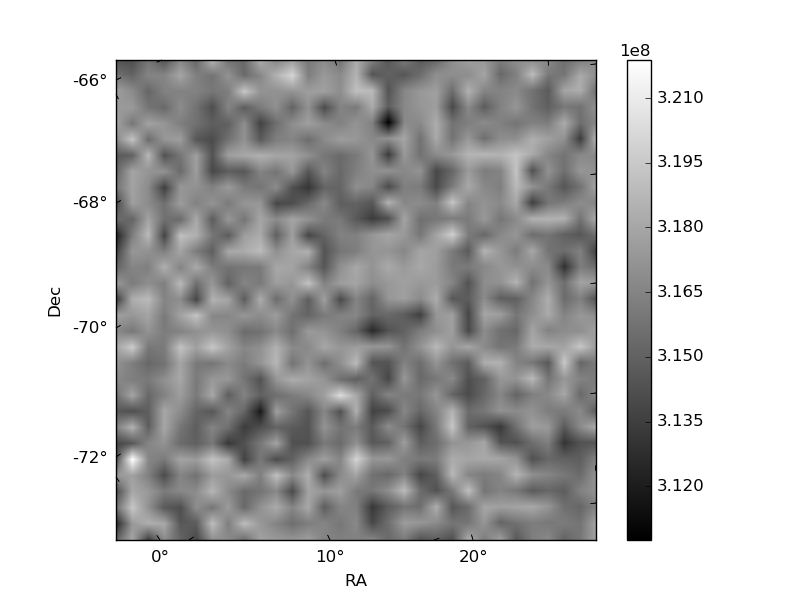
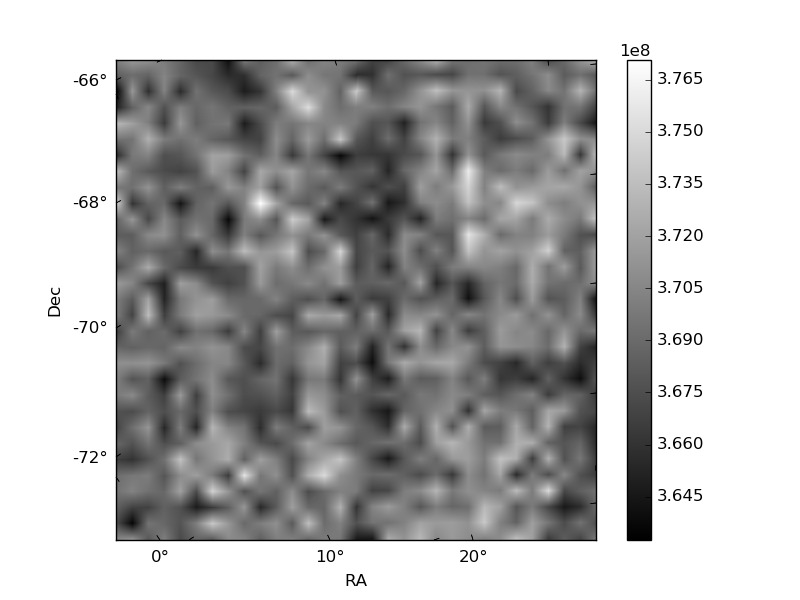
Histogram calculated using DETX and DETY for each event in the final _common_clean file
| Quadrant A | 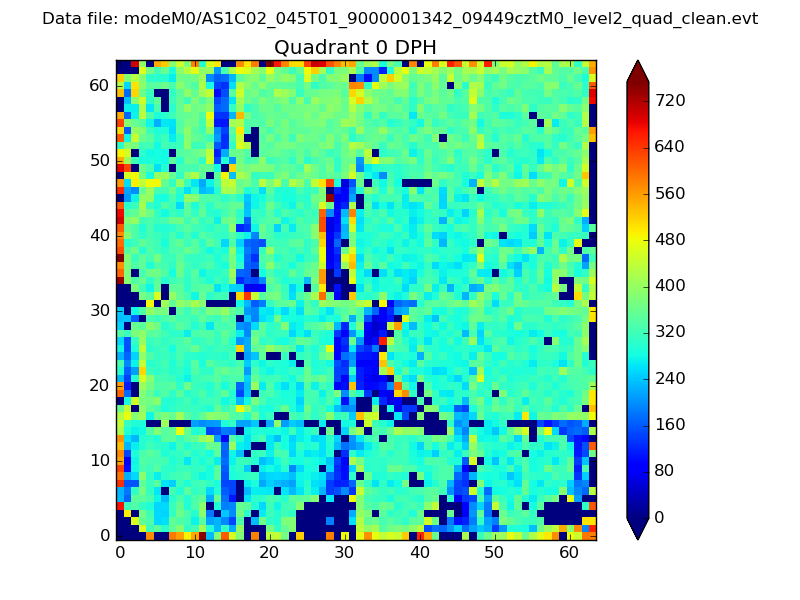 |
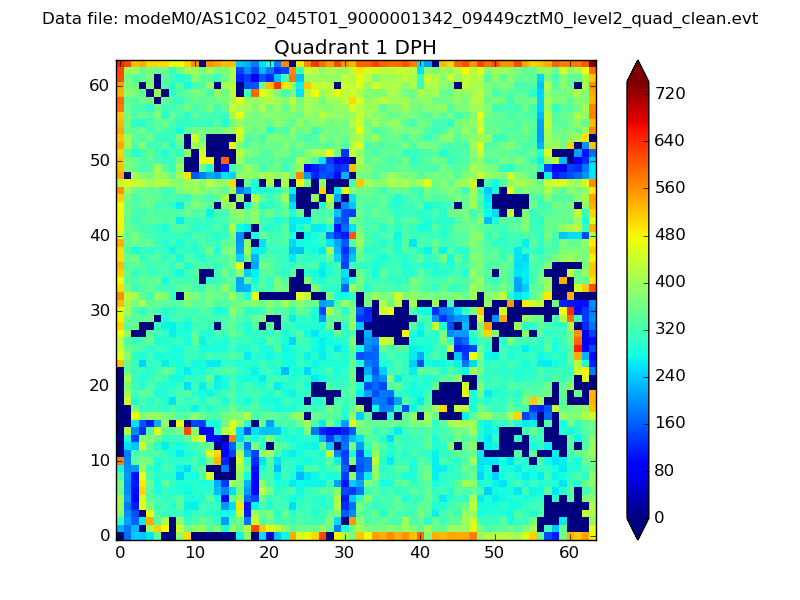 |
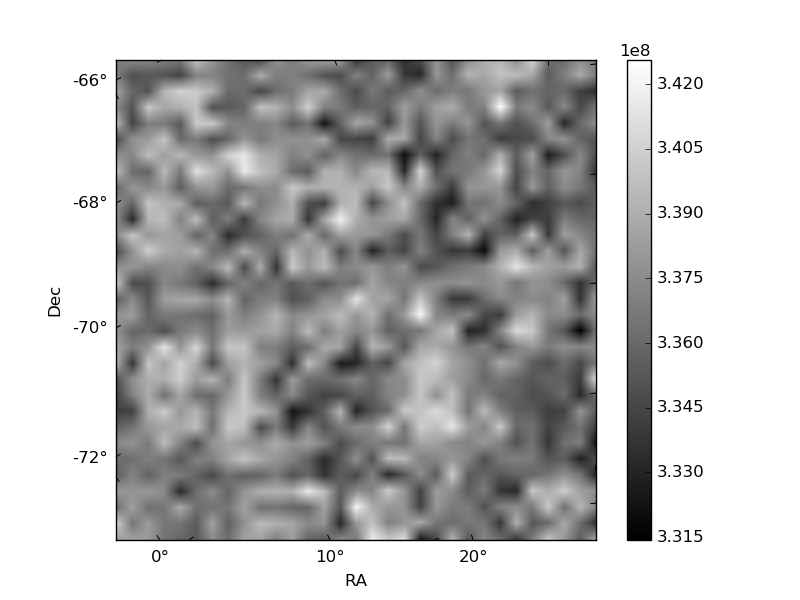
Quadrant B |
|---|---|---|---|
| Quadrant D | 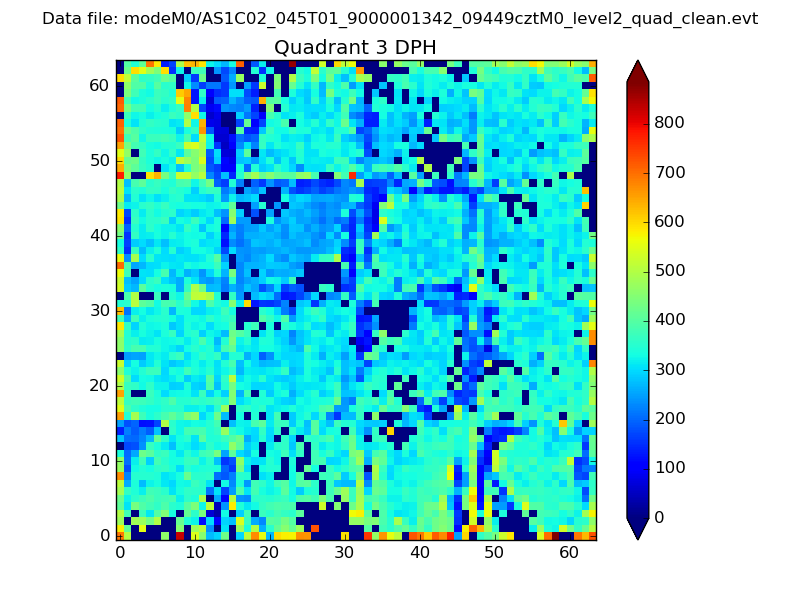 |
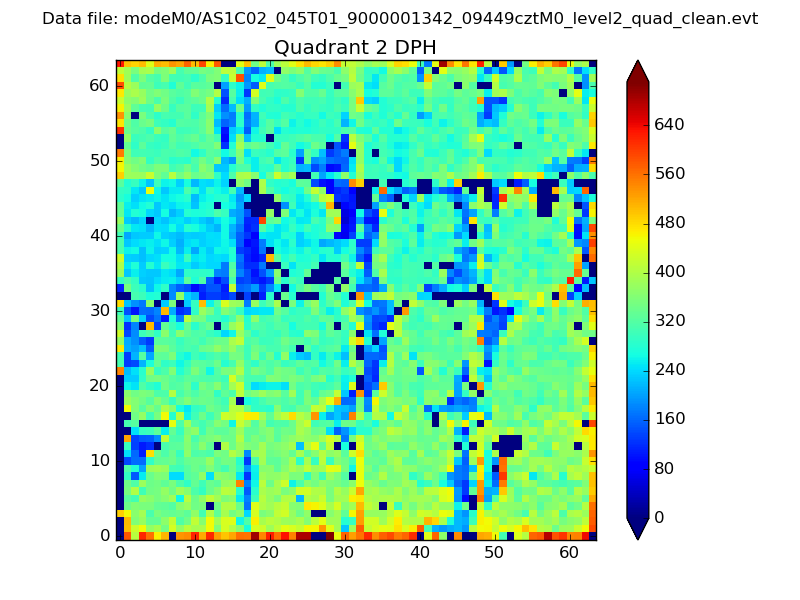 |
Quadrant C |
| Plot type | Count rate plots | Images |
|---|---|---|
| Comparison with Poisson distribution Blue bars denote a histogram of data divided into 1 sec bins. Red curve is a Poisson curve with rate = median count rate of data. |
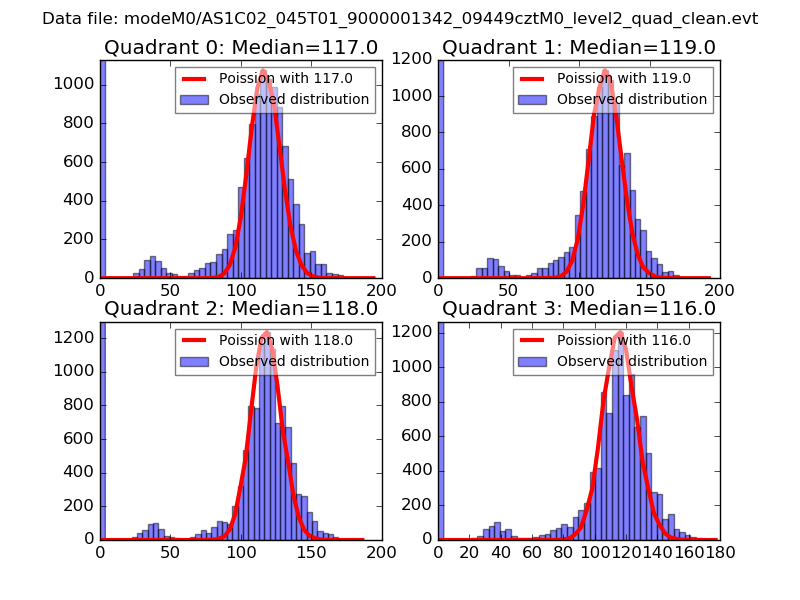 |
 |
| Quadrant-wise count rates Data is divided into 100 sec bins |
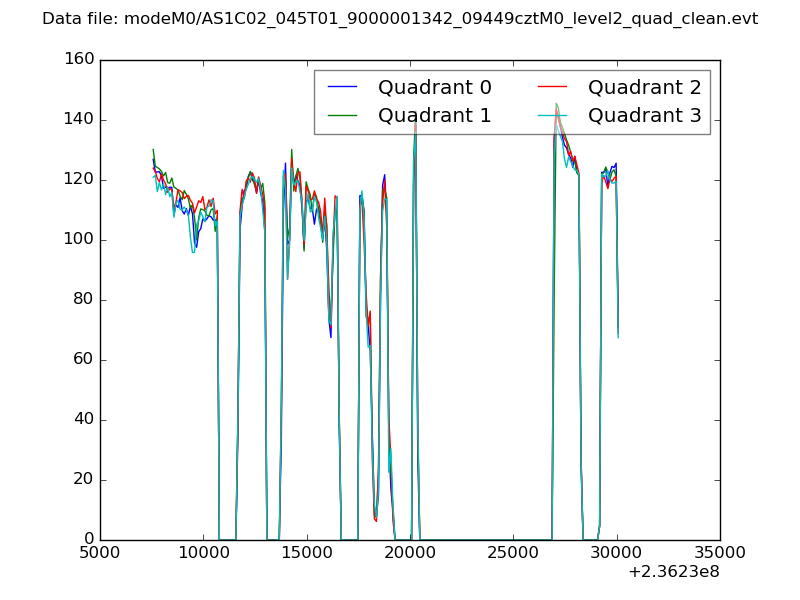 |
|
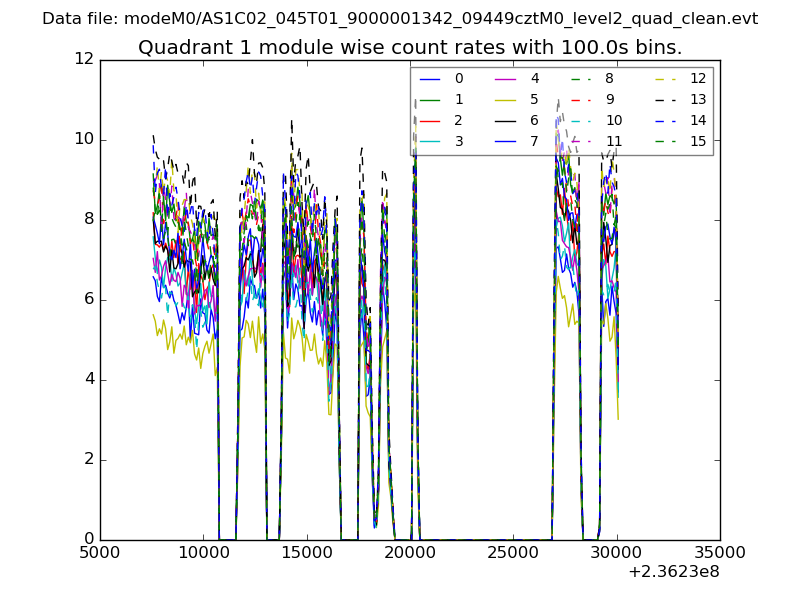
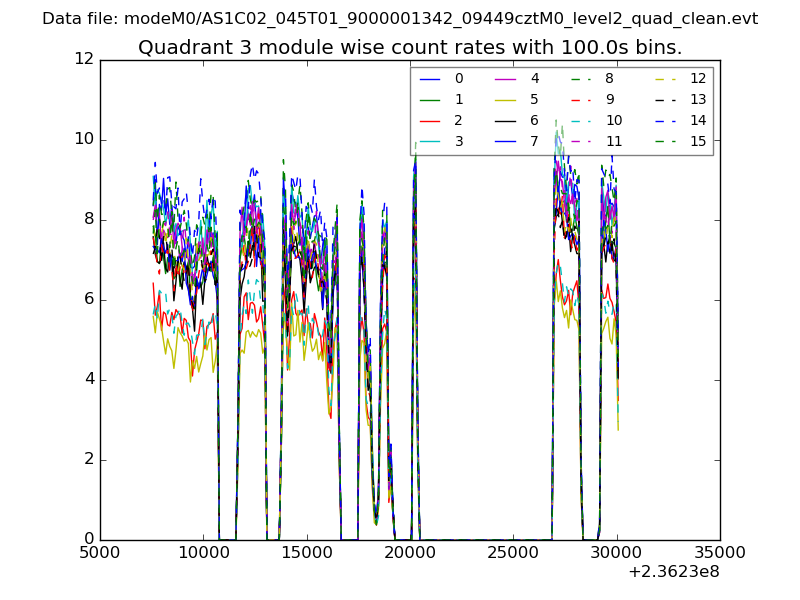
| Module-wise count rates for Quadrant A Data is divided into 100 sec bins |
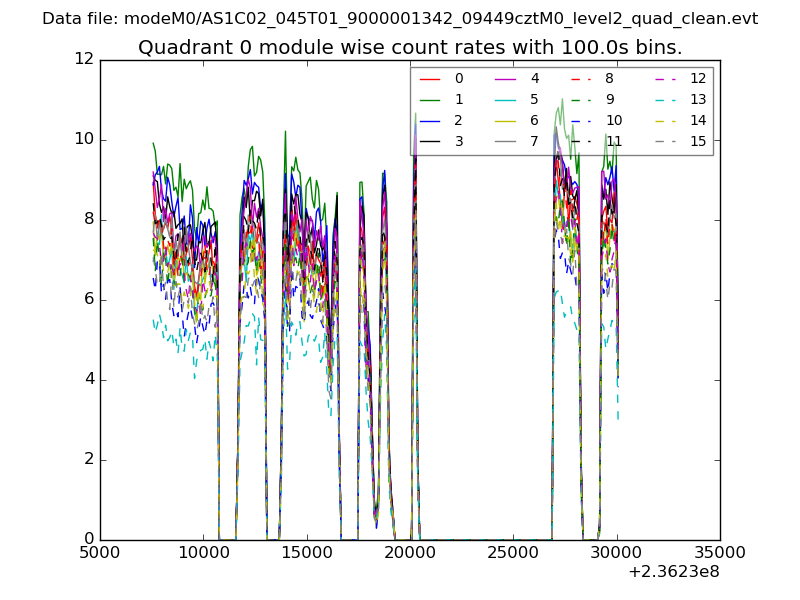 |
 |
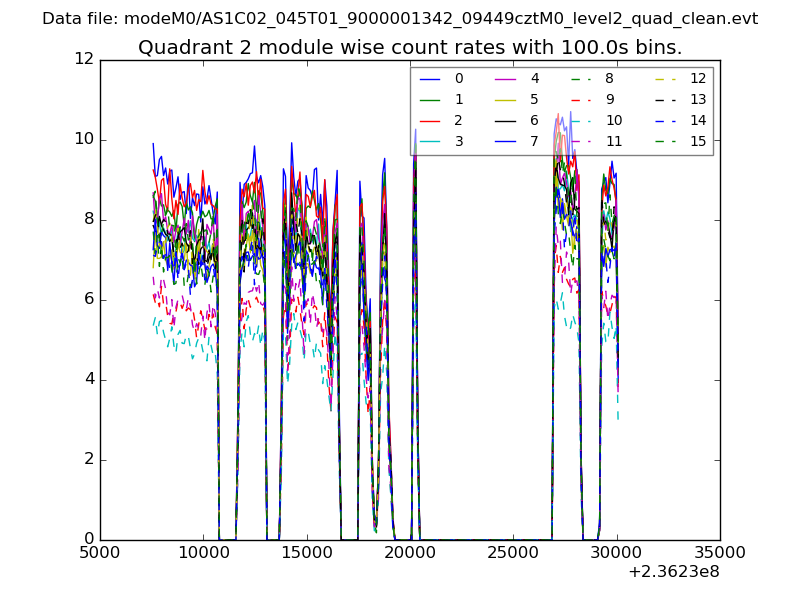
| Module-wise count rates for Quadrant B Data is divided into 100 sec bins |
 |
 |
| Module-wise count rates for Quadrant C Data is divided into 100 sec bins |
 |
 |
| Module-wise count rates for Quadrant D Data is divided into 100 sec bins |
 |
 |
| Parameter | Plot |
|---|---|
| CZT HV Monitor | 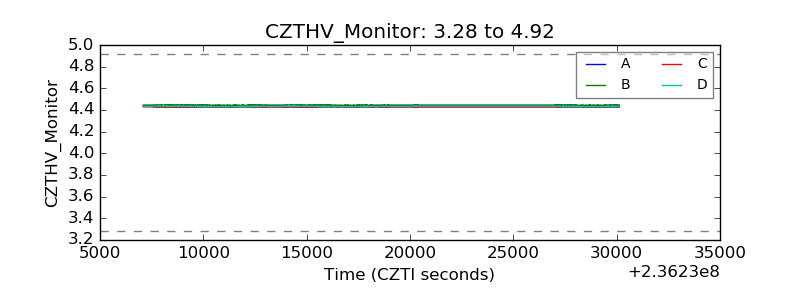 |
| D_VDD | 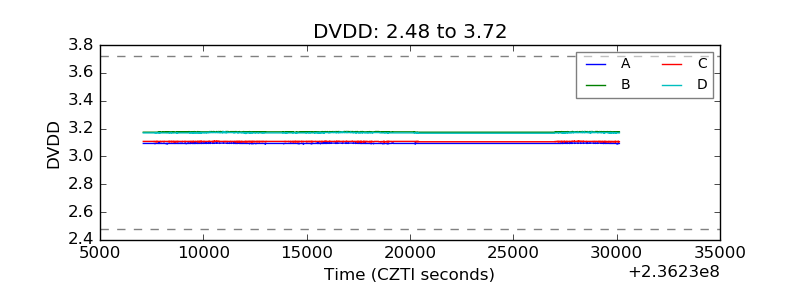 |
| Temperature 1 | 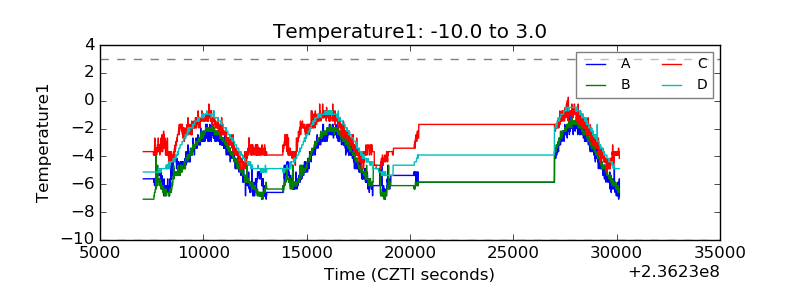 |
| Veto HV Monitor |  |
| Veto LLD | 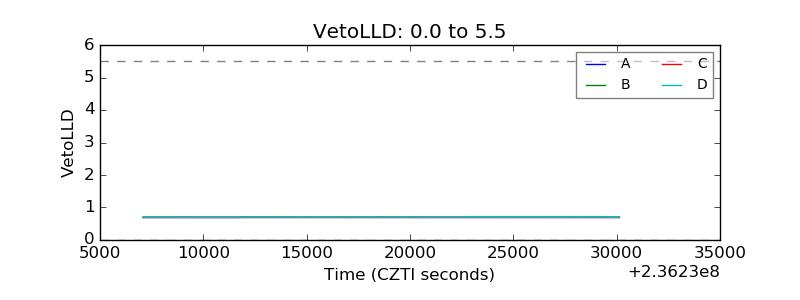 |
| Alpha Counter | 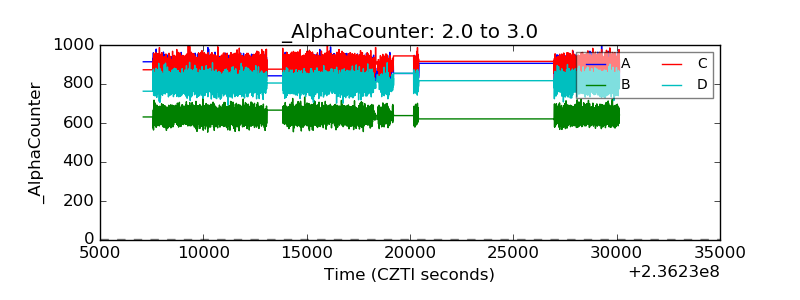 |
| _CPM_Rate | 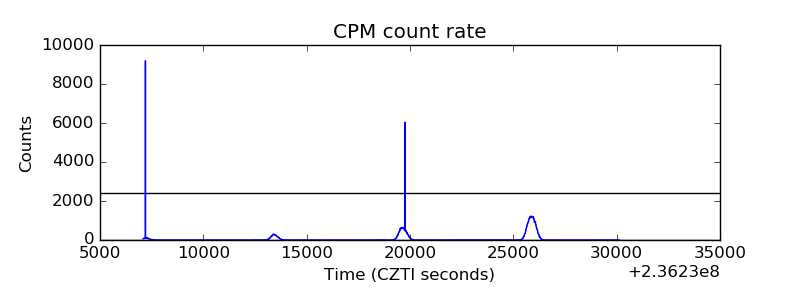 |
| CZT Counter | 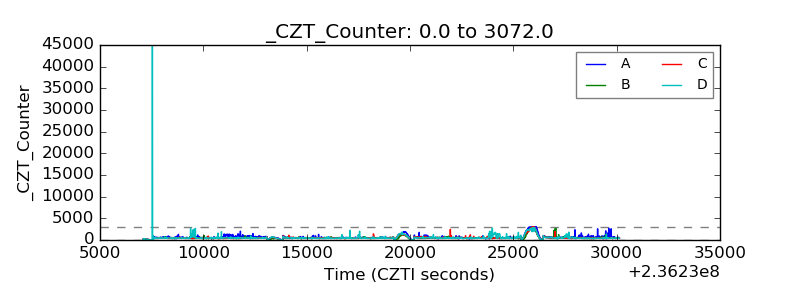 |
| +2.5 Volts monitor |  |
| +5 Volts monitor |  |
| _ROLL_ROT | 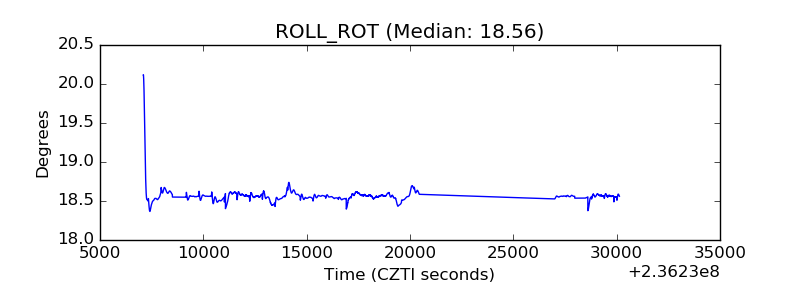 |
| _Roll_DEC | 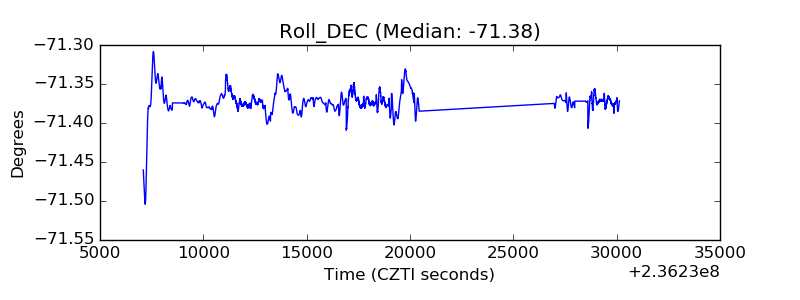 |
| _Roll_RA | 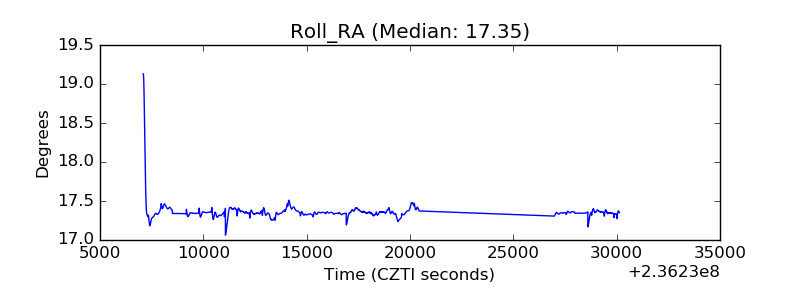 |
| Veto Counter | 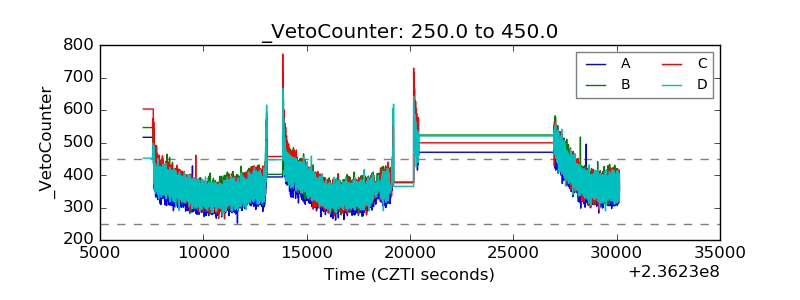 |