| Param | Original file | Final file |
|---|---|---|
| Filename | modeM0/AS1T01_177T01_9000001344_09452cztM0_level2.evt | modeM0/AS1T01_177T01_9000001344_09452cztM0_level2_quad_clean.evt |
| Size (bytes) | 434,649,600 | 90,737,280 |
| Size | 414.5 MB | 86.5 MB |
| Events in quadrant A | 3,308,622 | 593,295 |
| Events in quadrant B | 3,177,028 | 587,810 |
| Events in quadrant C | 2,975,637 | 570,221 |
| Events in quadrant D | 3,279,873 | 562,845 |
| Mode M9 | |||
|---|---|---|---|
| Quadrant | BADHDUFLAG | Total packets | Discarded packets |
| A | 0 | 13 | 0 |
| B | 0 | 13 | 0 |
| C | 0 | 13 | 0 |
| D | 0 | 13 | 0 |
| Mode M0 | |||
|---|---|---|---|
| Quadrant | BADHDUFLAG | Total packets | Discarded packets |
| A | 0 | 13798 | 2 |
| B | 0 | 13467 | 1 |
| C | 0 | 12991 | 1 |
| D | 0 | 13841 | 1 |
| Mode SS | |||
|---|---|---|---|
| Quadrant | BADHDUFLAG | Total packets | Discarded packets |
| A | 0 | 126 | 0 |
| B | 0 | 126 | 0 |
| C | 0 | 126 | 0 |
| D | 0 | 126 | 0 |
| Quadrant | Total seconds | Saturated seconds | Saturation percentage |
|---|---|---|---|
| A | 6214 | 95 | 1.528806% |
| B | 6214 | 90 | 1.448342% |
| C | 6214 | 65 | 1.046025% |
| D | 6214 | 97 | 1.560991% |
Noise dominated data is calculated using 1-second bins in cleaned event files. If a bin has >2000 counts, and if more than 50% of those come from <1% of pixels, then it is considered to be noise-dominated and hence unusable.
| Quadrant | # 1 sec bins | Bins with >0 counts | Bins with >2000 counts | High rate bins dominated by noise | Noise dominated (total time) | Noise dominated (detector-on time) | Marked lightcurve |
|---|---|---|---|---|---|---|---|
| A | 7474 | 6215 | 1 | 1 | 0.01% | 0.02% | 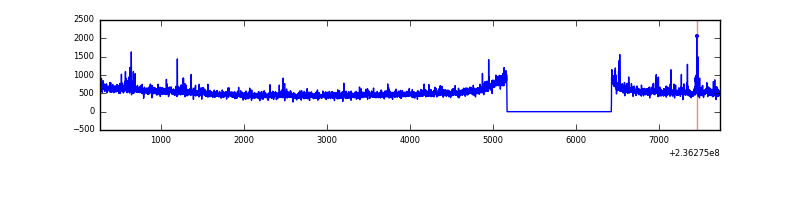 |
| B | 7474 | 6215 | 2 | 2 | 0.03% | 0.03% | 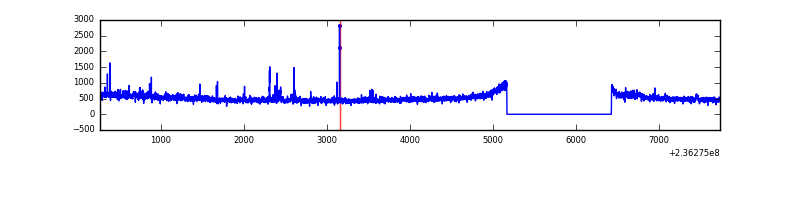 |
| C | 7474 | 6215 | 0 | 0 | 0.00% | 0.00% | 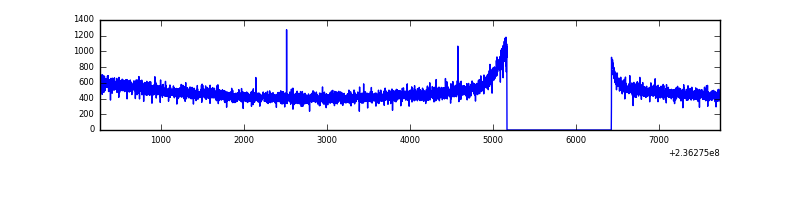 |
| D | 7474 | 6215 | 19 | 19 | 0.25% | 0.31% | 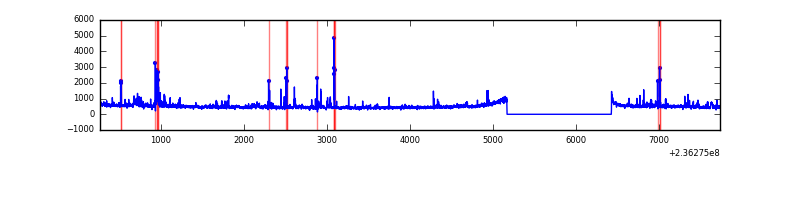 |
Top three noisy pixels from each quadrant. If the there are fewer than three noisy pixels in the level2.evt file, extra rows are filled as -1
| Pixel properties | Quadrant properties | ||||||
|---|---|---|---|---|---|---|---|
| Quadrant | DetID | PixID | Counts | Sigma | Mean | Median | Sigma |
| A | 8 | 5 | 182465 | 1117.51 | 796 | 781 | 162.6 |
| A | 14 | 111 | 22632 | 134.4 | 796 | 781 | 162.6 |
| A | 1 | 162 | 20418 | 120.78 | 796 | 781 | 162.6 |
| B | 0 | 214 | 56619 | 376.54 | 785 | 767 | 148.3 |
| B | 0 | 219 | 27267 | 178.66 | 785 | 767 | 148.3 |
| B | 0 | 229 | 20524 | 133.2 | 785 | 767 | 148.3 |
| C | 14 | 67 | 13907 | 74.69 | 758 | 760 | 176.0 |
| C | 13 | 61 | 5889 | 29.14 | 758 | 760 | 176.0 |
| C | 9 | 68 | 4405 | 20.71 | 758 | 760 | 176.0 |
| D | 1 | 52 | 161947 | 810.54 | 762 | 744 | 198.9 |
| D | 13 | 104 | 134872 | 674.41 | 762 | 744 | 198.9 |
| D | 7 | 71 | 45166 | 223.36 | 762 | 744 | 198.9 |
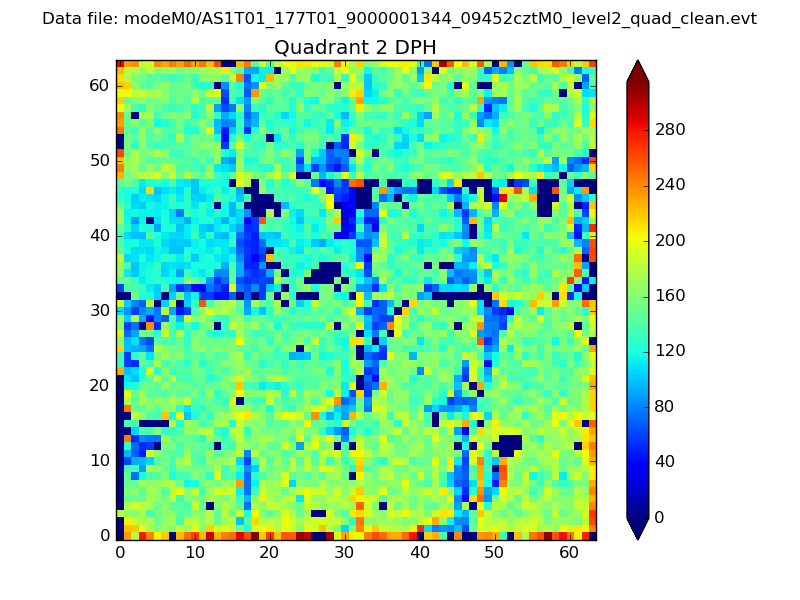
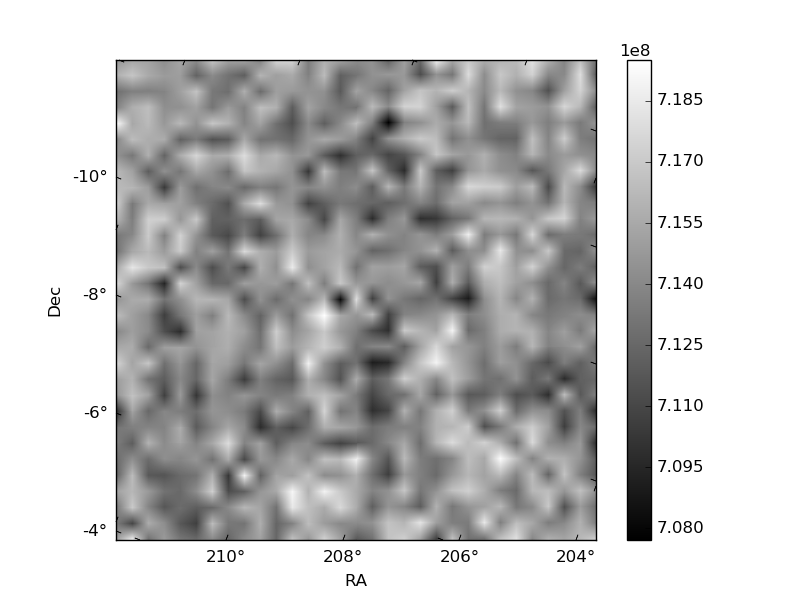
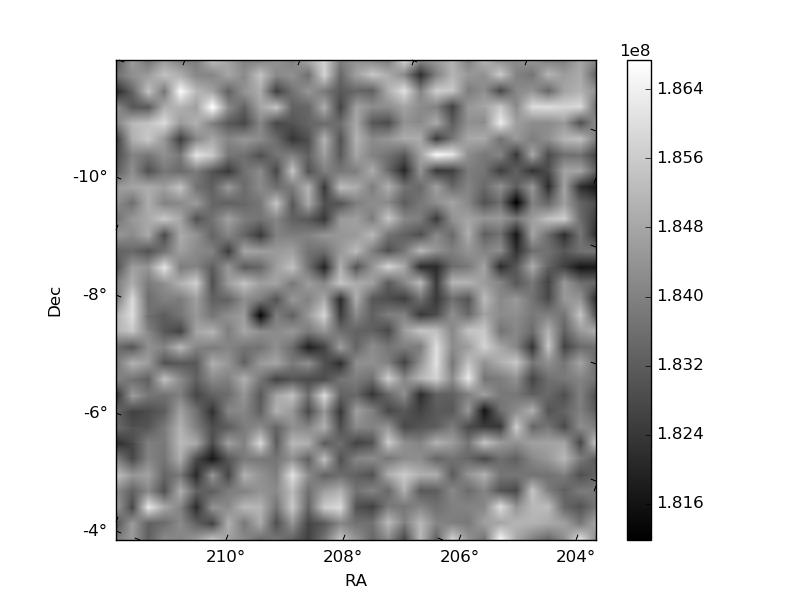
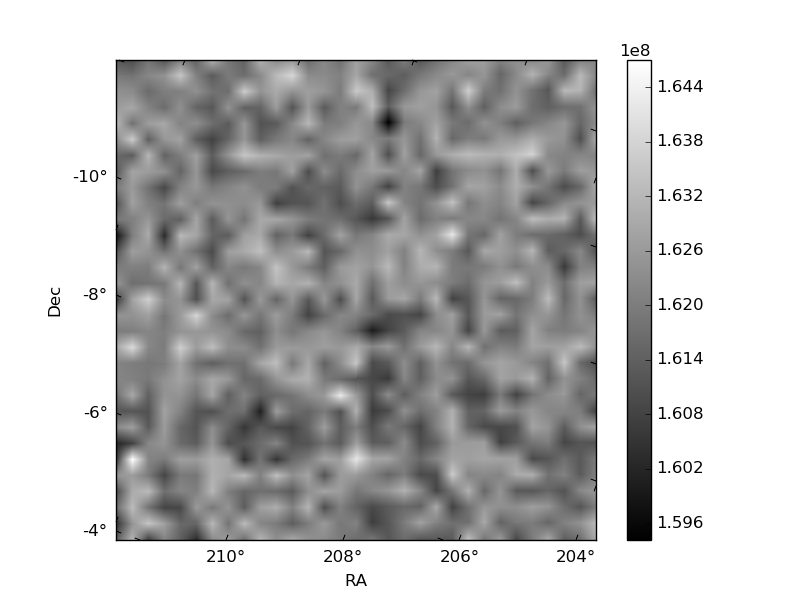
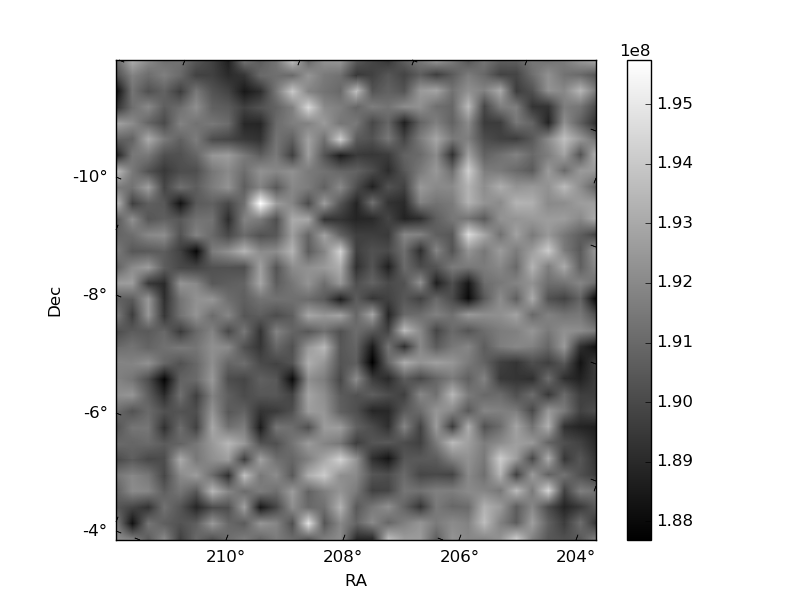
Histogram calculated using DETX and DETY for each event in the final _common_clean file
| Quadrant A | 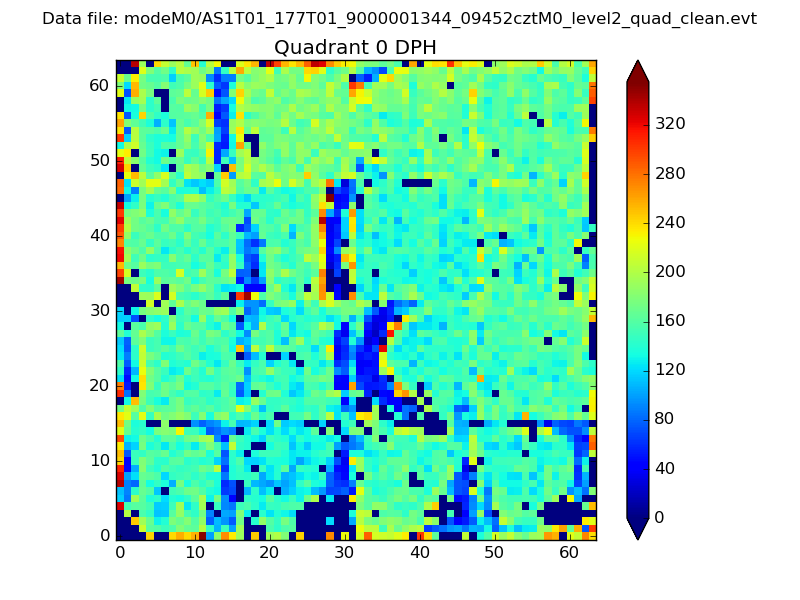 |
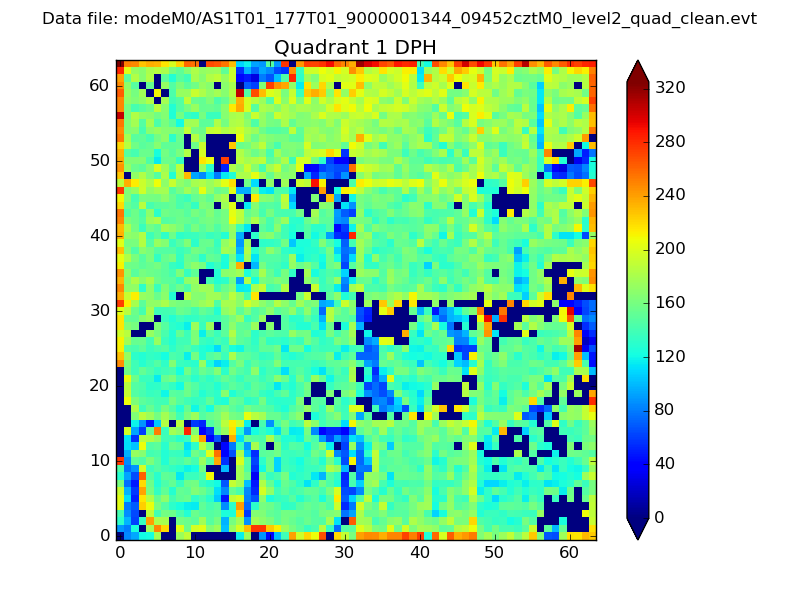 |
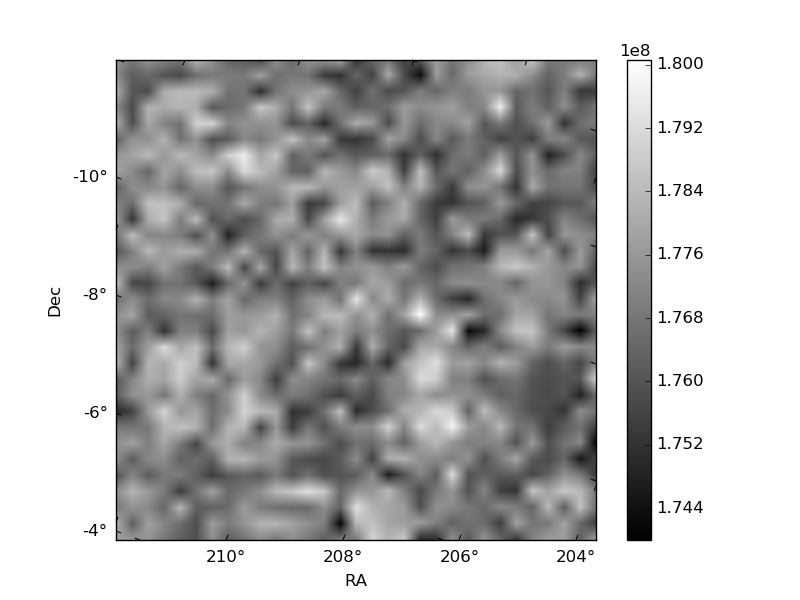
Quadrant B |
|---|---|---|---|
| Quadrant D | 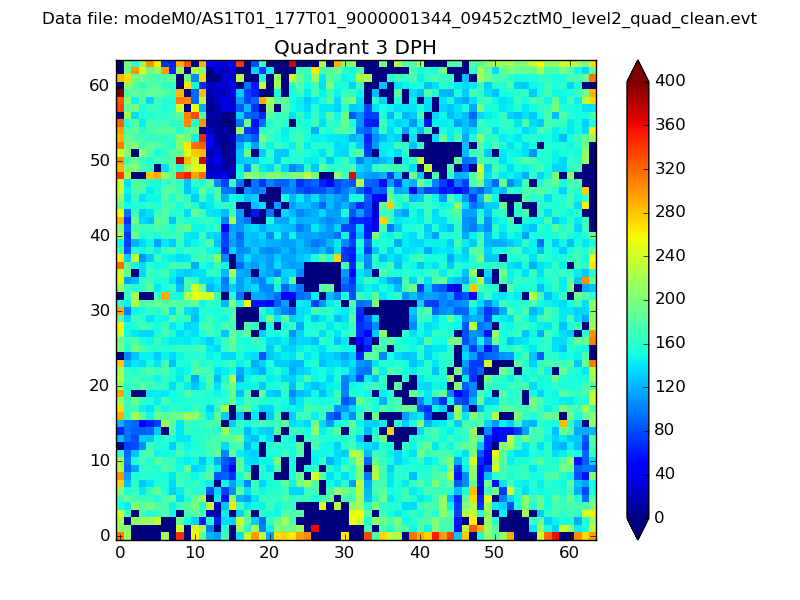 |
 |
Quadrant C |
| Plot type | Count rate plots | Images |
|---|---|---|
| Comparison with Poisson distribution Blue bars denote a histogram of data divided into 1 sec bins. Red curve is a Poisson curve with rate = median count rate of data. |
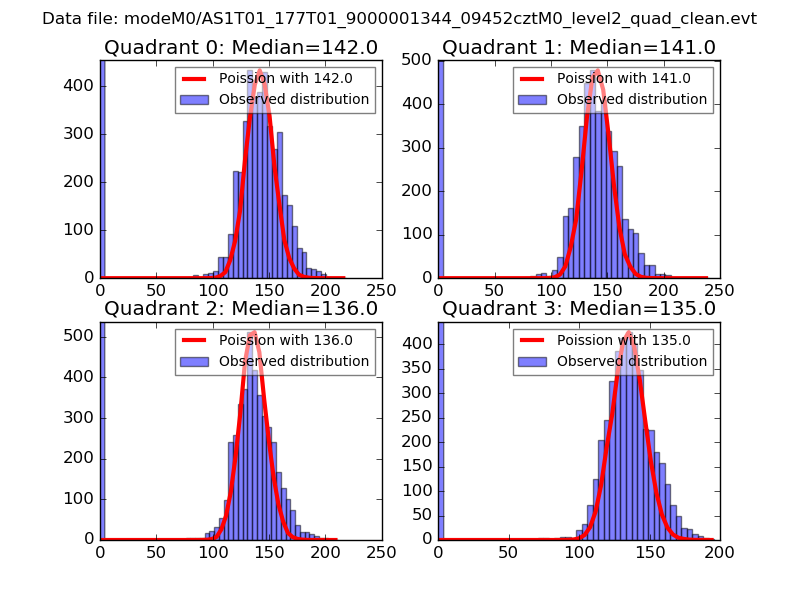 |
 |
| Quadrant-wise count rates Data is divided into 100 sec bins |
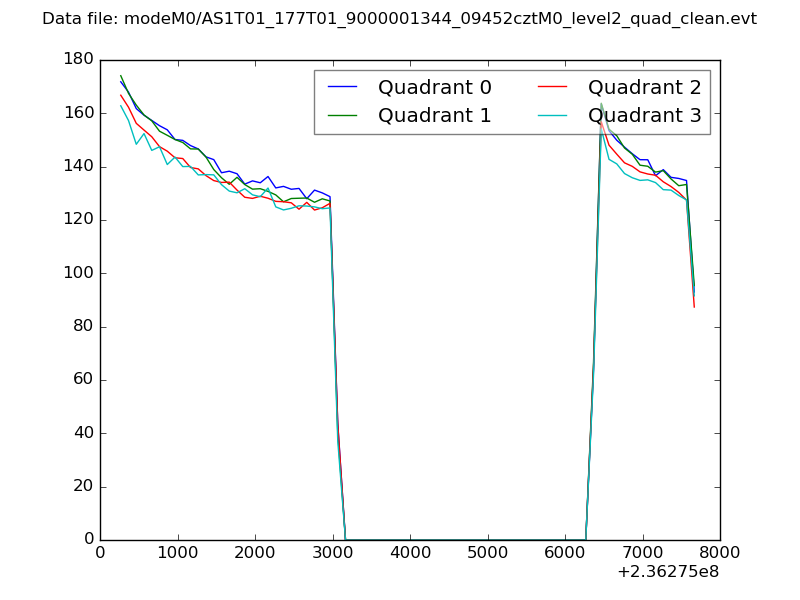 |
|
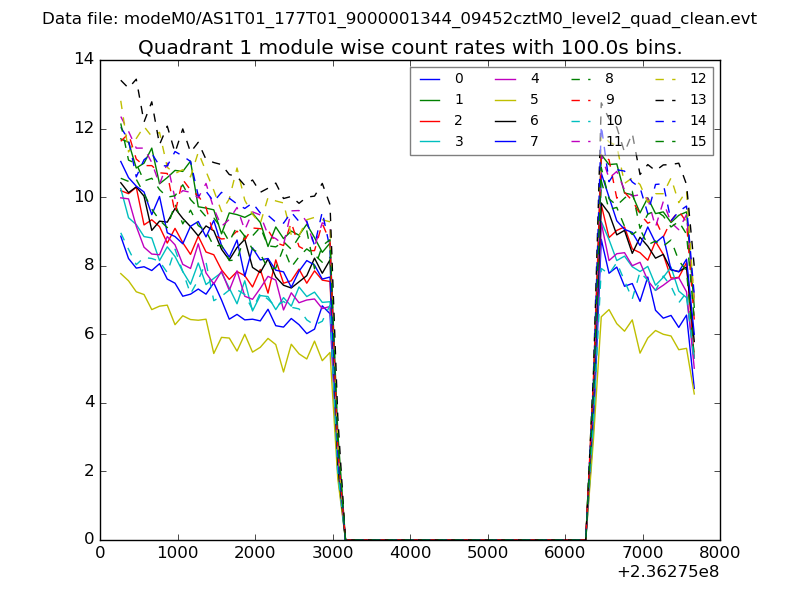
| Module-wise count rates for Quadrant A Data is divided into 100 sec bins |
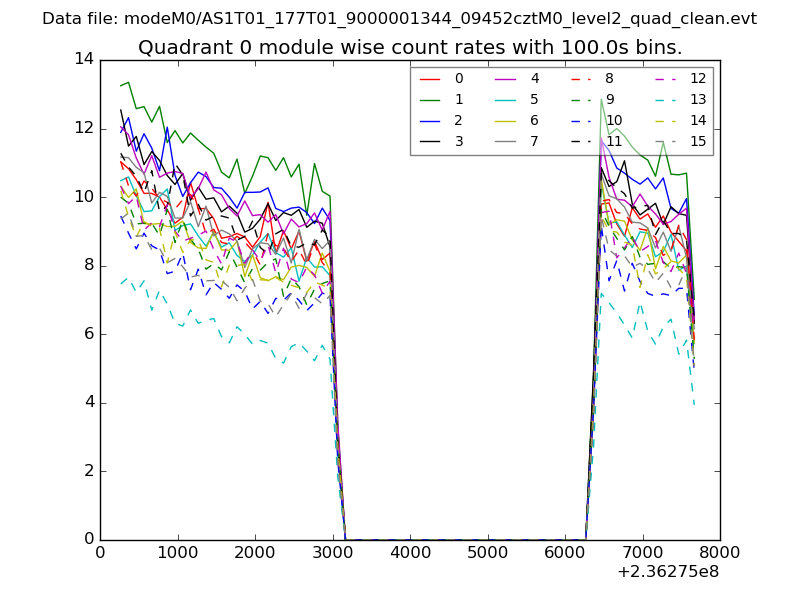 |
 |
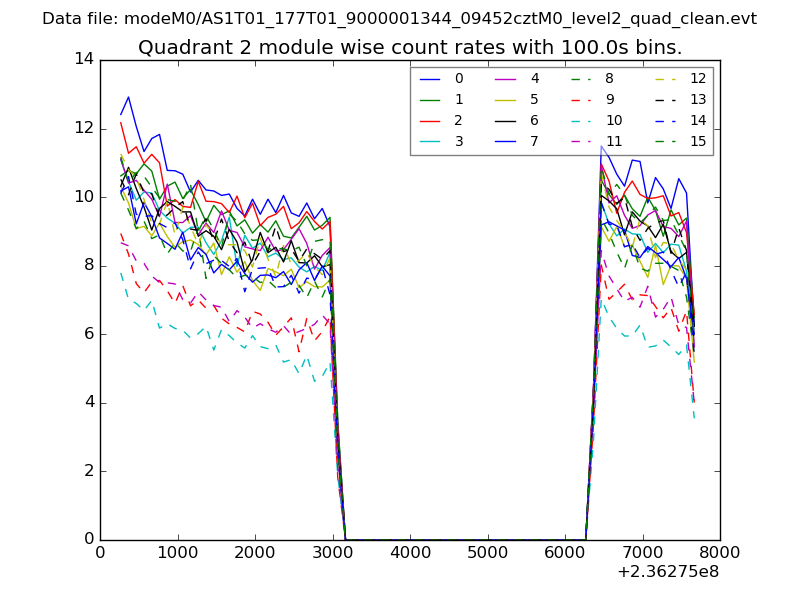
| Module-wise count rates for Quadrant B Data is divided into 100 sec bins |
 |
 |
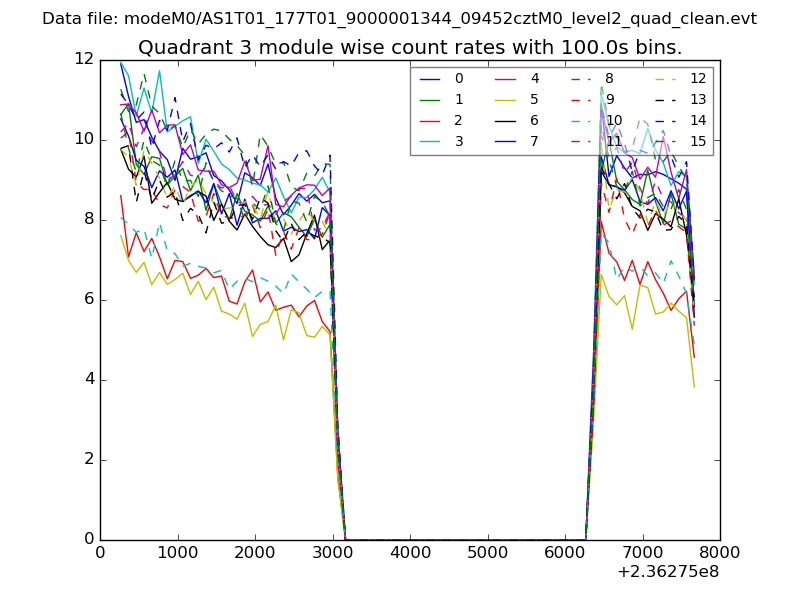
| Module-wise count rates for Quadrant C Data is divided into 100 sec bins |
 |
 |
| Module-wise count rates for Quadrant D Data is divided into 100 sec bins |
 |
 |
| Parameter | Plot |
|---|---|
| CZT HV Monitor | 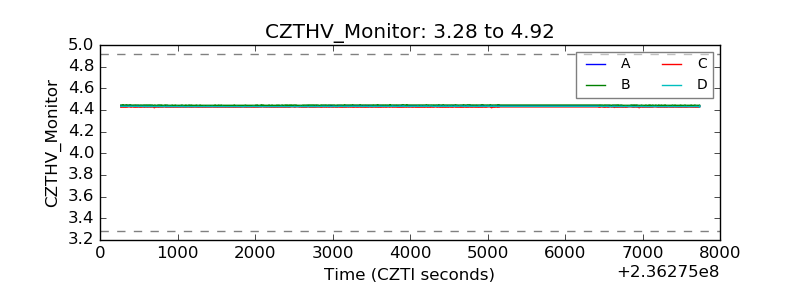 |
| D_VDD | 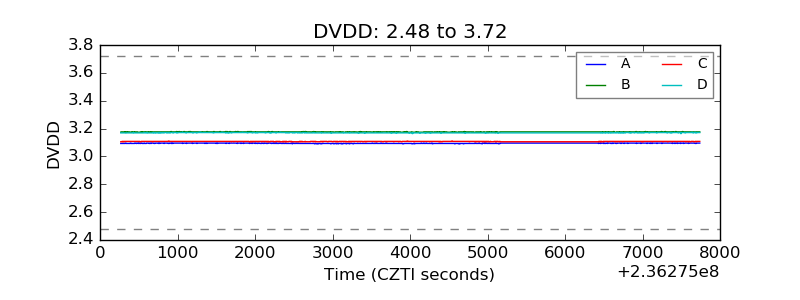 |
| Temperature 1 | 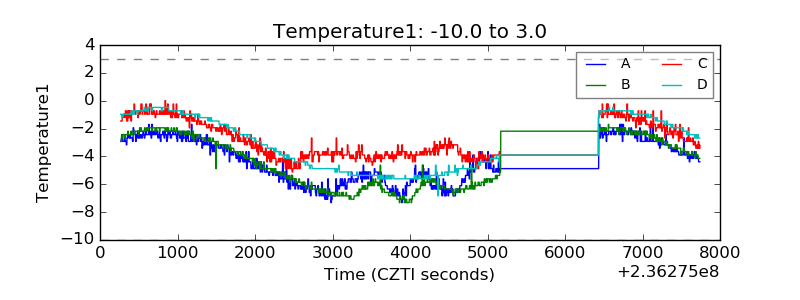 |
| Veto HV Monitor |  |
| Veto LLD | 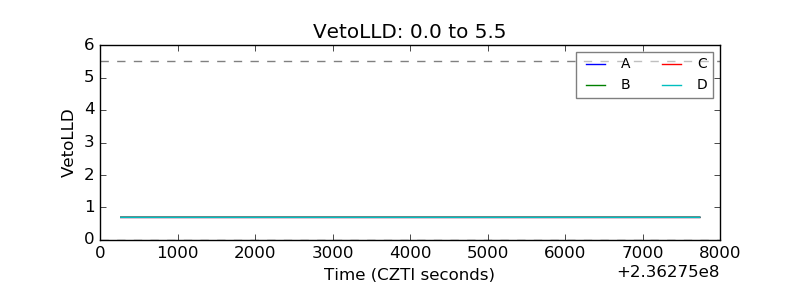 |
| Alpha Counter | 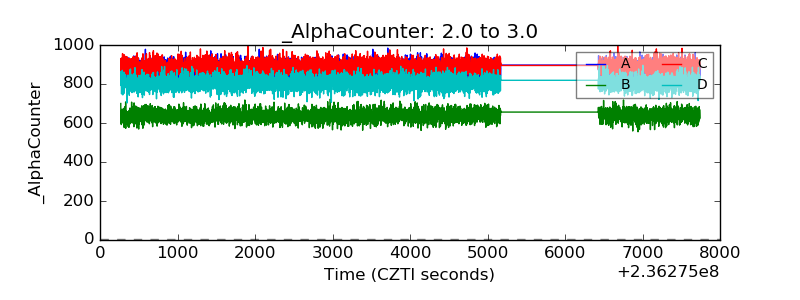 |
| _CPM_Rate | 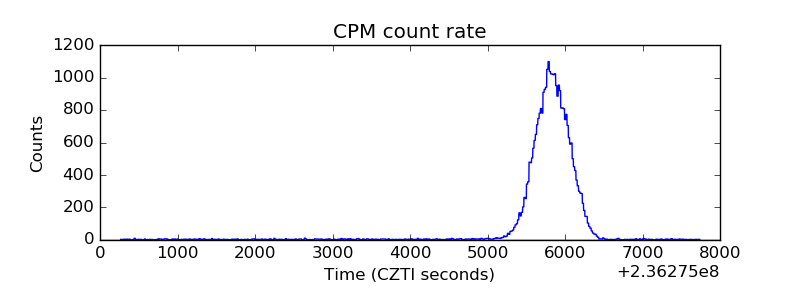 |
| CZT Counter | 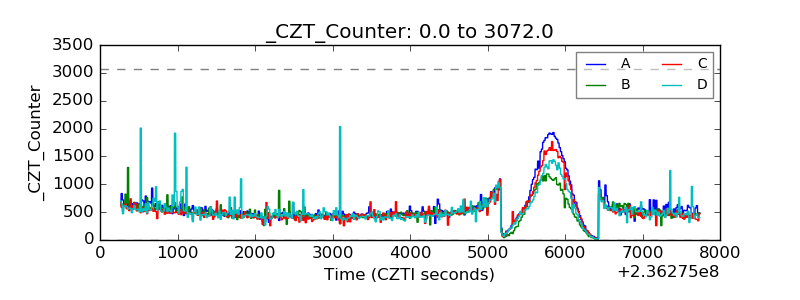 |
| +2.5 Volts monitor | 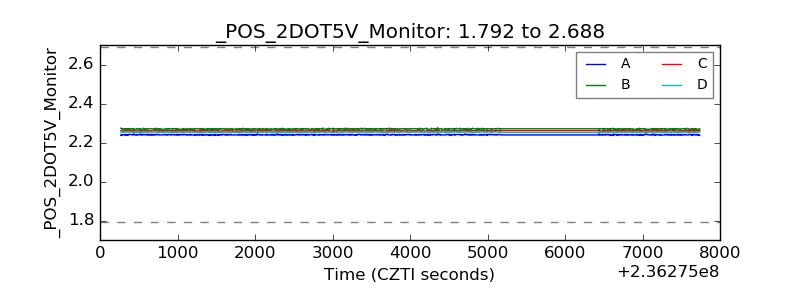 |
| +5 Volts monitor |  |
| _ROLL_ROT | 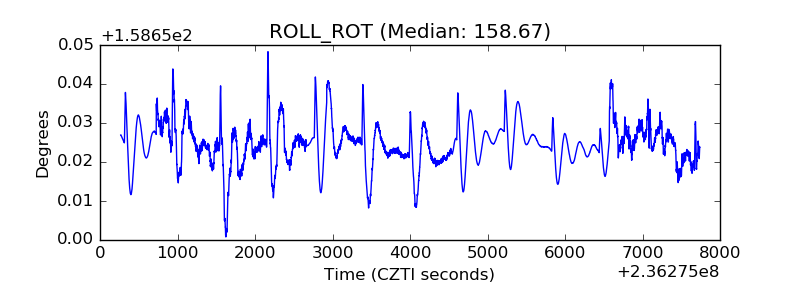 |
| _Roll_DEC | 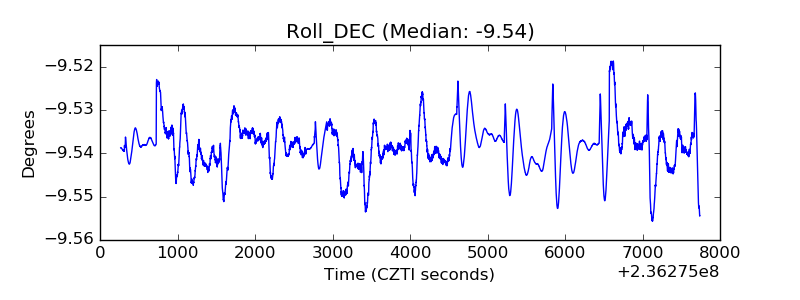 |
| _Roll_RA | 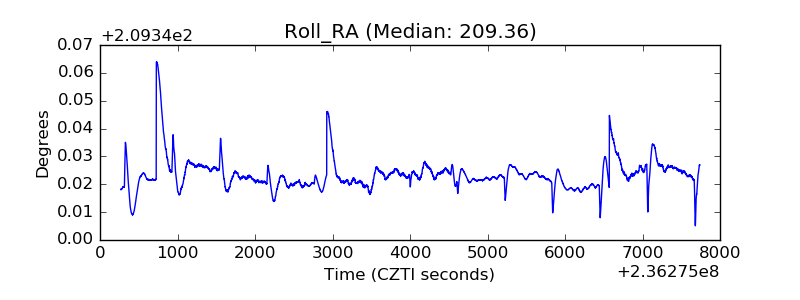 |
| Veto Counter | 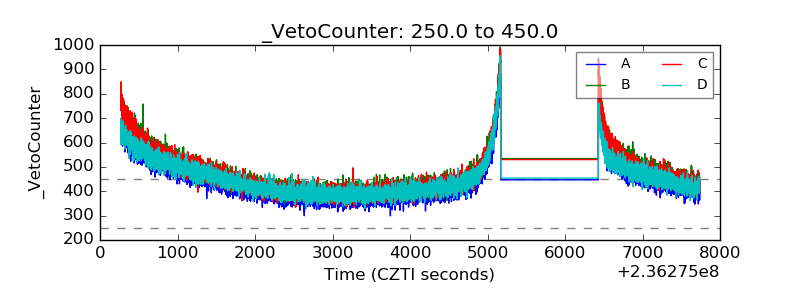 |