| Param | Original file | Final file |
|---|---|---|
| Filename | modeM0/AS1T01_177T01_9000001344_09454cztM0_level2.evt | modeM0/AS1T01_177T01_9000001344_09454cztM0_level2_quad_clean.evt |
| Size (bytes) | 481,973,760 | 94,452,480 |
| Size | 459.6 MB | 90.1 MB |
| Events in quadrant A | 3,748,789 | 603,073 |
| Events in quadrant B | 3,375,379 | 604,208 |
| Events in quadrant C | 3,418,966 | 589,752 |
| Events in quadrant D | 3,582,170 | 580,091 |
| Mode M9 | |||
|---|---|---|---|
| Quadrant | BADHDUFLAG | Total packets | Discarded packets |
| A | 0 | 20 | 0 |
| B | 0 | 20 | 0 |
| C | 0 | 20 | 0 |
| D | 0 | 20 | 0 |
| Mode M0 | |||
|---|---|---|---|
| Quadrant | BADHDUFLAG | Total packets | Discarded packets |
| A | 0 | 15752 | 3 |
| B | 0 | 14605 | 2 |
| C | 0 | 15069 | 2 |
| D | 0 | 15456 | 2 |
| Mode SS | |||
|---|---|---|---|
| Quadrant | BADHDUFLAG | Total packets | Discarded packets |
| A | 0 | 142 | 0 |
| B | 0 | 142 | 0 |
| C | 0 | 142 | 0 |
| D | 0 | 142 | 0 |
| Quadrant | Total seconds | Saturated seconds | Saturation percentage |
|---|---|---|---|
| A | 6940 | 125 | 1.801153% |
| B | 6940 | 73 | 1.051873% |
| C | 6940 | 139 | 2.002882% |
| D | 6940 | 98 | 1.412104% |
Noise dominated data is calculated using 1-second bins in cleaned event files. If a bin has >2000 counts, and if more than 50% of those come from <1% of pixels, then it is considered to be noise-dominated and hence unusable.
| Quadrant | # 1 sec bins | Bins with >0 counts | Bins with >2000 counts | High rate bins dominated by noise | Noise dominated (total time) | Noise dominated (detector-on time) | Marked lightcurve |
|---|---|---|---|---|---|---|---|
| A | 8880 | 6942 | 22 | 22 | 0.25% | 0.32% | 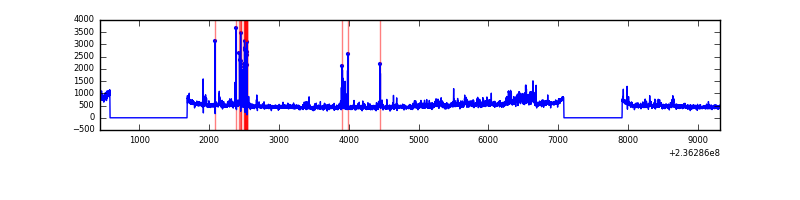 |
| B | 8880 | 6942 | 2 | 2 | 0.02% | 0.03% | 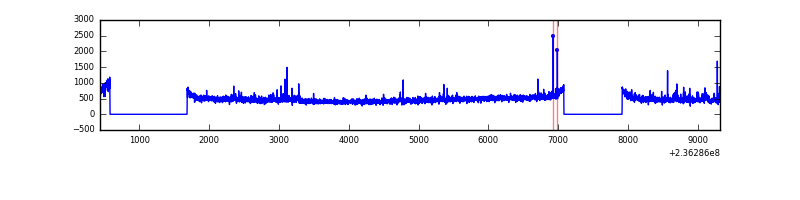 |
| C | 8880 | 6942 | 66 | 66 | 0.74% | 0.95% | 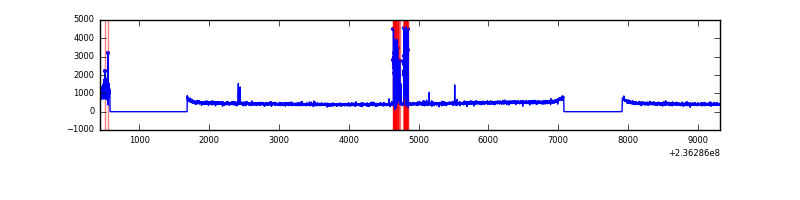 |
| D | 8880 | 6942 | 35 | 35 | 0.39% | 0.50% | 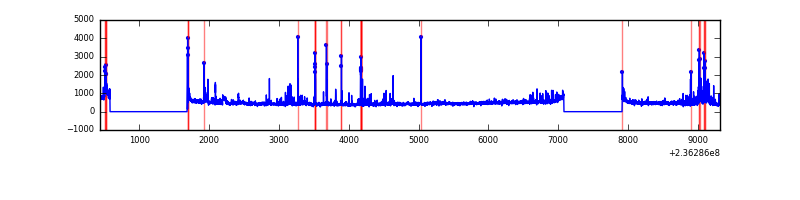 |
Top three noisy pixels from each quadrant. If the there are fewer than three noisy pixels in the level2.evt file, extra rows are filled as -1
| Pixel properties | Quadrant properties | ||||||
|---|---|---|---|---|---|---|---|
| Quadrant | DetID | PixID | Counts | Sigma | Mean | Median | Sigma |
| A | 8 | 5 | 351264 | 2039.5 | 834 | 817 | 171.8 |
| A | 14 | 111 | 116858 | 675.32 | 834 | 817 | 171.8 |
| A | 8 | 15 | 42488 | 242.51 | 834 | 817 | 171.8 |
| B | 0 | 214 | 48059 | 293.75 | 835 | 813 | 160.8 |
| B | 5 | 255 | 22323 | 133.74 | 835 | 813 | 160.8 |
| B | 0 | 229 | 22183 | 132.87 | 835 | 813 | 160.8 |
| C | 4 | 254 | 291919 | 1551.92 | 799 | 802 | 187.6 |
| C | 9 | 68 | 7146 | 33.82 | 799 | 802 | 187.6 |
| C | 13 | 61 | 6104 | 28.26 | 799 | 802 | 187.6 |
| D | 1 | 52 | 170689 | 829.87 | 801 | 780 | 204.7 |
| D | 8 | 195 | 93433 | 452.54 | 801 | 780 | 204.7 |
| D | 13 | 104 | 92130 | 446.17 | 801 | 780 | 204.7 |
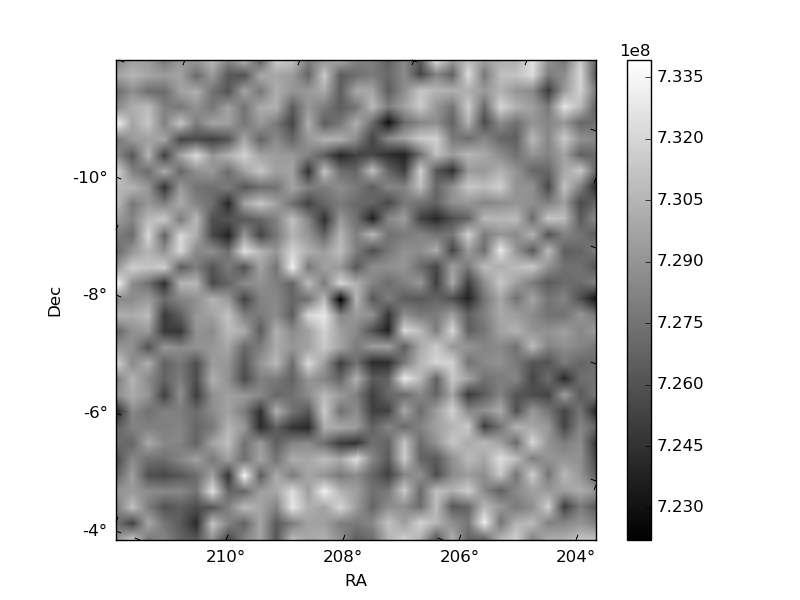
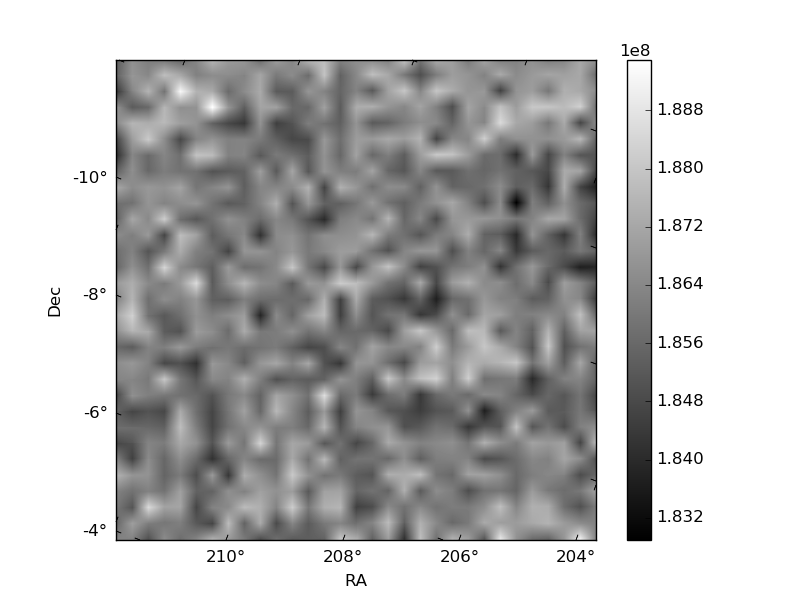
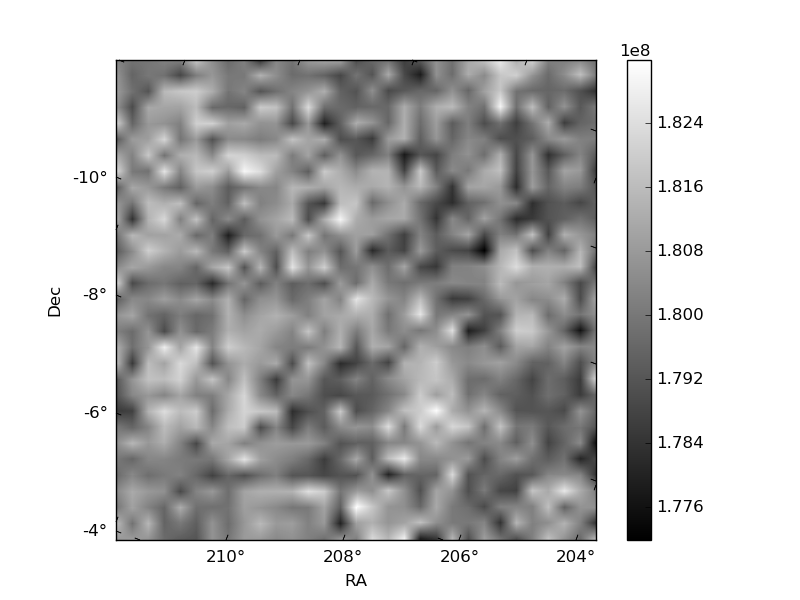
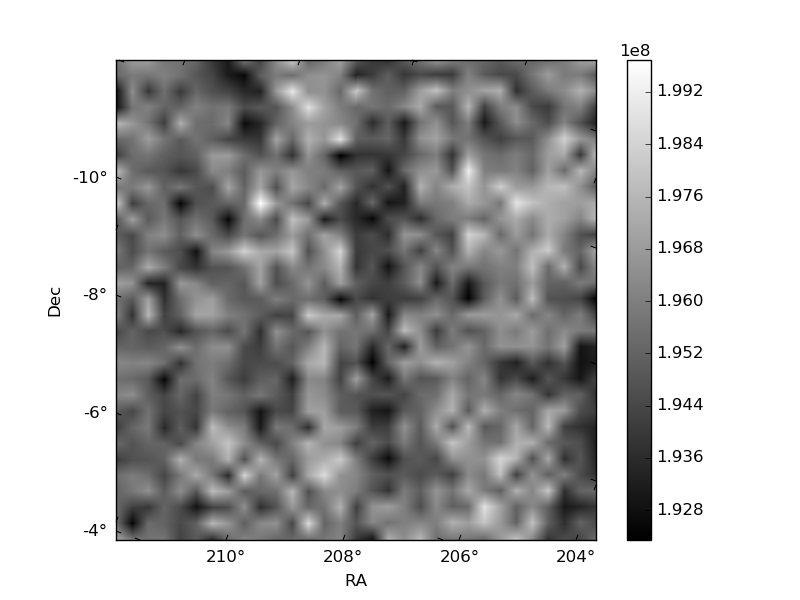
Histogram calculated using DETX and DETY for each event in the final _common_clean file
| Quadrant A | 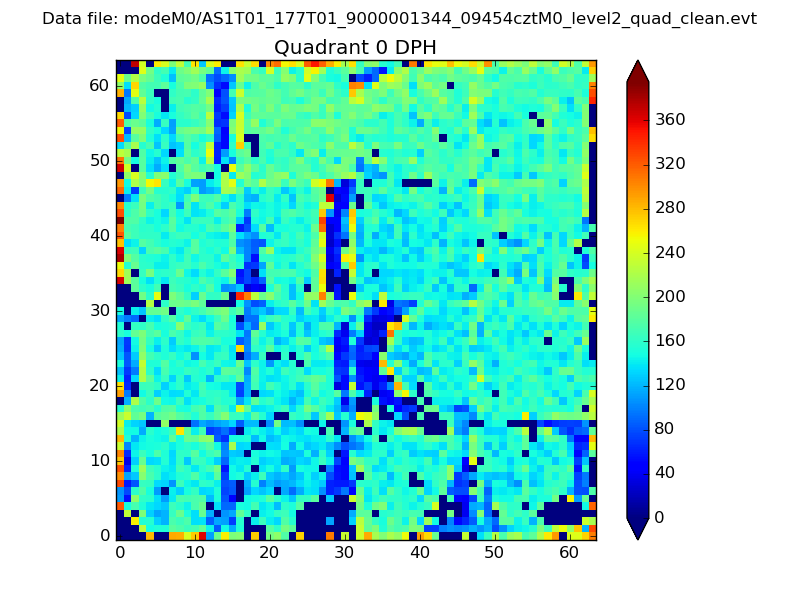 |
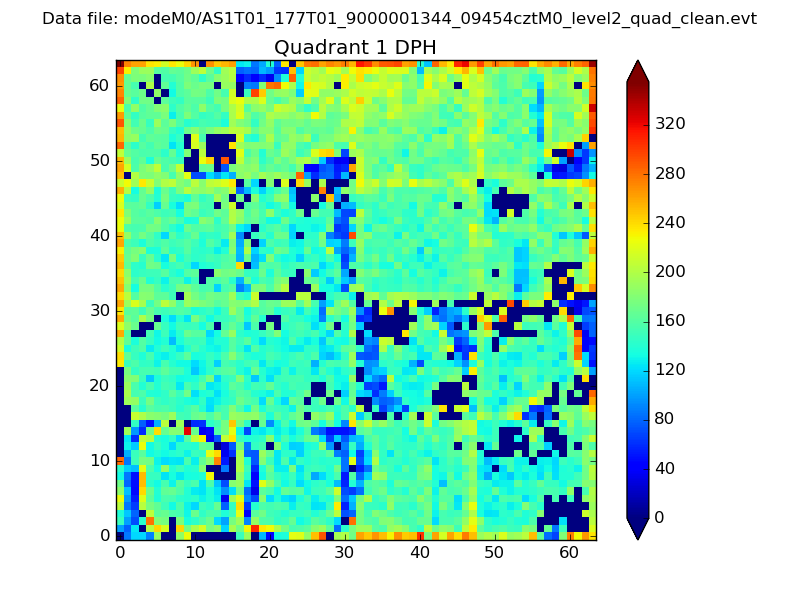 |
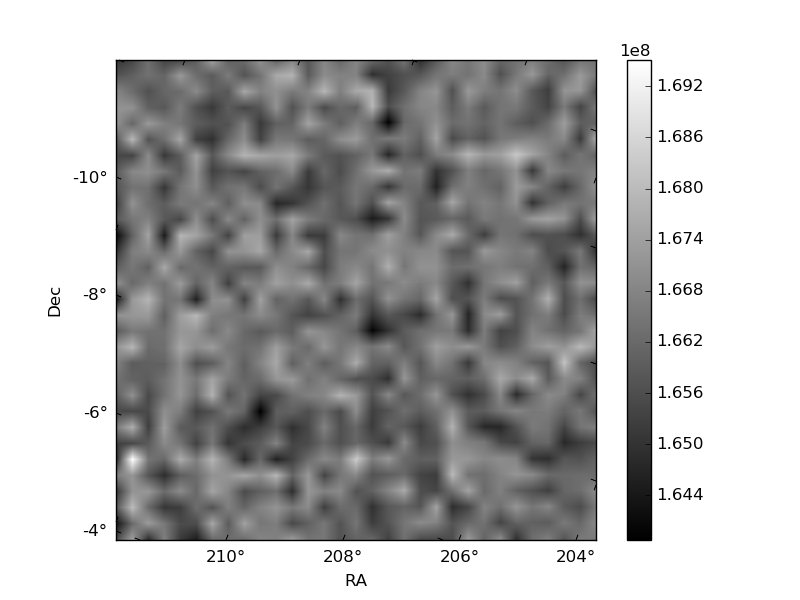
Quadrant B |
|---|---|---|---|
| Quadrant D | 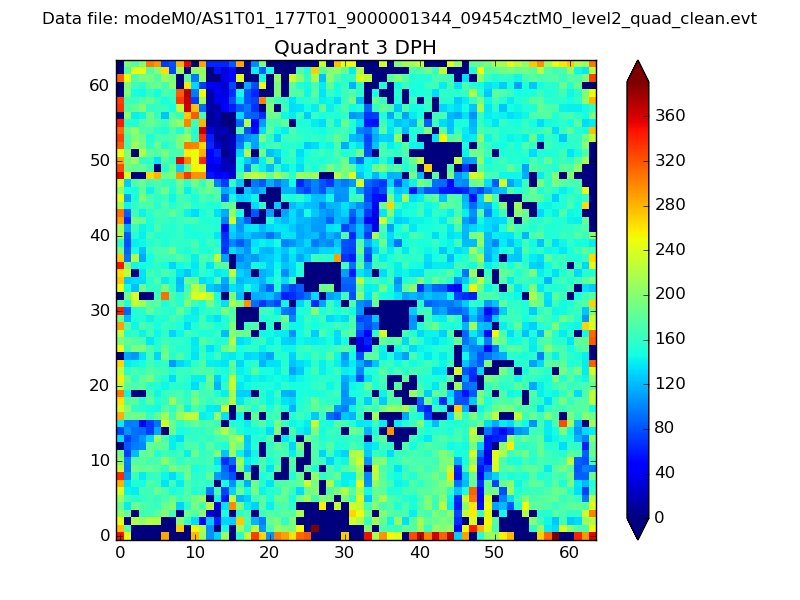 |
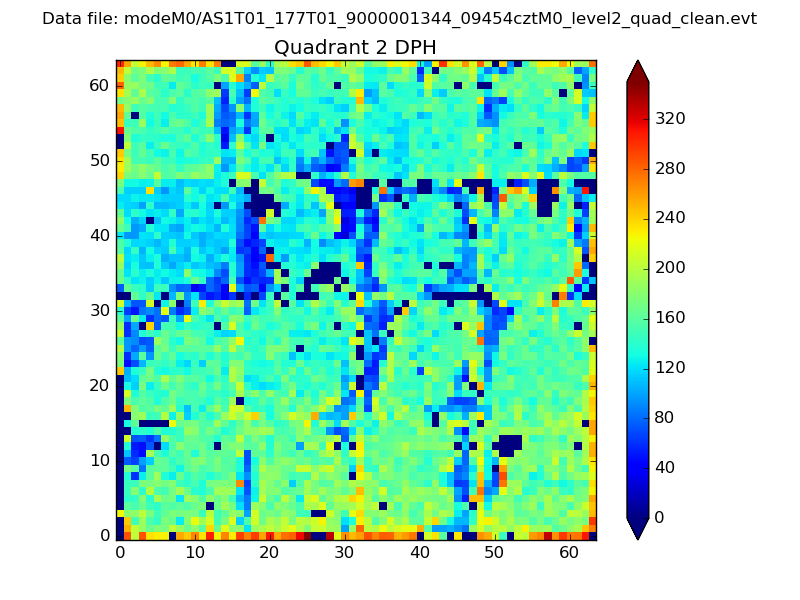 |
Quadrant C |
| Plot type | Count rate plots | Images |
|---|---|---|
| Comparison with Poisson distribution Blue bars denote a histogram of data divided into 1 sec bins. Red curve is a Poisson curve with rate = median count rate of data. |
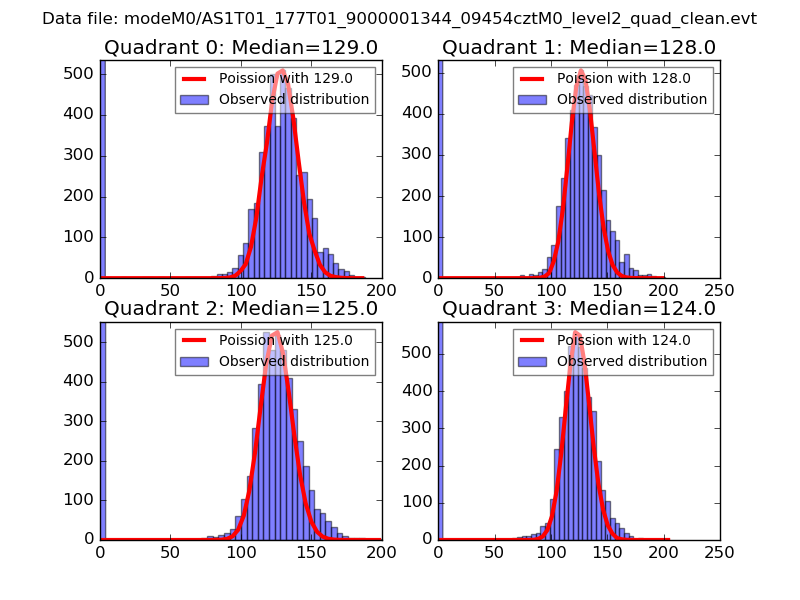 |
 |
| Quadrant-wise count rates Data is divided into 100 sec bins |
 |
|
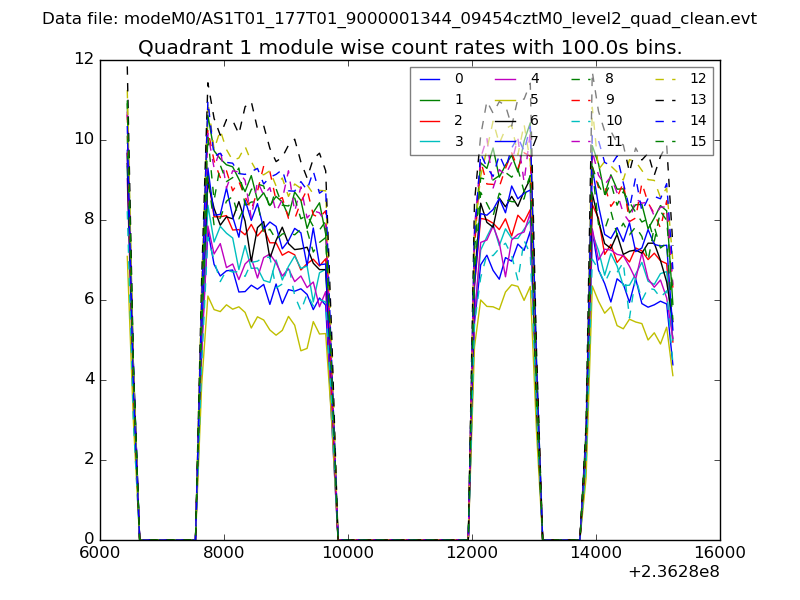
| Module-wise count rates for Quadrant A Data is divided into 100 sec bins |
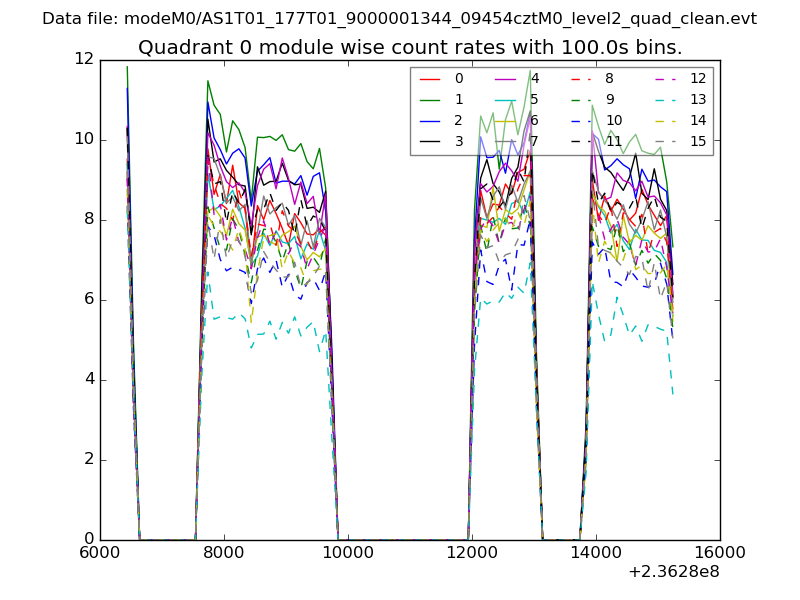 |
 |
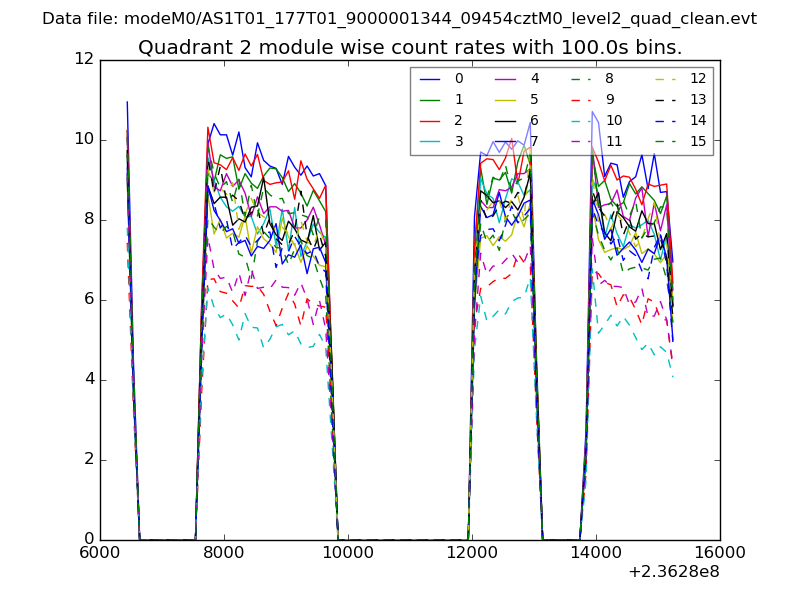
| Module-wise count rates for Quadrant B Data is divided into 100 sec bins |
 |
 |
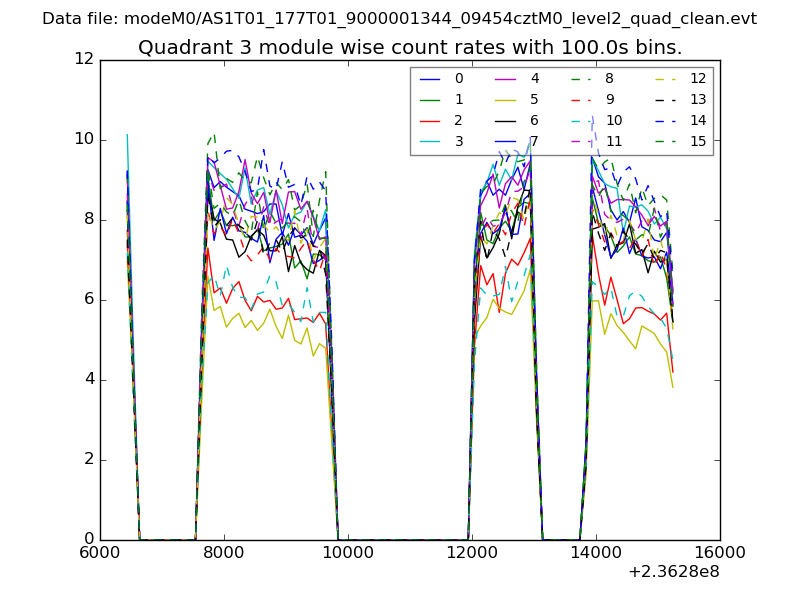
| Module-wise count rates for Quadrant C Data is divided into 100 sec bins |
 |
 |
| Module-wise count rates for Quadrant D Data is divided into 100 sec bins |
 |
 |
| Parameter | Plot |
|---|---|
| CZT HV Monitor | 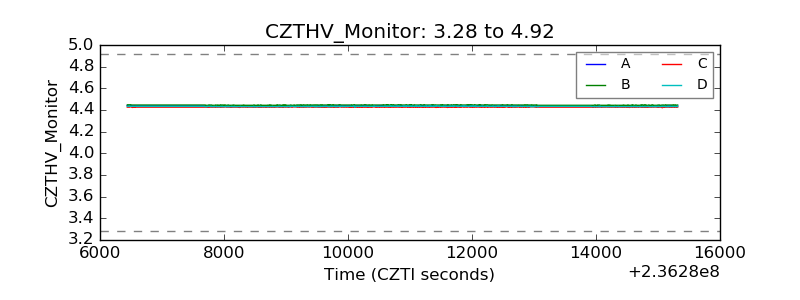 |
| D_VDD | 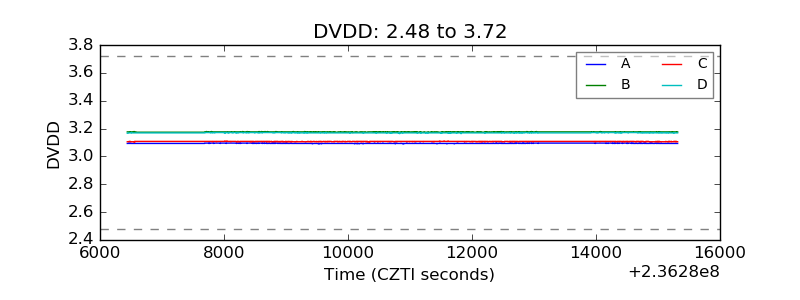 |
| Temperature 1 | 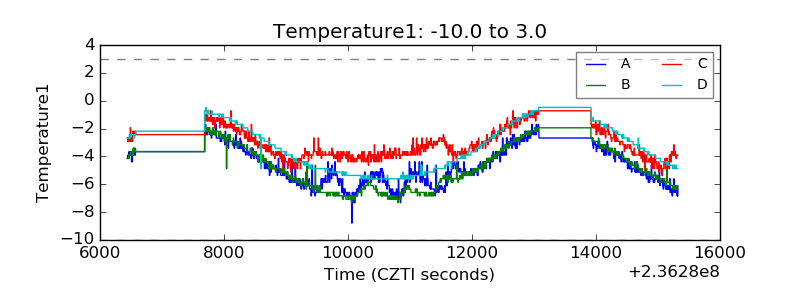 |
| Veto HV Monitor | 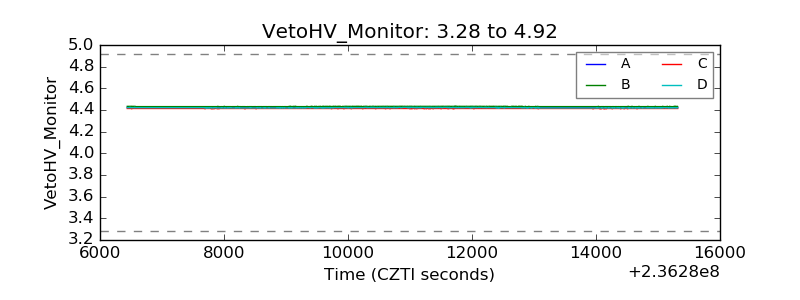 |
| Veto LLD |  |
| Alpha Counter | 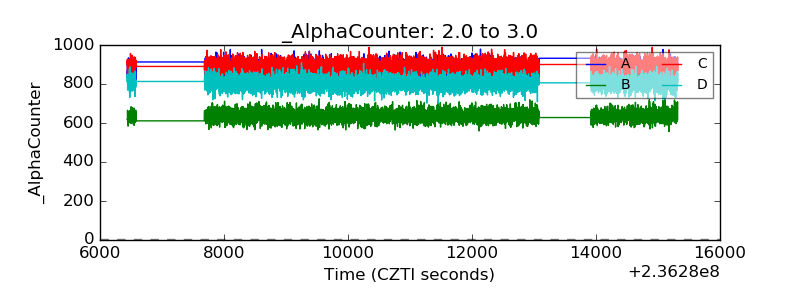 |
| _CPM_Rate | 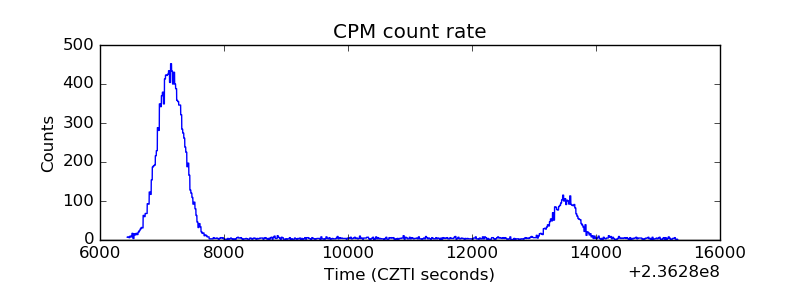 |
| CZT Counter | 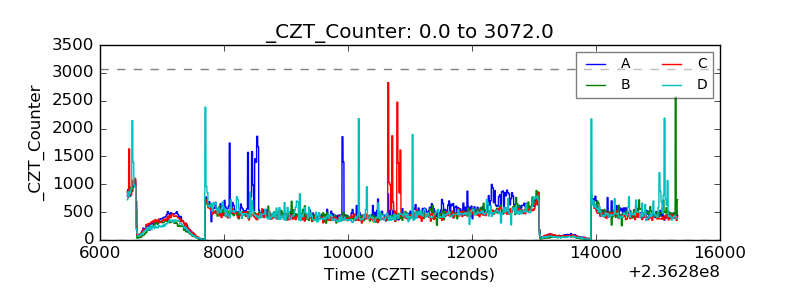 |
| +2.5 Volts monitor |  |
| +5 Volts monitor |  |
| _ROLL_ROT | 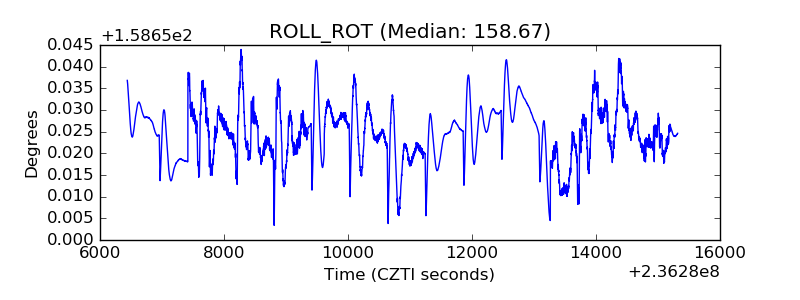 |
| _Roll_DEC | 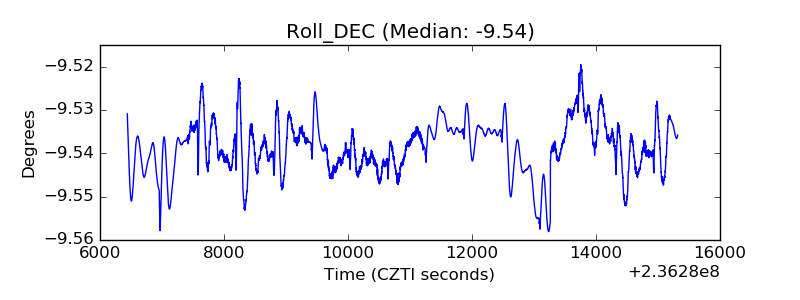 |
| _Roll_RA | 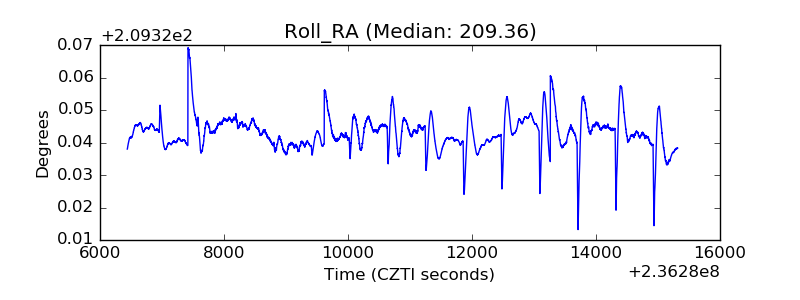 |
| Veto Counter | 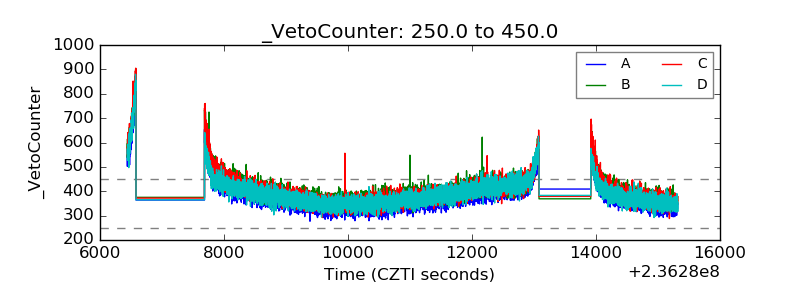 |