| Param | Original file | Final file |
|---|---|---|
| Filename | modeM0/AS1T01_177T01_9000001344_09455cztM0_level2.evt | modeM0/AS1T01_177T01_9000001344_09455cztM0_level2_quad_clean.evt |
| Size (bytes) | 485,328,960 | 100,702,080 |
| Size | 462.8 MB | 96.0 MB |
| Events in quadrant A | 3,601,030 | 646,417 |
| Events in quadrant B | 3,570,008 | 642,485 |
| Events in quadrant C | 3,302,596 | 629,537 |
| Events in quadrant D | 3,725,234 | 619,735 |
| Mode M9 | |||
|---|---|---|---|
| Quadrant | BADHDUFLAG | Total packets | Discarded packets |
| A | 0 | 13 | 0 |
| B | 0 | 13 | 0 |
| C | 0 | 13 | 0 |
| D | 0 | 13 | 0 |
| Mode M0 | |||
|---|---|---|---|
| Quadrant | BADHDUFLAG | Total packets | Discarded packets |
| A | 0 | 15537 | 3 |
| B | 0 | 15542 | 2 |
| C | 0 | 15126 | 2 |
| D | 0 | 16233 | 2 |
| Mode SS | |||
|---|---|---|---|
| Quadrant | BADHDUFLAG | Total packets | Discarded packets |
| A | 0 | 150 | 0 |
| B | 0 | 150 | 0 |
| C | 0 | 150 | 0 |
| D | 0 | 150 | 0 |
| Quadrant | Total seconds | Saturated seconds | Saturation percentage |
|---|---|---|---|
| A | 7353 | 42 | 0.571195% |
| B | 7353 | 39 | 0.530396% |
| C | 7353 | 12 | 0.163199% |
| D | 7353 | 53 | 0.720794% |
Noise dominated data is calculated using 1-second bins in cleaned event files. If a bin has >2000 counts, and if more than 50% of those come from <1% of pixels, then it is considered to be noise-dominated and hence unusable.
| Quadrant | # 1 sec bins | Bins with >0 counts | Bins with >2000 counts | High rate bins dominated by noise | Noise dominated (total time) | Noise dominated (detector-on time) | Marked lightcurve |
|---|---|---|---|---|---|---|---|
| A | 8558 | 7355 | 1 | 1 | 0.01% | 0.01% | 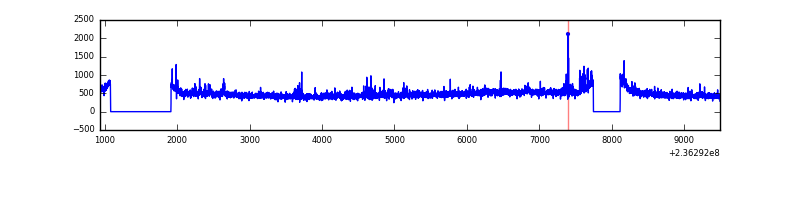 |
| B | 8558 | 7355 | 3 | 3 | 0.04% | 0.04% | 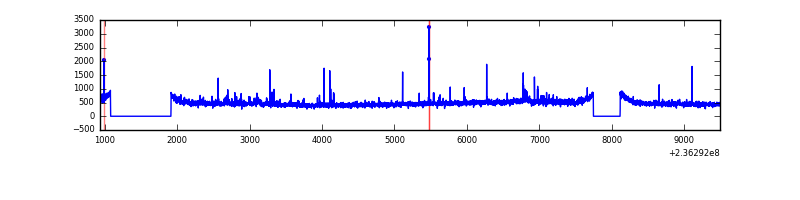 |
| C | 8558 | 7355 | 6 | 6 | 0.07% | 0.08% | 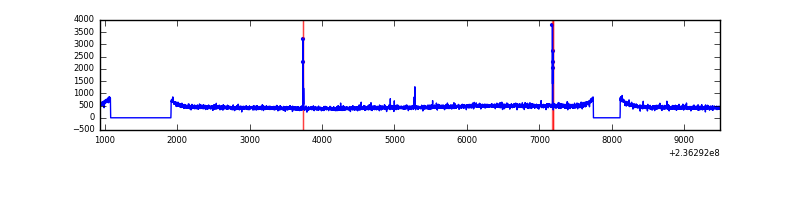 |
| D | 8558 | 7355 | 28 | 28 | 0.33% | 0.38% | 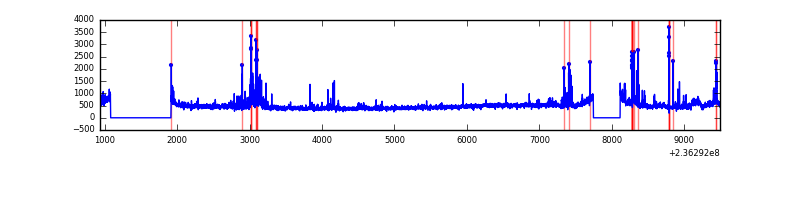 |
Top three noisy pixels from each quadrant. If the there are fewer than three noisy pixels in the level2.evt file, extra rows are filled as -1
| Pixel properties | Quadrant properties | ||||||
|---|---|---|---|---|---|---|---|
| Quadrant | DetID | PixID | Counts | Sigma | Mean | Median | Sigma |
| A | 8 | 5 | 103016 | 571.16 | 874 | 854 | 178.9 |
| A | 1 | 162 | 65212 | 359.81 | 874 | 854 | 178.9 |
| A | 1 | 178 | 24189 | 130.46 | 874 | 854 | 178.9 |
| B | 0 | 214 | 58997 | 347.0 | 871 | 848 | 167.6 |
| B | 5 | 255 | 51411 | 301.73 | 871 | 848 | 167.6 |
| B | 0 | 219 | 30699 | 178.14 | 871 | 848 | 167.6 |
| C | 4 | 254 | 25693 | 127.05 | 837 | 841 | 195.6 |
| C | 13 | 61 | 6501 | 28.94 | 837 | 841 | 195.6 |
| C | 14 | 234 | 5622 | 24.44 | 837 | 841 | 195.6 |
| D | 8 | 195 | 192495 | 900.33 | 836 | 814 | 212.9 |
| D | 7 | 71 | 144219 | 673.58 | 836 | 814 | 212.9 |
| D | 1 | 52 | 82174 | 382.15 | 836 | 814 | 212.9 |
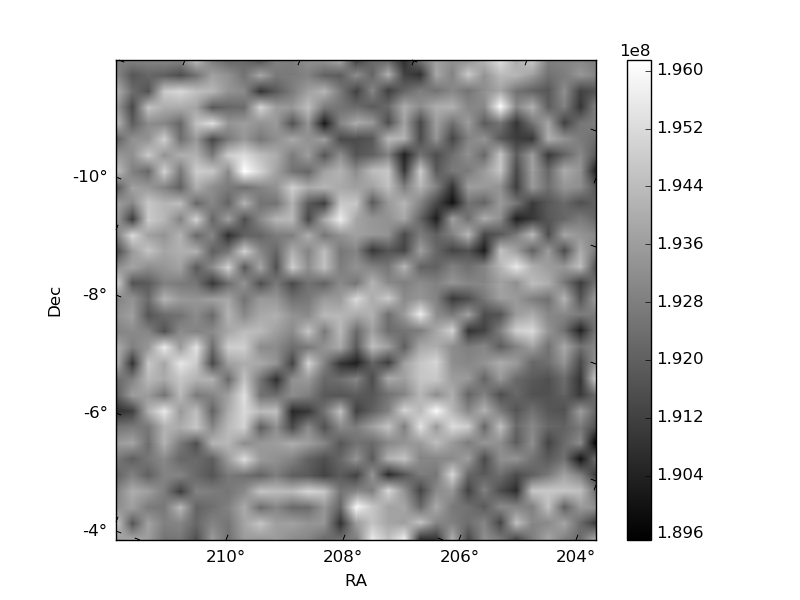
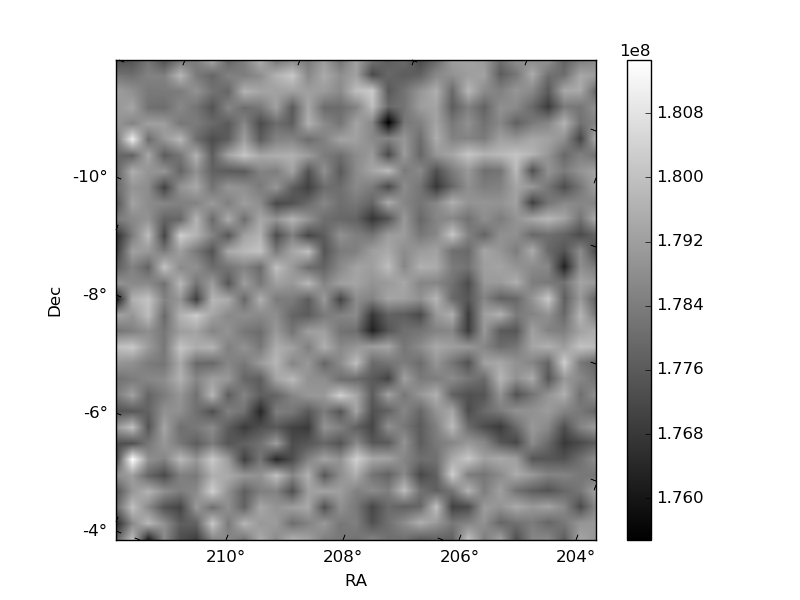
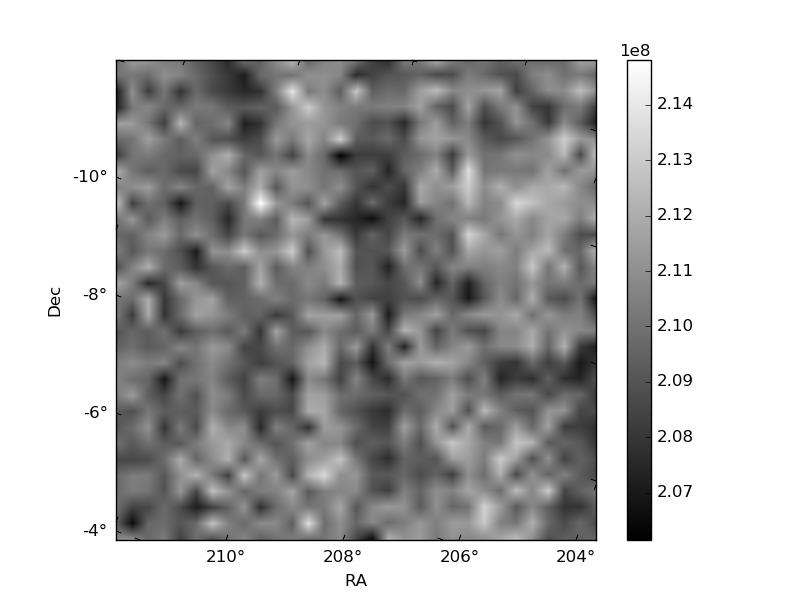
Histogram calculated using DETX and DETY for each event in the final _common_clean file
| Quadrant A | 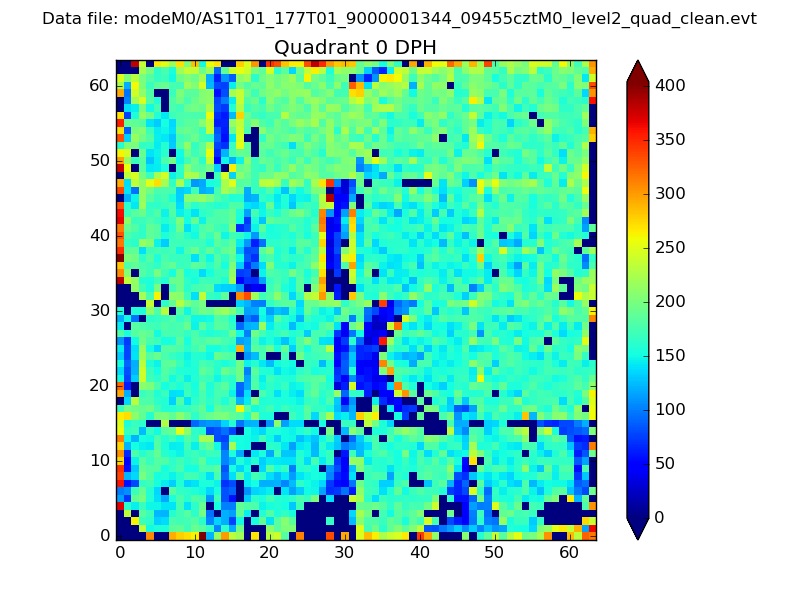 |
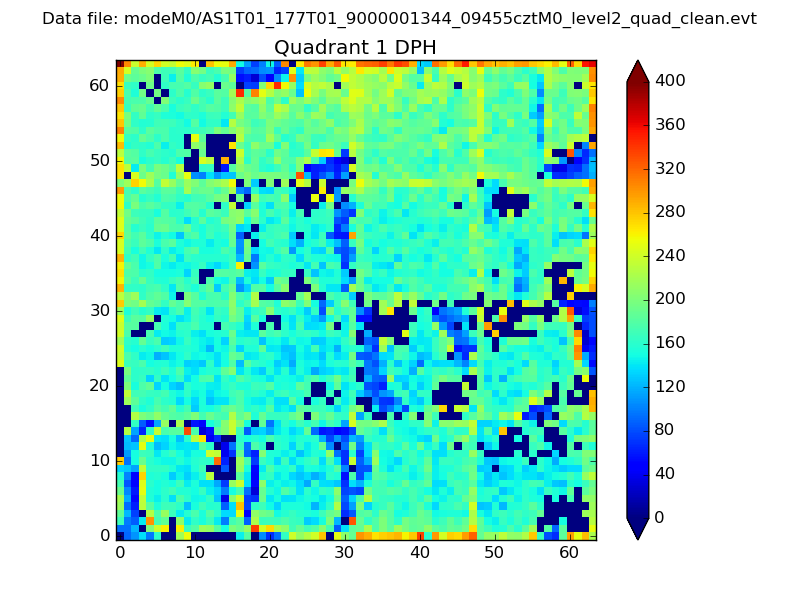 |
Quadrant B |
|---|---|---|---|
| Quadrant D | 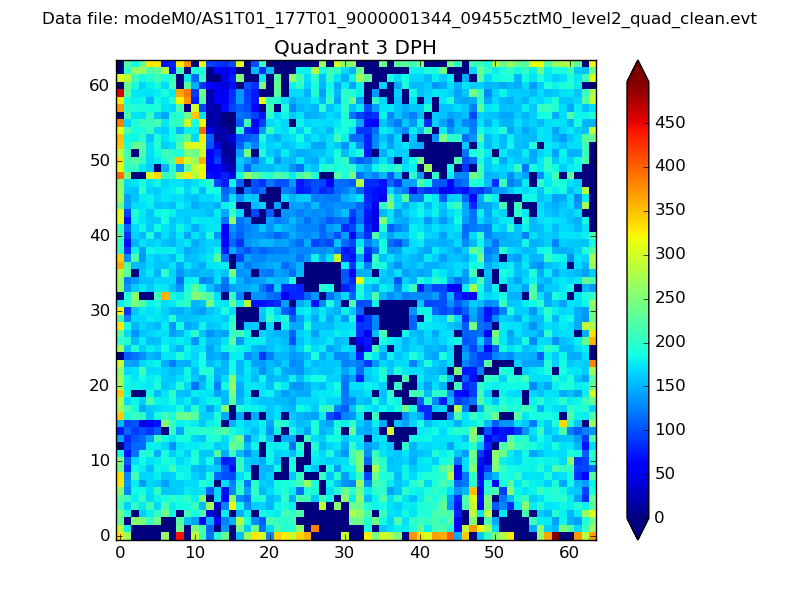 |
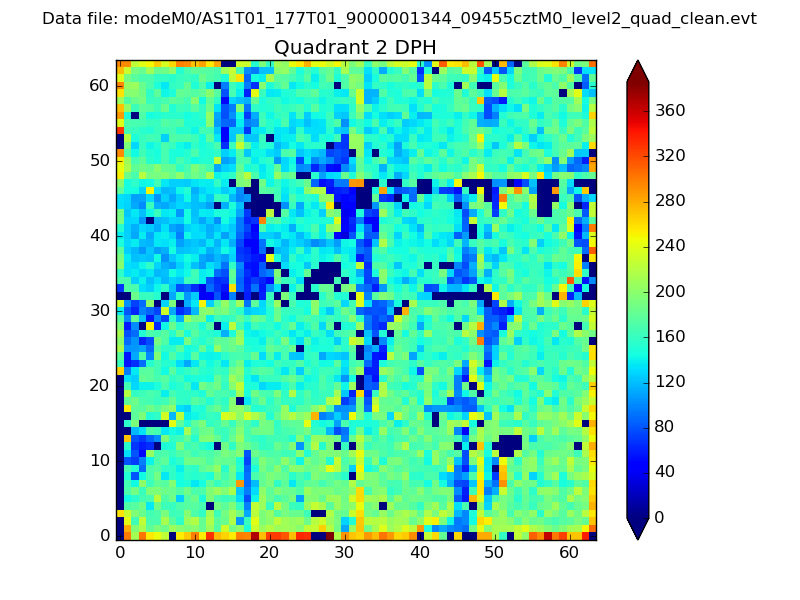 |
Quadrant C |
| Plot type | Count rate plots | Images |
|---|---|---|
| Comparison with Poisson distribution Blue bars denote a histogram of data divided into 1 sec bins. Red curve is a Poisson curve with rate = median count rate of data. |
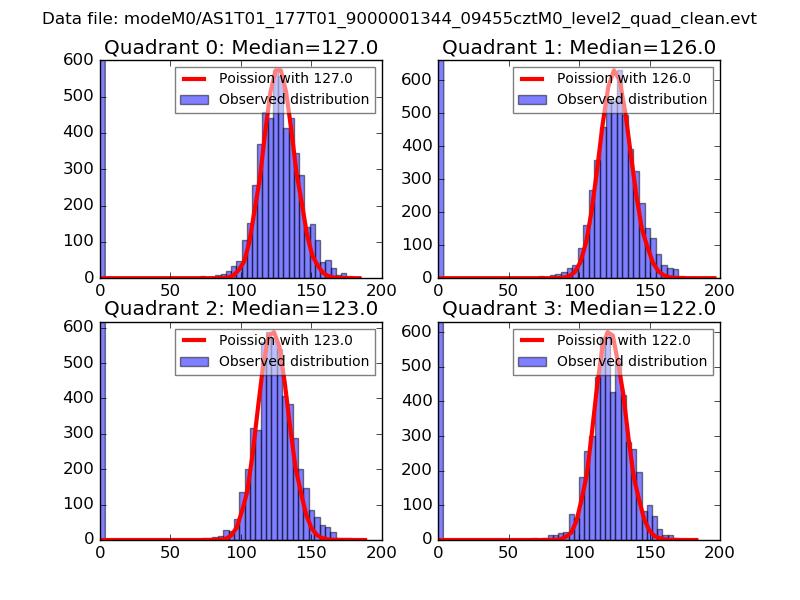 |
 |
| Quadrant-wise count rates Data is divided into 100 sec bins |
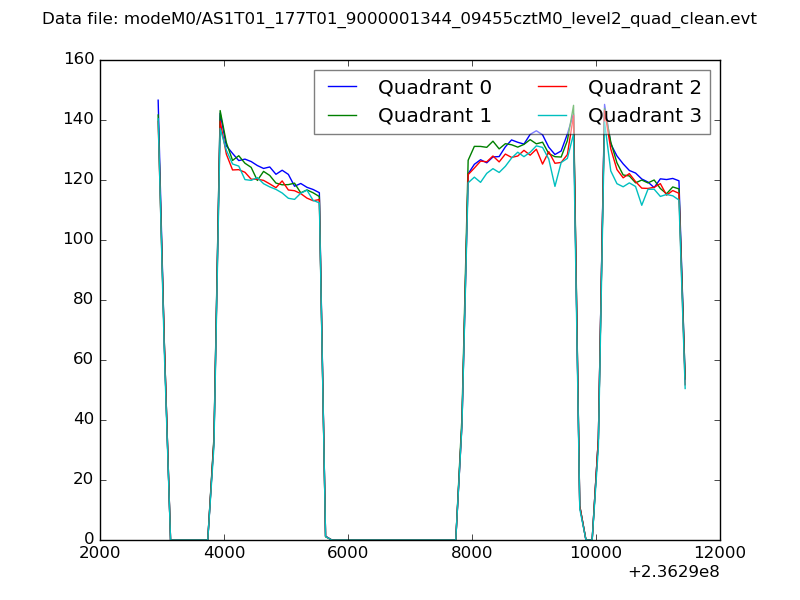 |
|
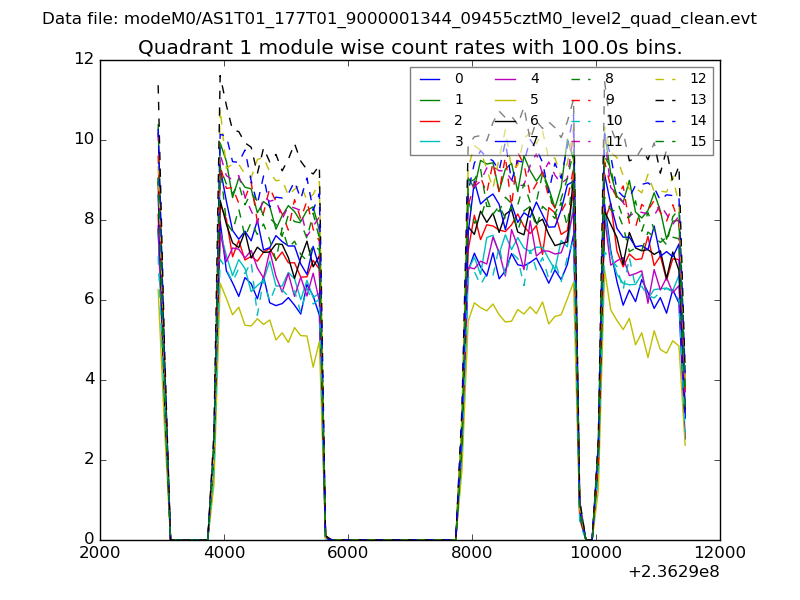
| Module-wise count rates for Quadrant A Data is divided into 100 sec bins |
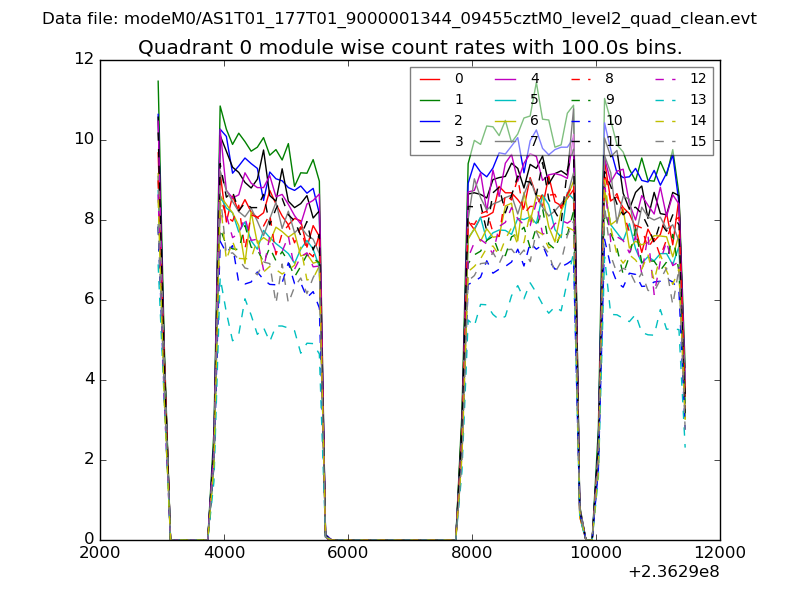 |
 |
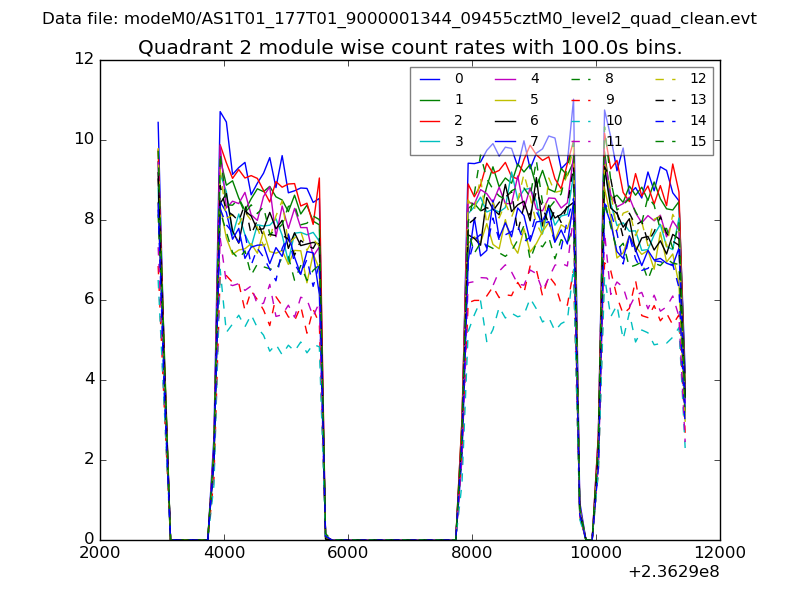
| Module-wise count rates for Quadrant B Data is divided into 100 sec bins |
 |
 |
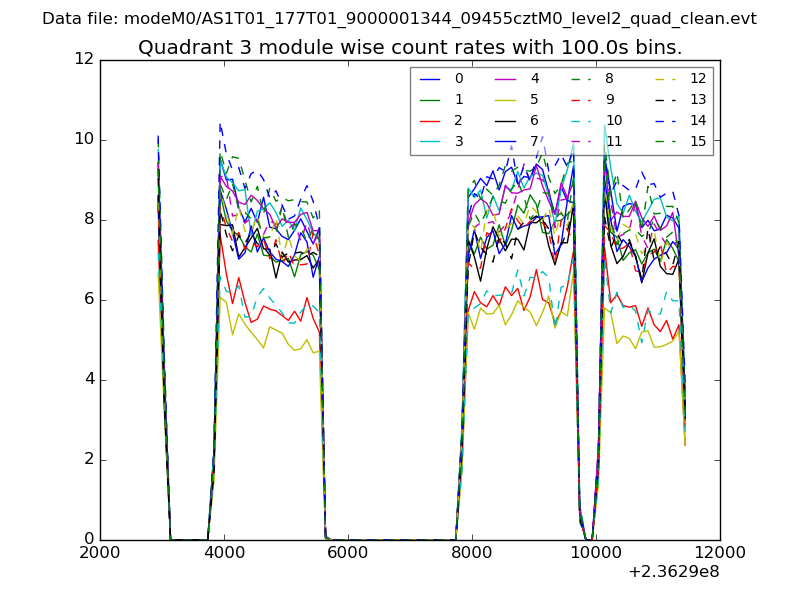
| Module-wise count rates for Quadrant C Data is divided into 100 sec bins |
 |
 |
| Module-wise count rates for Quadrant D Data is divided into 100 sec bins |
 |
 |
| Parameter | Plot |
|---|---|
| CZT HV Monitor | 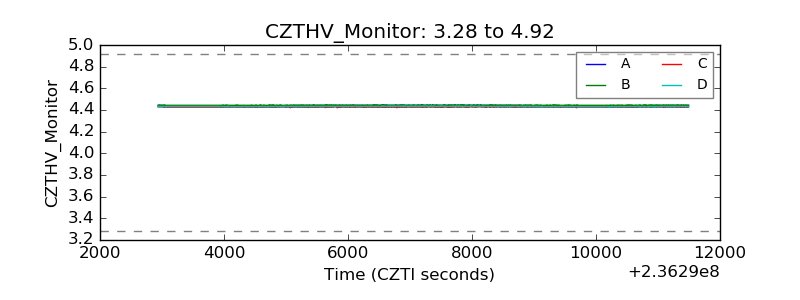 |
| D_VDD |  |
| Temperature 1 | 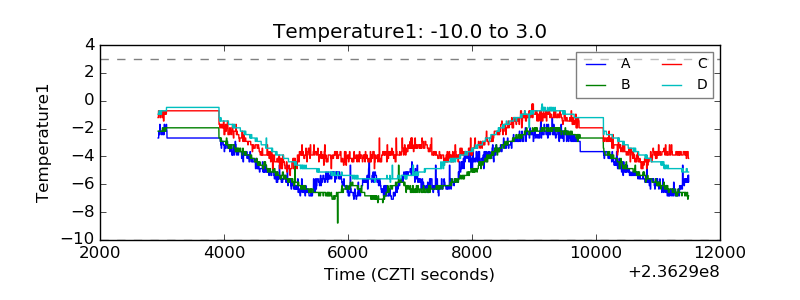 |
| Veto HV Monitor | 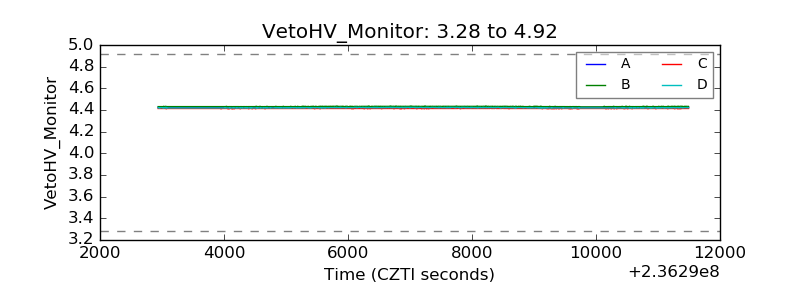 |
| Veto LLD | 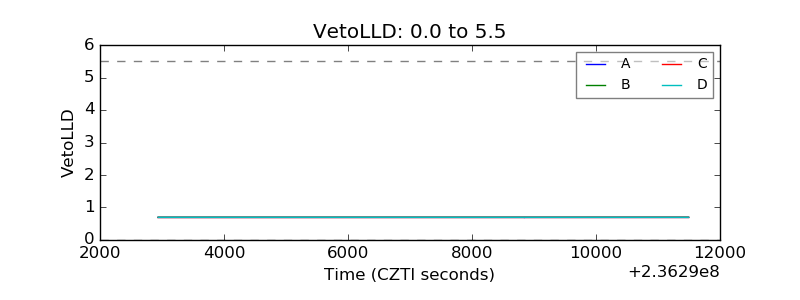 |
| Alpha Counter | 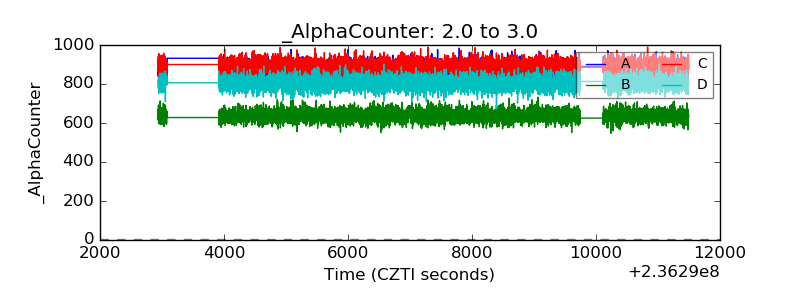 |
| _CPM_Rate |  |
| CZT Counter |  |
| +2.5 Volts monitor |  |
| +5 Volts monitor |  |
| _ROLL_ROT | 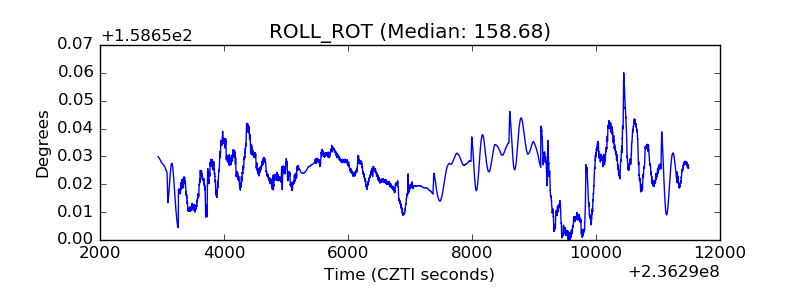 |
| _Roll_DEC | 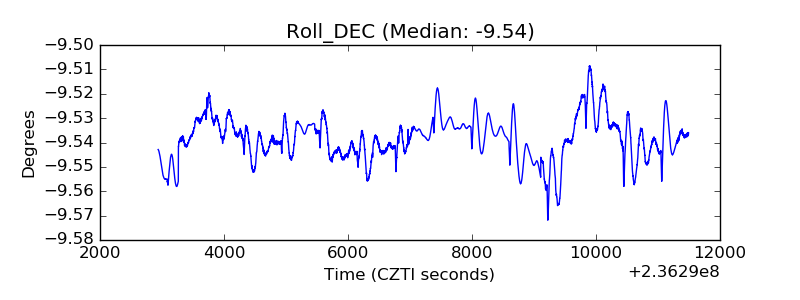 |
| _Roll_RA |  |
| Veto Counter | 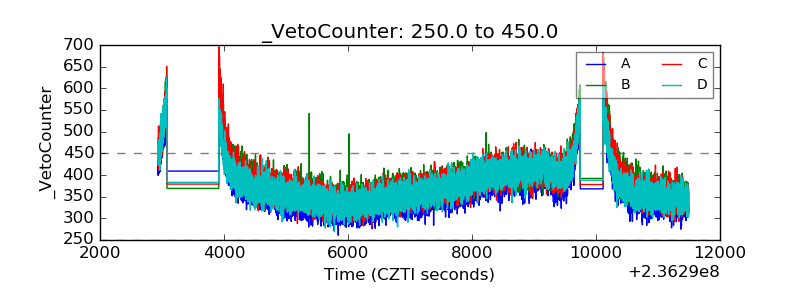 |