| Param | Original file | Final file |
|---|---|---|
| Filename | modeM0/AS1T01_177T01_9000001344_09456cztM0_level2.evt | modeM0/AS1T01_177T01_9000001344_09456cztM0_level2_quad_clean.evt |
| Size (bytes) | 579,409,920 | 115,669,440 |
| Size | 552.6 MB | 110.3 MB |
| Events in quadrant A | 4,229,906 | 738,502 |
| Events in quadrant B | 4,303,550 | 733,471 |
| Events in quadrant C | 3,961,637 | 721,076 |
| Events in quadrant D | 4,466,119 | 709,984 |
| Mode M9 | |||
|---|---|---|---|
| Quadrant | BADHDUFLAG | Total packets | Discarded packets |
| A | 0 | 7 | 0 |
| B | 0 | 7 | 0 |
| C | 0 | 7 | 0 |
| D | 0 | 7 | 0 |
| Mode M0 | |||
|---|---|---|---|
| Quadrant | BADHDUFLAG | Total packets | Discarded packets |
| A | 0 | 18183 | 5 |
| B | 0 | 18608 | 4 |
| C | 0 | 17869 | 4 |
| D | 0 | 19188 | 2 |
| Mode SS | |||
|---|---|---|---|
| Quadrant | BADHDUFLAG | Total packets | Discarded packets |
| A | 0 | 176 | 0 |
| B | 0 | 176 | 0 |
| C | 0 | 176 | 0 |
| D | 0 | 176 | 0 |
| Quadrant | Total seconds | Saturated seconds | Saturation percentage |
|---|---|---|---|
| A | 8644 | 73 | 0.844516% |
| B | 8644 | 84 | 0.971772% |
| C | 8644 | 31 | 0.358630% |
| D | 8645 | 66 | 0.763447% |
Noise dominated data is calculated using 1-second bins in cleaned event files. If a bin has >2000 counts, and if more than 50% of those come from <1% of pixels, then it is considered to be noise-dominated and hence unusable.
| Quadrant | # 1 sec bins | Bins with >0 counts | Bins with >2000 counts | High rate bins dominated by noise | Noise dominated (total time) | Noise dominated (detector-on time) | Marked lightcurve |
|---|---|---|---|---|---|---|---|
| A | 9260 | 8647 | 1 | 1 | 0.01% | 0.01% | 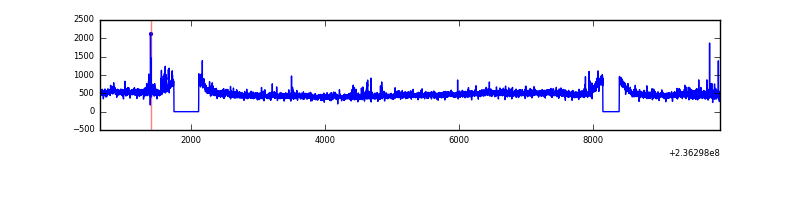 |
| B | 9260 | 8647 | 13 | 13 | 0.14% | 0.15% | 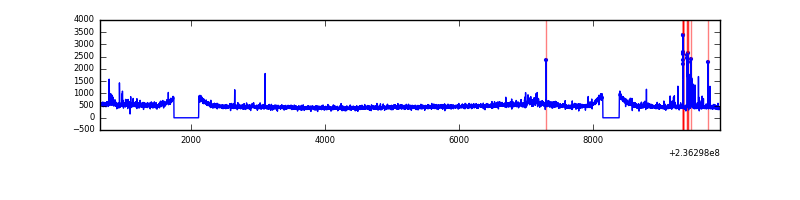 |
| C | 9260 | 8647 | 12 | 12 | 0.13% | 0.14% | 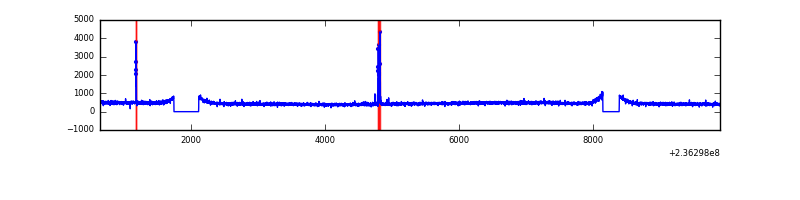 |
| D | 9260 | 8647 | 34 | 34 | 0.37% | 0.39% | 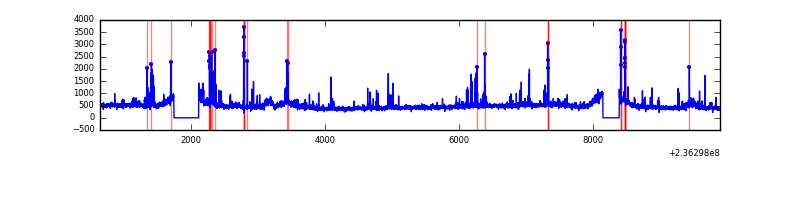 |
Top three noisy pixels from each quadrant. If the there are fewer than three noisy pixels in the level2.evt file, extra rows are filled as -1
| Pixel properties | Quadrant properties | ||||||
|---|---|---|---|---|---|---|---|
| Quadrant | DetID | PixID | Counts | Sigma | Mean | Median | Sigma |
| A | 1 | 162 | 83471 | 386.19 | 1037 | 1013 | 213.5 |
| A | 8 | 5 | 56944 | 261.95 | 1037 | 1013 | 213.5 |
| A | 1 | 178 | 32076 | 145.48 | 1037 | 1013 | 213.5 |
| B | 5 | 255 | 132721 | 655.31 | 1032 | 1005 | 201.0 |
| B | 0 | 214 | 55079 | 269.03 | 1032 | 1005 | 201.0 |
| B | 0 | 187 | 54015 | 263.73 | 1032 | 1005 | 201.0 |
| C | 14 | 234 | 47771 | 200.14 | 994 | 999 | 233.7 |
| C | 9 | 68 | 24892 | 102.24 | 994 | 999 | 233.7 |
| C | 4 | 254 | 13716 | 54.42 | 994 | 999 | 233.7 |
| D | 8 | 195 | 246755 | 968.29 | 994 | 970 | 253.8 |
| D | 7 | 71 | 148880 | 582.71 | 994 | 970 | 253.8 |
| D | 1 | 52 | 96014 | 374.43 | 994 | 970 | 253.8 |
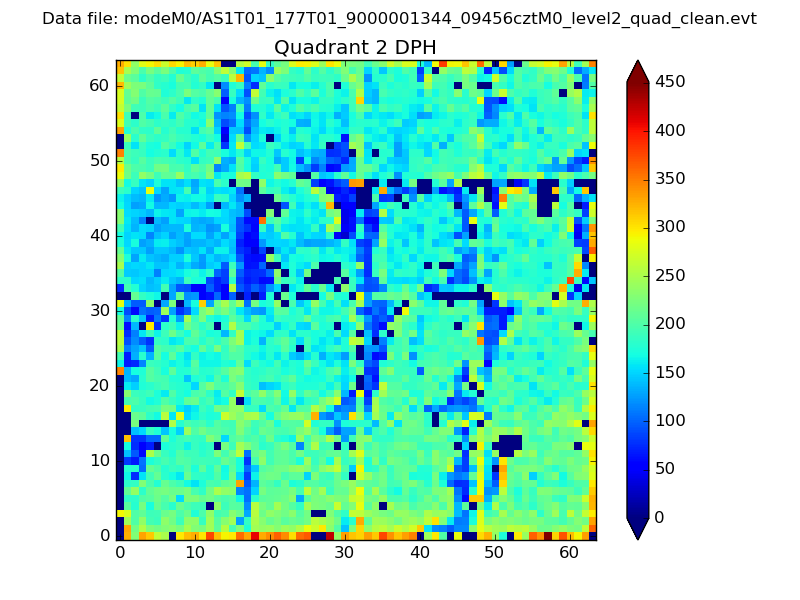
Histogram calculated using DETX and DETY for each event in the final _common_clean file
| Quadrant A | 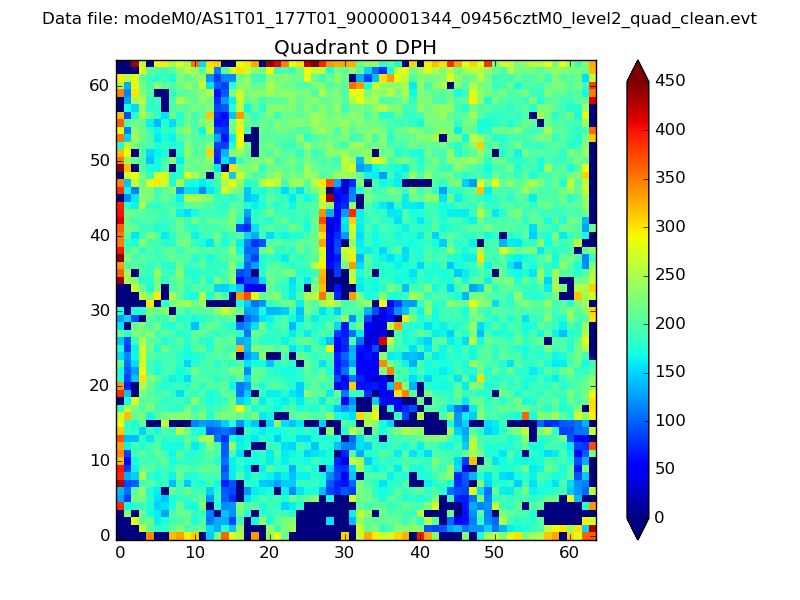 |
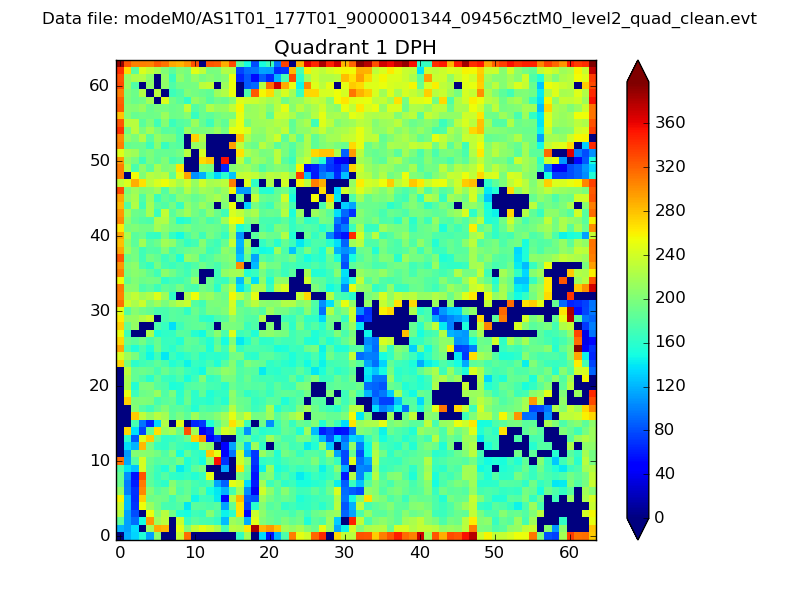 |
Quadrant B |
|---|---|---|---|
| Quadrant D | 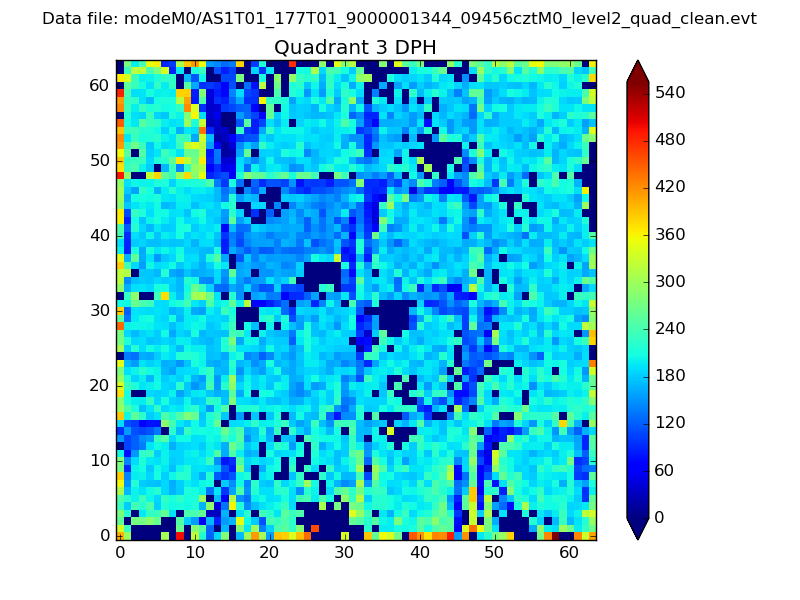 |
 |
Quadrant C |
| Plot type | Count rate plots | Images |
|---|---|---|
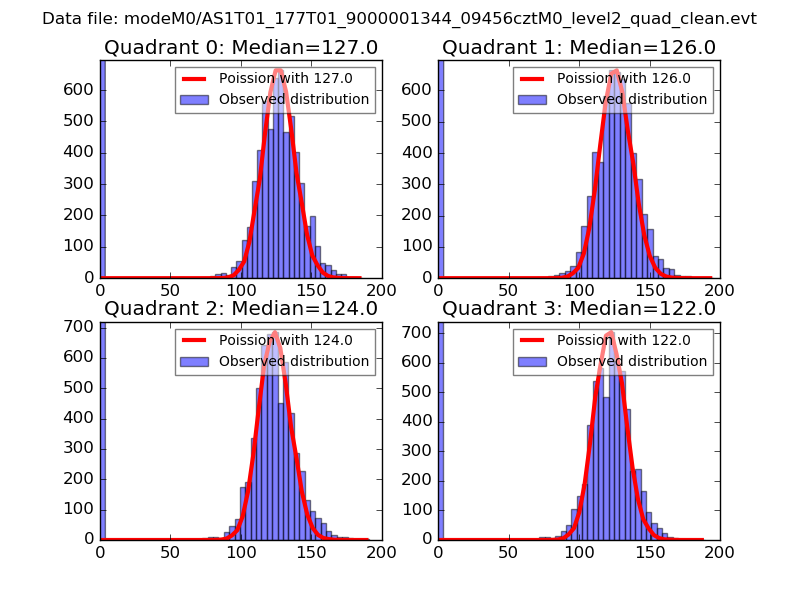
| Comparison with Poisson distribution Blue bars denote a histogram of data divided into 1 sec bins. Red curve is a Poisson curve with rate = median count rate of data. |
 |
 |
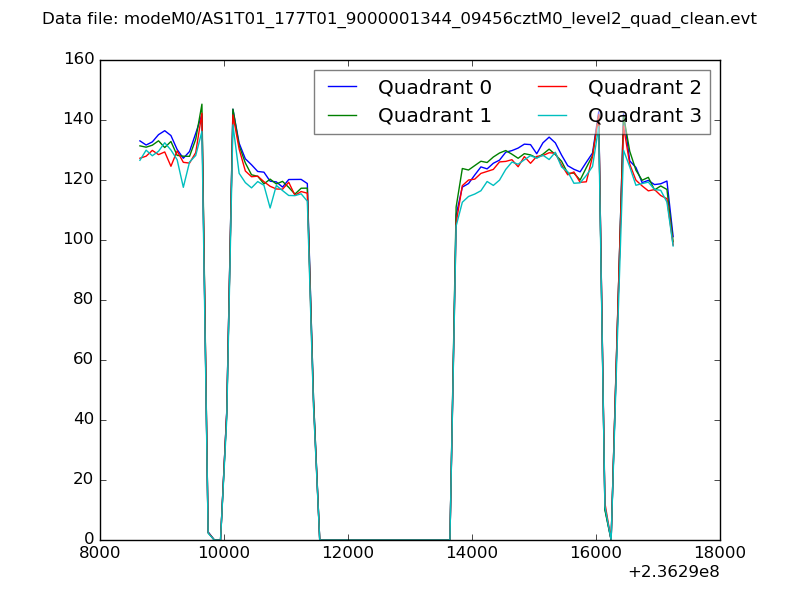
| Quadrant-wise count rates Data is divided into 100 sec bins |
 |
|
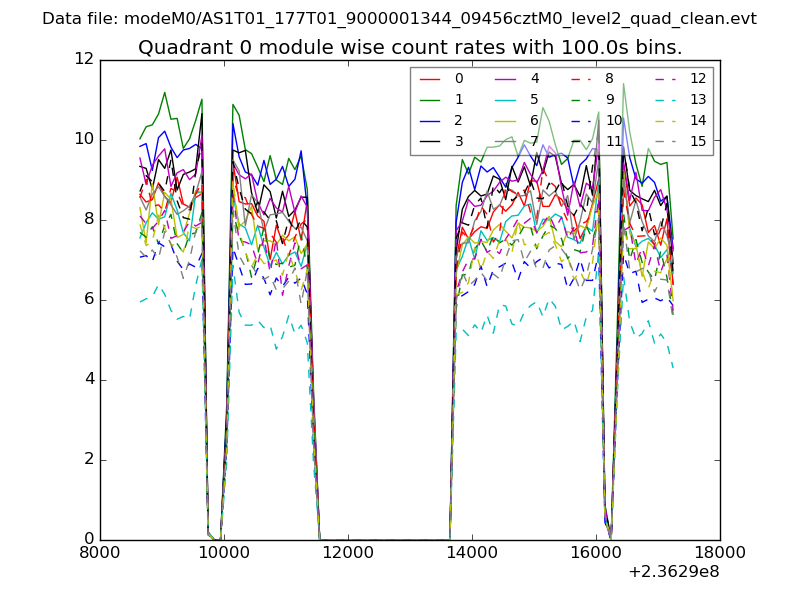
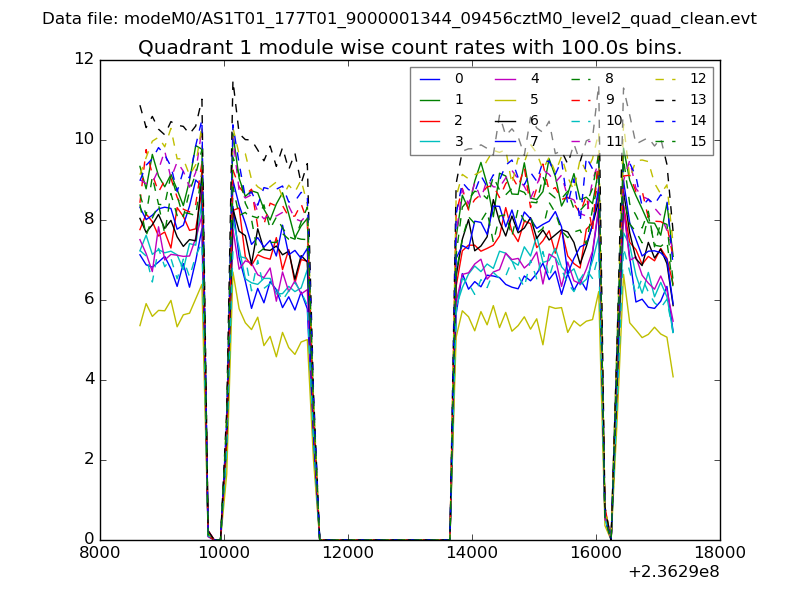
| Module-wise count rates for Quadrant A Data is divided into 100 sec bins |
 |
 |
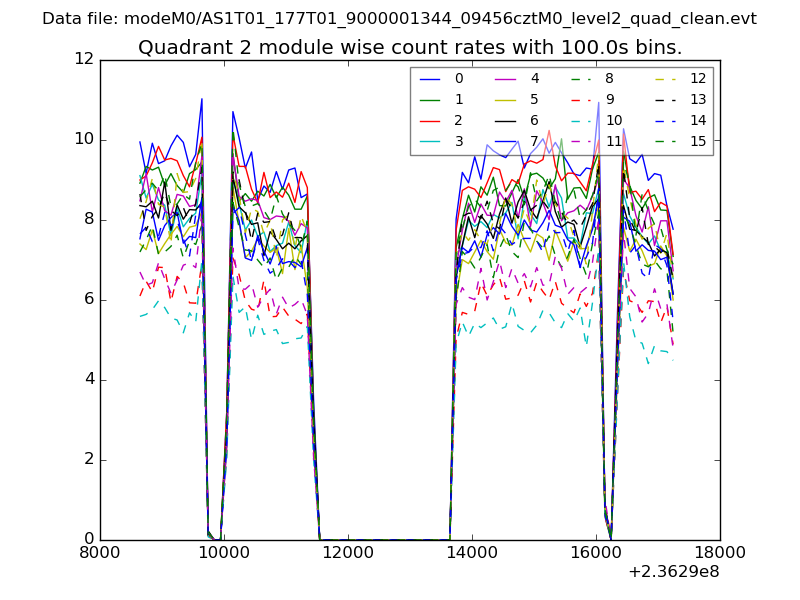
| Module-wise count rates for Quadrant B Data is divided into 100 sec bins |
 |
 |
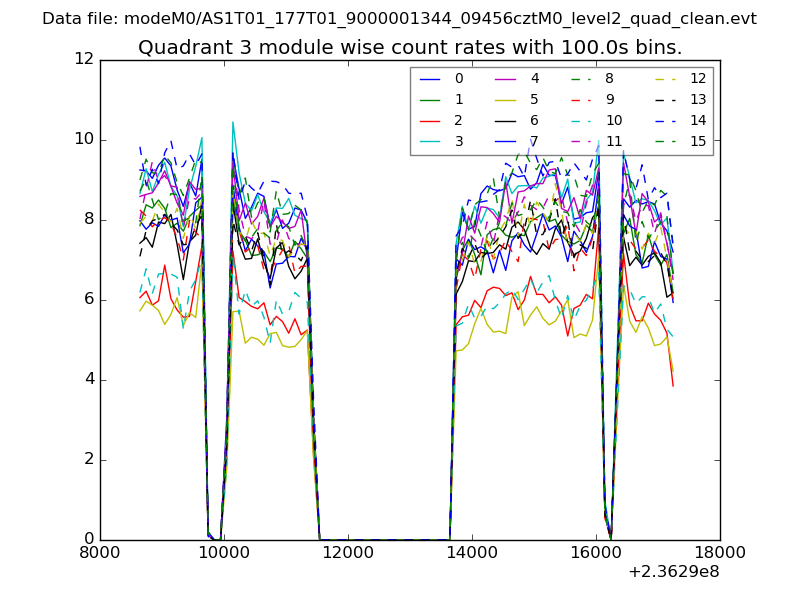
| Module-wise count rates for Quadrant C Data is divided into 100 sec bins |
 |
 |
| Module-wise count rates for Quadrant D Data is divided into 100 sec bins |
 |
 |
| Parameter | Plot |
|---|---|
| CZT HV Monitor | 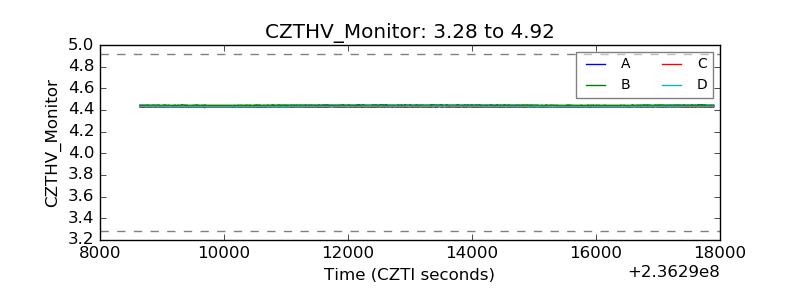 |
| D_VDD | 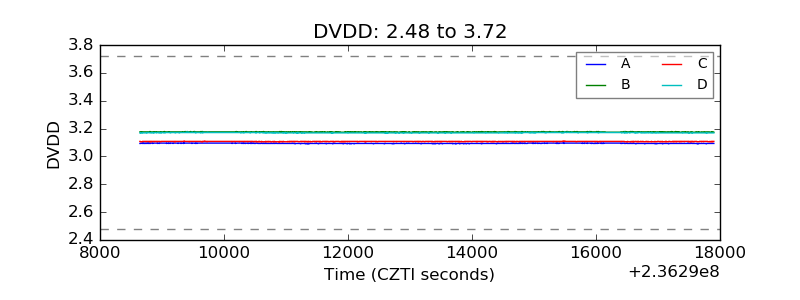 |
| Temperature 1 | 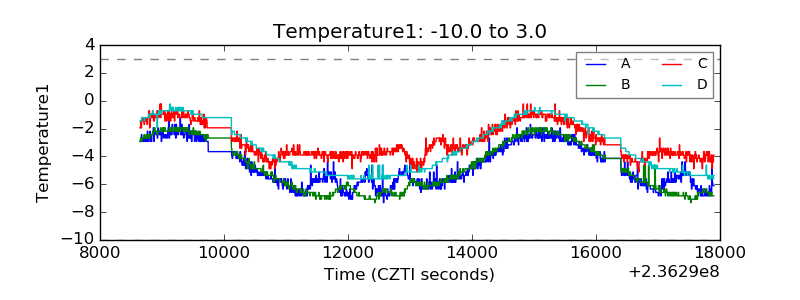 |
| Veto HV Monitor | 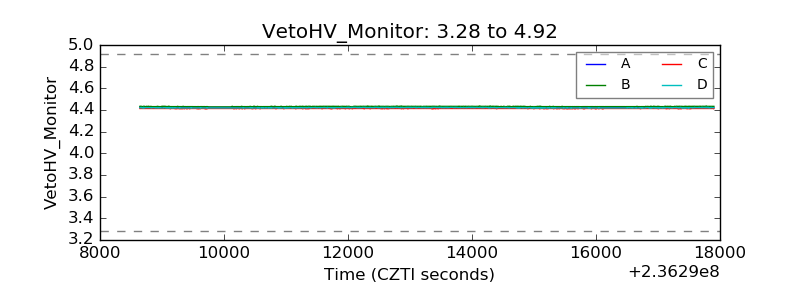 |
| Veto LLD | 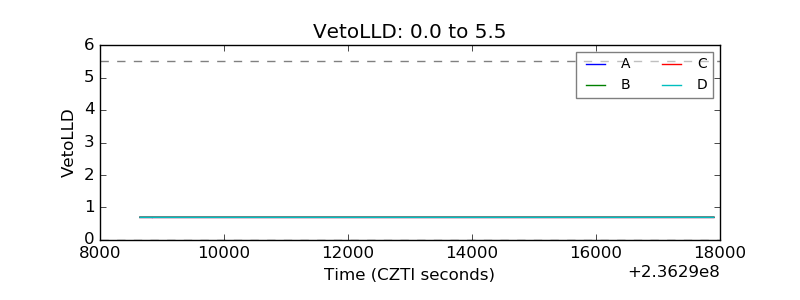 |
| Alpha Counter | 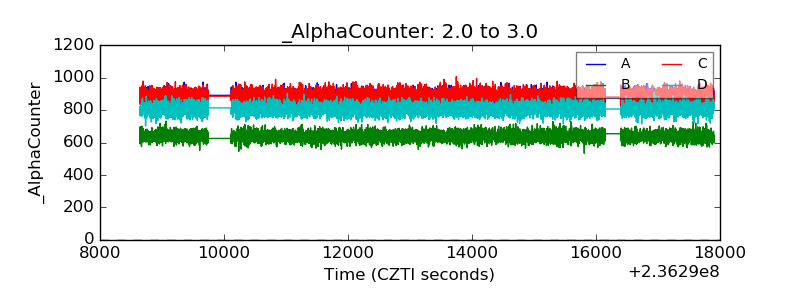 |
| _CPM_Rate | 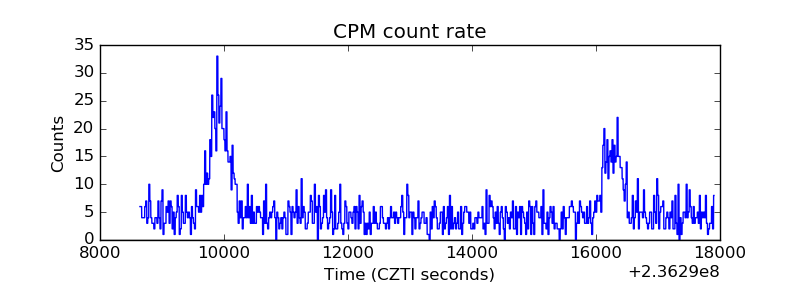 |
| CZT Counter | 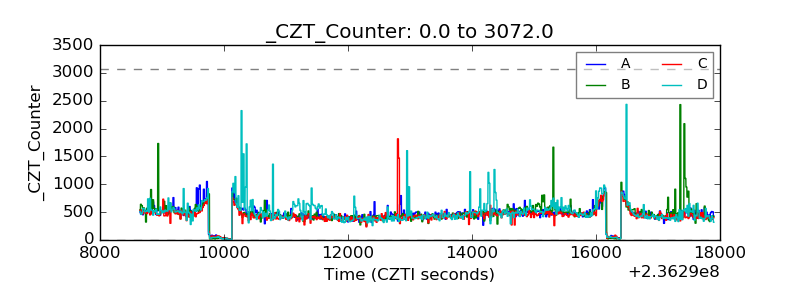 |
| +2.5 Volts monitor | 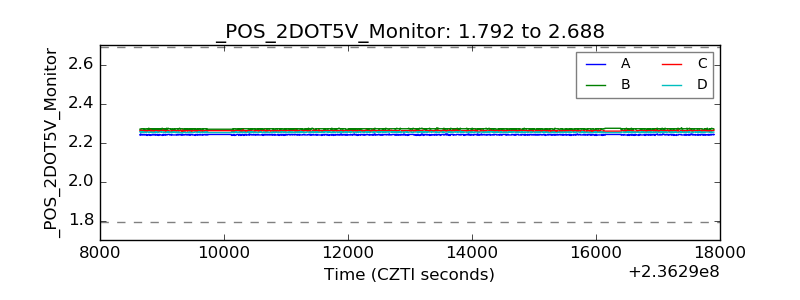 |
| +5 Volts monitor |  |
| _ROLL_ROT | 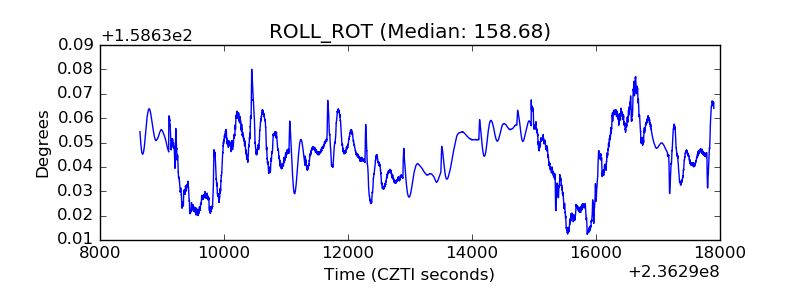 |
| _Roll_DEC | 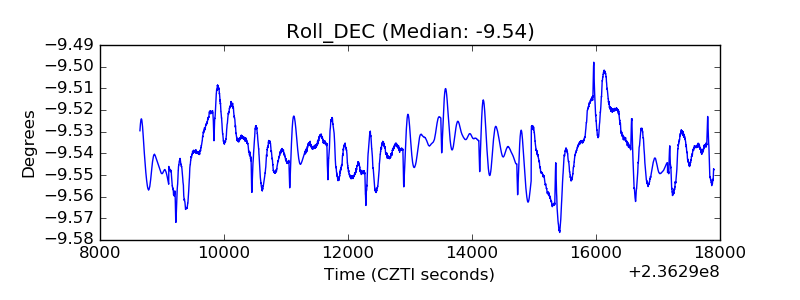 |
| _Roll_RA | 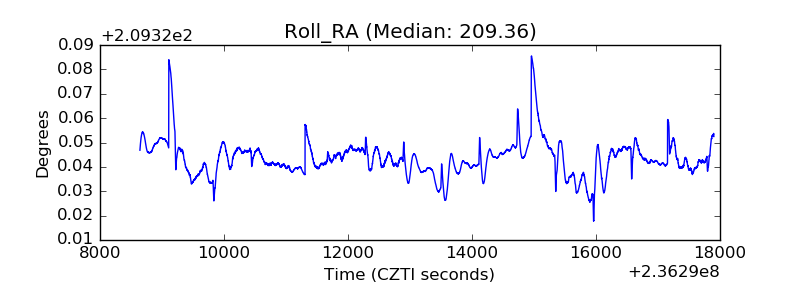 |
| Veto Counter | 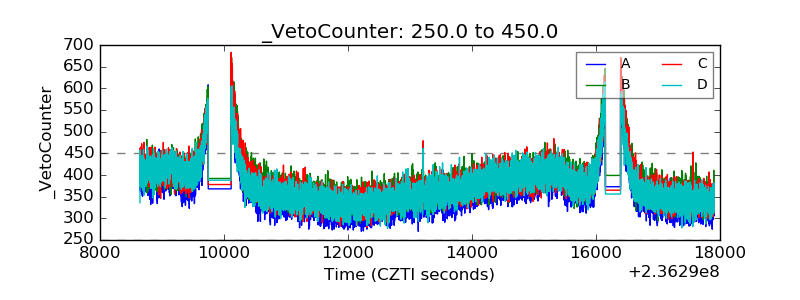 |