| Param | Original file | Final file |
|---|---|---|
| Filename | modeM0/AS1T01_177T01_9000001344_09457cztM0_level2.evt | modeM0/AS1T01_177T01_9000001344_09457cztM0_level2_quad_clean.evt |
| Size (bytes) | 573,186,240 | 106,300,800 |
| Size | 546.6 MB | 101.4 MB |
| Events in quadrant A | 4,237,783 | 663,888 |
| Events in quadrant B | 4,407,660 | 659,403 |
| Events in quadrant C | 3,935,037 | 649,535 |
| Events in quadrant D | 4,187,675 | 641,947 |
| Mode M9 | |||
|---|---|---|---|
| Quadrant | BADHDUFLAG | Total packets | Discarded packets |
| A | 0 | 7 | 0 |
| B | 0 | 7 | 0 |
| C | 0 | 7 | 0 |
| D | 0 | 7 | 0 |
| Mode M0 | |||
|---|---|---|---|
| Quadrant | BADHDUFLAG | Total packets | Discarded packets |
| A | 0 | 18234 | 3 |
| B | 0 | 18935 | 2 |
| C | 0 | 17883 | 2 |
| D | 0 | 18632 | 2 |
| Mode SS | |||
|---|---|---|---|
| Quadrant | BADHDUFLAG | Total packets | Discarded packets |
| A | 0 | 178 | 0 |
| B | 0 | 178 | 0 |
| C | 0 | 178 | 0 |
| D | 0 | 178 | 0 |
| Quadrant | Total seconds | Saturated seconds | Saturation percentage |
|---|---|---|---|
| A | 8707 | 68 | 0.780981% |
| B | 8707 | 99 | 1.137016% |
| C | 8707 | 28 | 0.321580% |
| D | 8707 | 52 | 0.597221% |
Noise dominated data is calculated using 1-second bins in cleaned event files. If a bin has >2000 counts, and if more than 50% of those come from <1% of pixels, then it is considered to be noise-dominated and hence unusable.
| Quadrant | # 1 sec bins | Bins with >0 counts | Bins with >2000 counts | High rate bins dominated by noise | Noise dominated (total time) | Noise dominated (detector-on time) | Marked lightcurve |
|---|---|---|---|---|---|---|---|
| A | 9367 | 8709 | 1 | 1 | 0.01% | 0.01% | 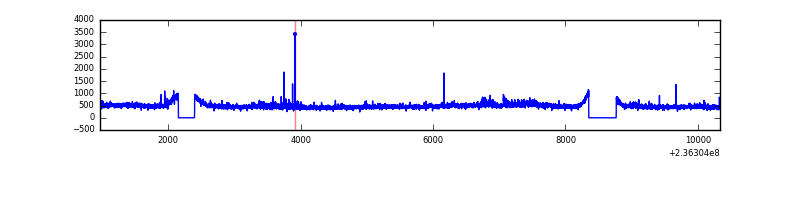 |
| B | 9367 | 8709 | 17 | 17 | 0.18% | 0.20% | 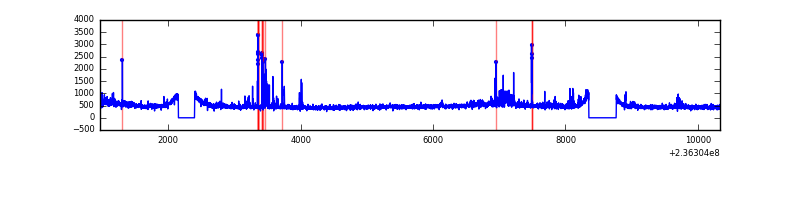 |
| C | 9367 | 8709 | 3 | 3 | 0.03% | 0.03% | 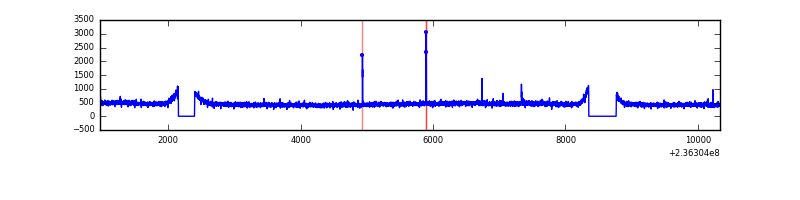 |
| D | 9367 | 8709 | 27 | 27 | 0.29% | 0.31% | 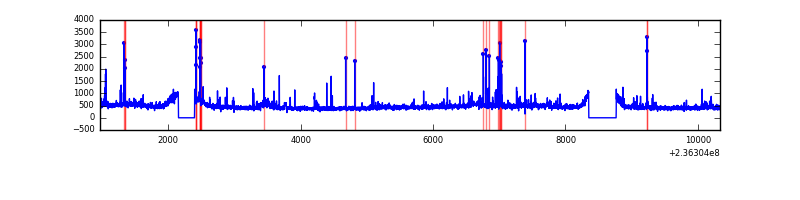 |
Top three noisy pixels from each quadrant. If the there are fewer than three noisy pixels in the level2.evt file, extra rows are filled as -1
| Pixel properties | Quadrant properties | ||||||
|---|---|---|---|---|---|---|---|
| Quadrant | DetID | PixID | Counts | Sigma | Mean | Median | Sigma |
| A | 1 | 162 | 91693 | 428.27 | 1030 | 1006 | 211.8 |
| A | 8 | 5 | 89478 | 417.81 | 1030 | 1006 | 211.8 |
| A | 1 | 178 | 34072 | 156.15 | 1030 | 1006 | 211.8 |
| B | 5 | 255 | 229752 | 1138.86 | 1030 | 1006 | 200.9 |
| B | 0 | 187 | 76415 | 375.44 | 1030 | 1006 | 200.9 |
| B | 0 | 214 | 39531 | 191.8 | 1030 | 1006 | 200.9 |
| C | 9 | 68 | 38724 | 161.19 | 993 | 997 | 234.0 |
| C | 14 | 234 | 24730 | 101.4 | 993 | 997 | 234.0 |
| C | 13 | 61 | 7611 | 28.26 | 993 | 997 | 234.0 |
| D | 1 | 52 | 123152 | 486.01 | 989 | 963 | 251.4 |
| D | 8 | 195 | 103588 | 408.2 | 989 | 963 | 251.4 |
| D | 7 | 71 | 65059 | 254.95 | 989 | 963 | 251.4 |
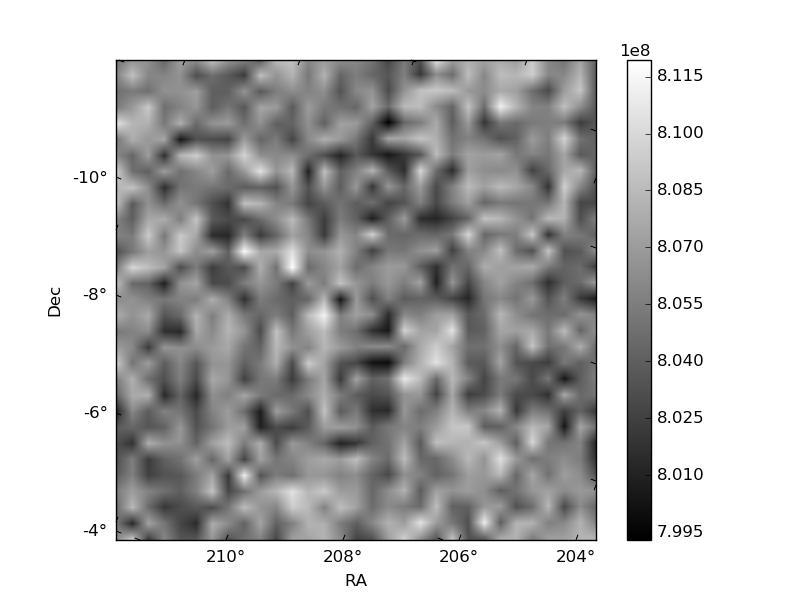
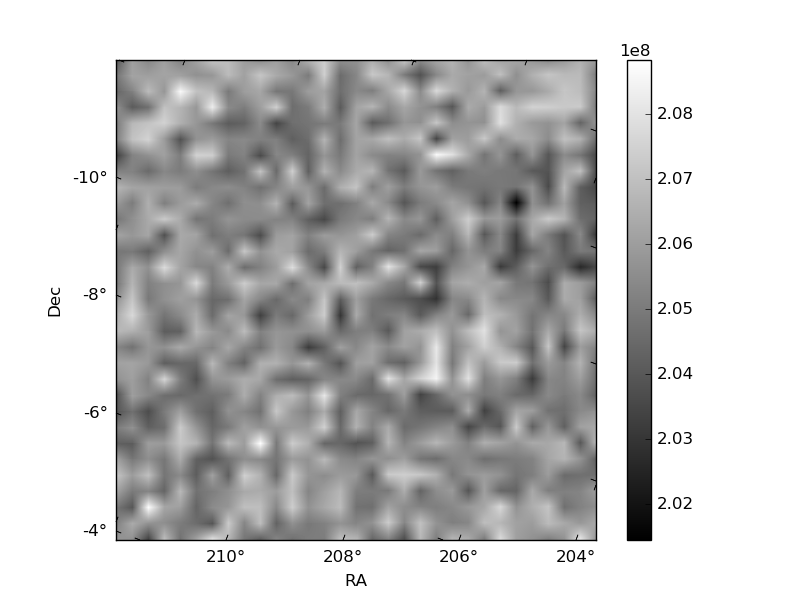
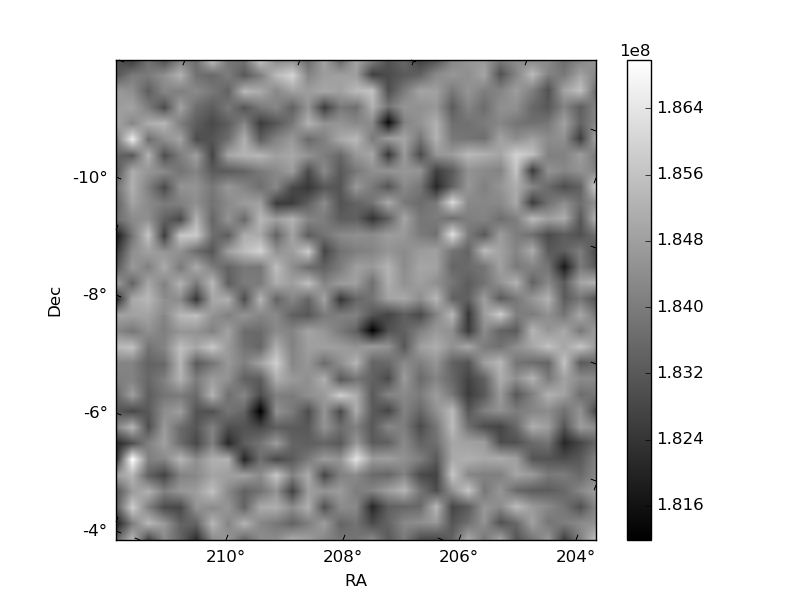
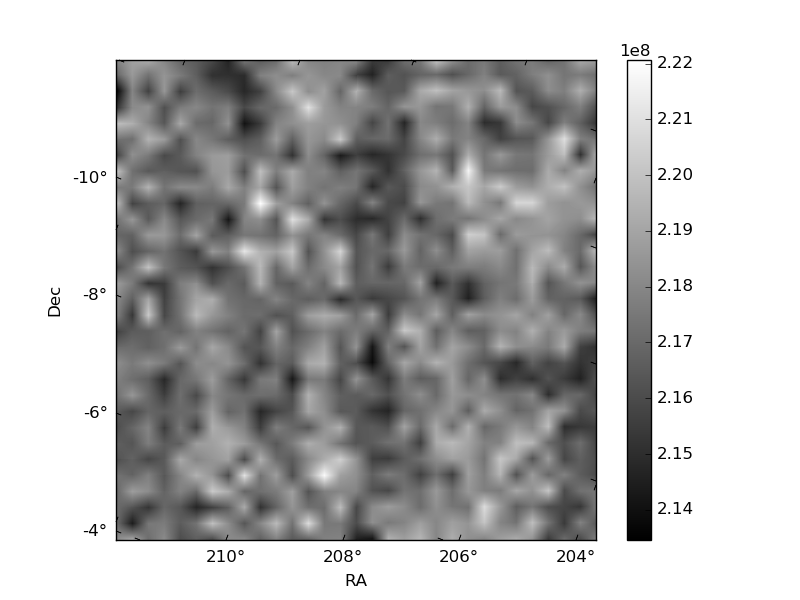
Histogram calculated using DETX and DETY for each event in the final _common_clean file
| Quadrant A | 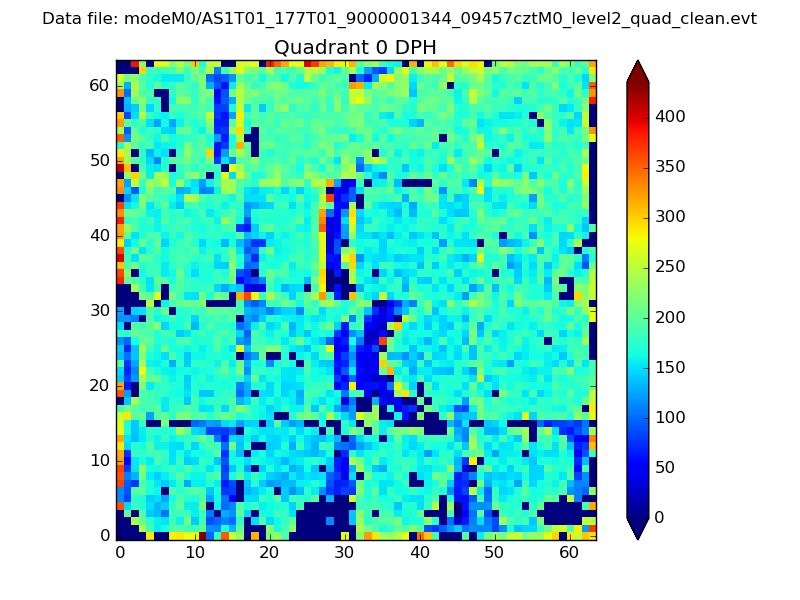 |
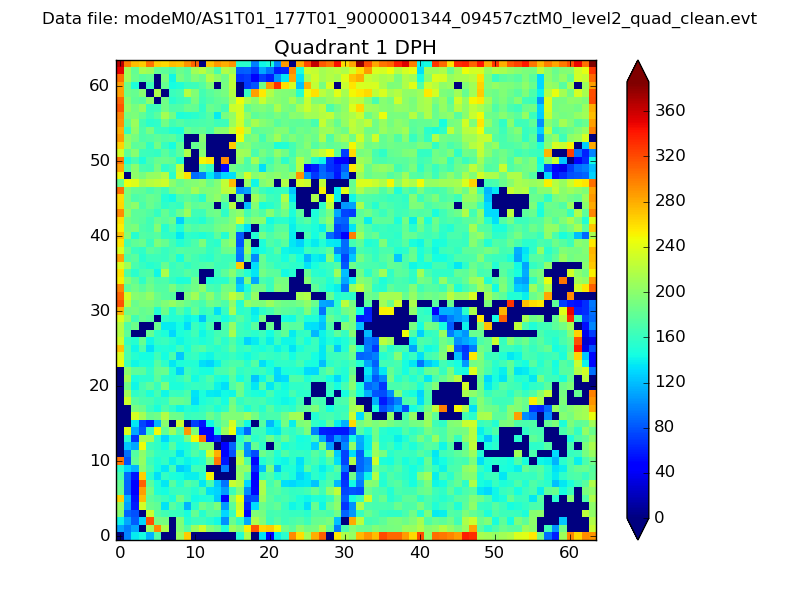 |
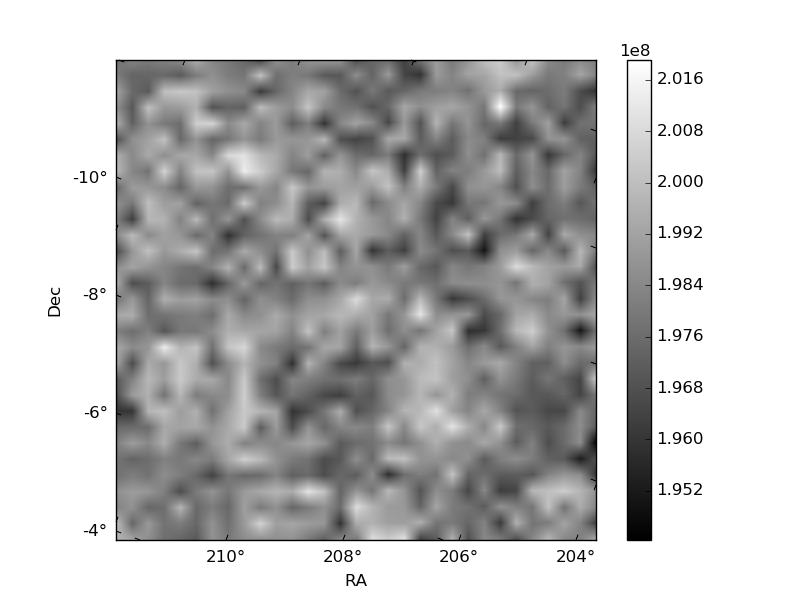
Quadrant B |
|---|---|---|---|
| Quadrant D | 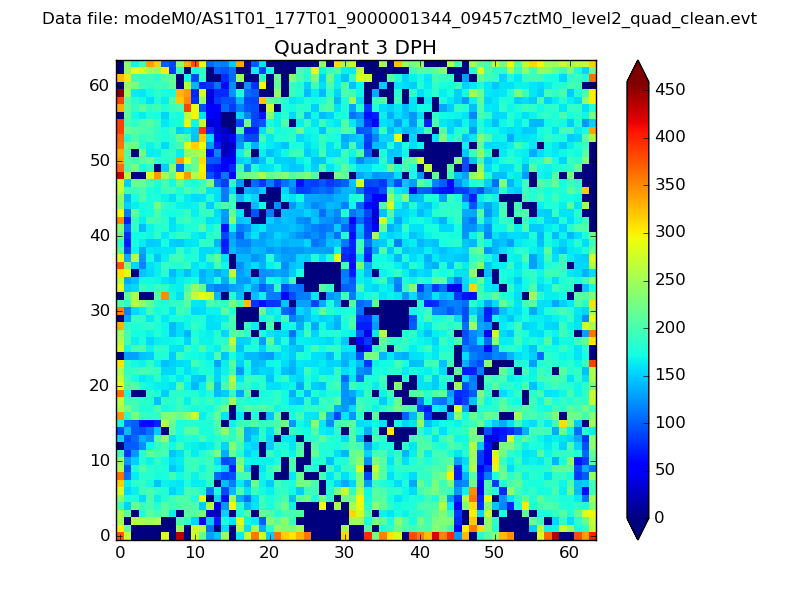 |
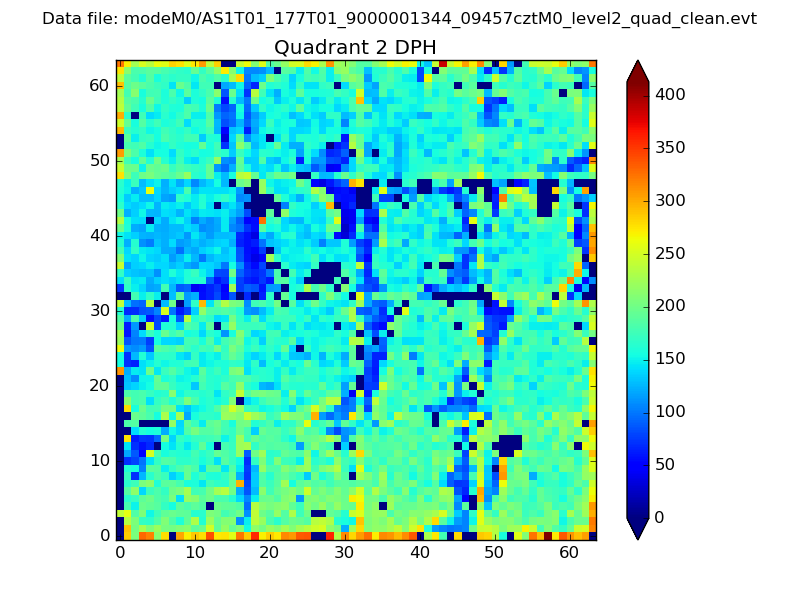 |
Quadrant C |
| Plot type | Count rate plots | Images |
|---|---|---|
| Comparison with Poisson distribution Blue bars denote a histogram of data divided into 1 sec bins. Red curve is a Poisson curve with rate = median count rate of data. |
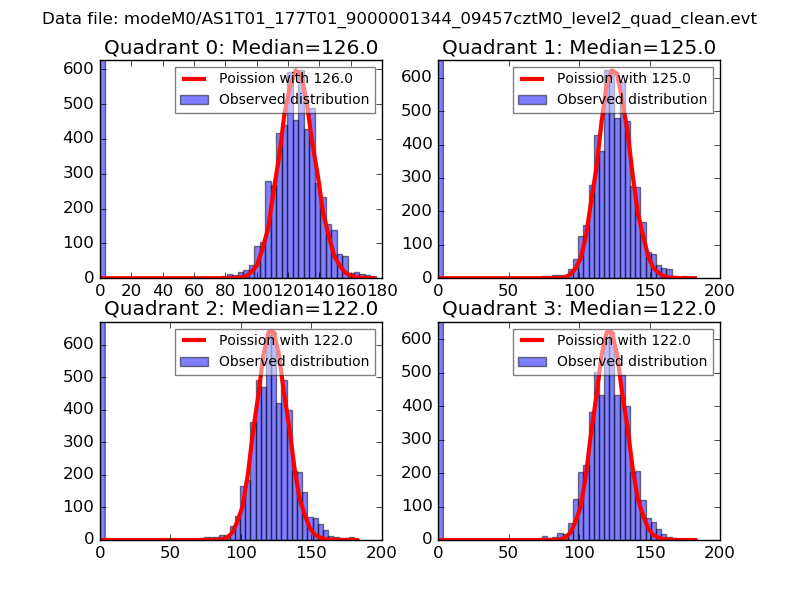 |
 |
| Quadrant-wise count rates Data is divided into 100 sec bins |
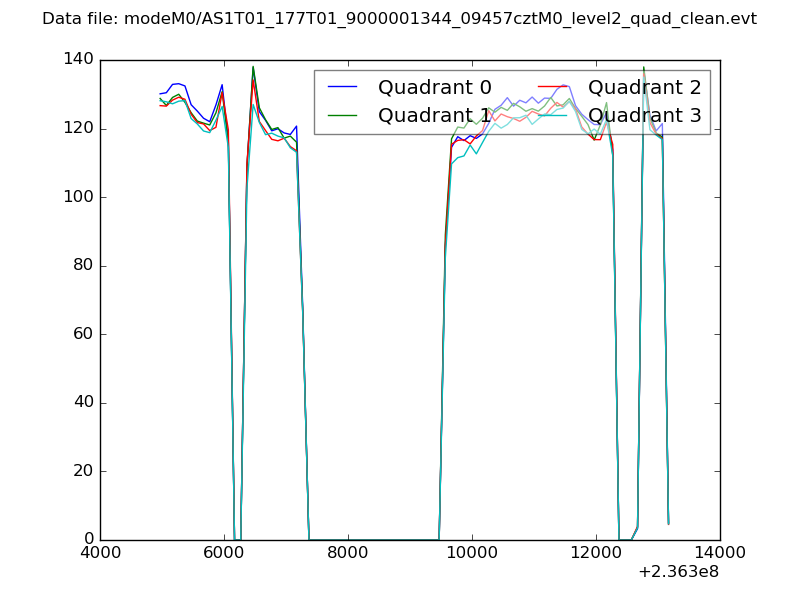 |
|
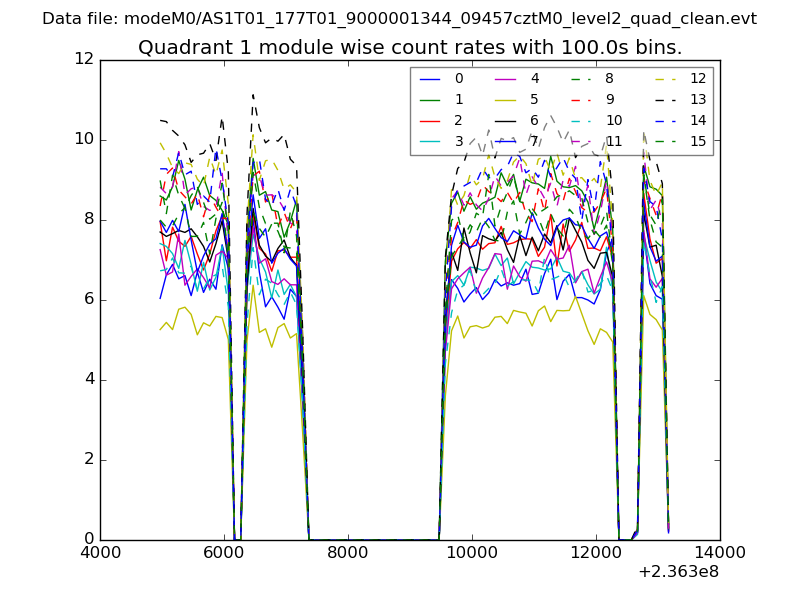
| Module-wise count rates for Quadrant A Data is divided into 100 sec bins |
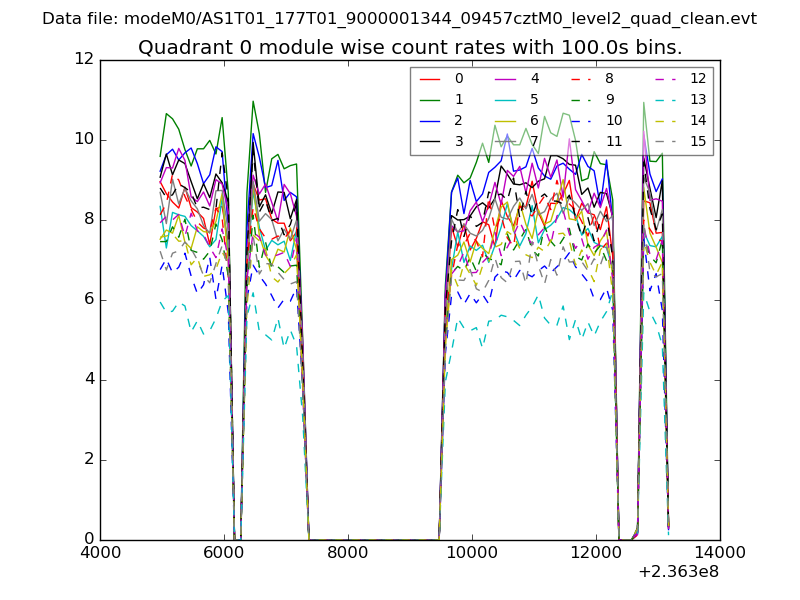 |
 |
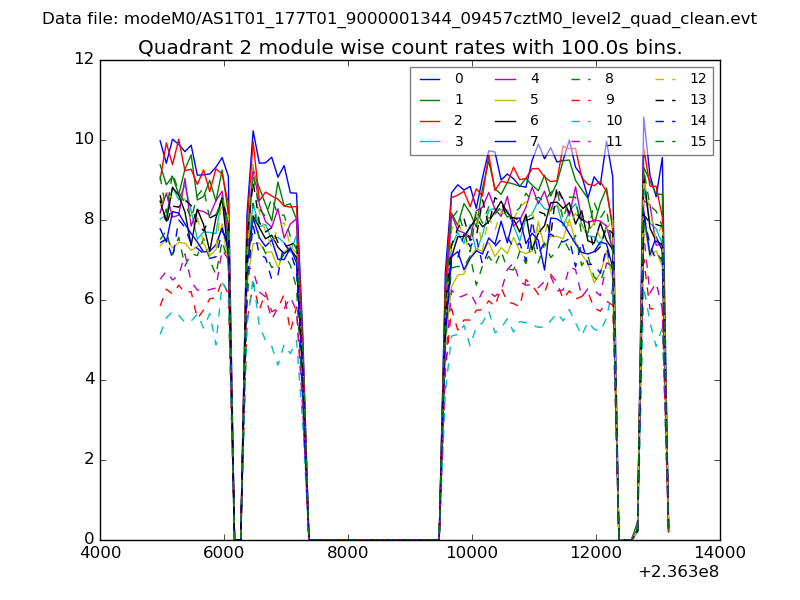
| Module-wise count rates for Quadrant B Data is divided into 100 sec bins |
 |
 |
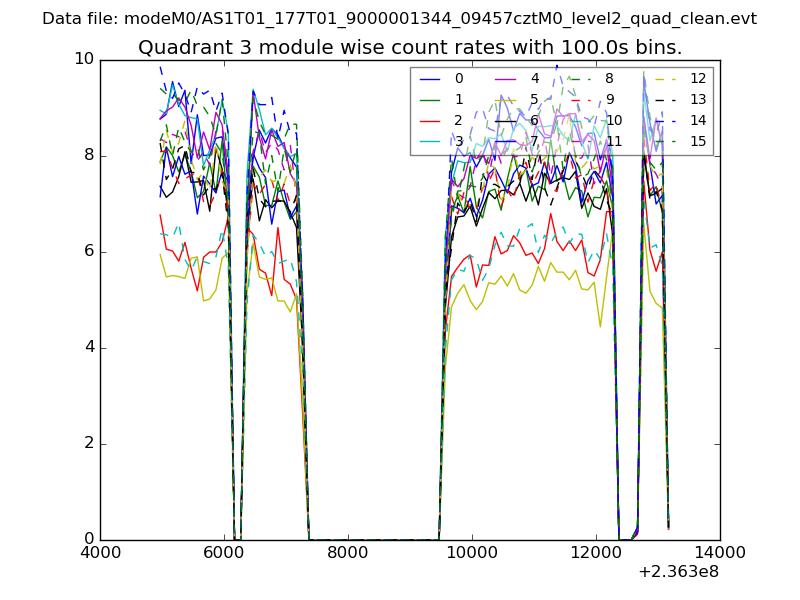
| Module-wise count rates for Quadrant C Data is divided into 100 sec bins |
 |
 |
| Module-wise count rates for Quadrant D Data is divided into 100 sec bins |
 |
 |
| Parameter | Plot |
|---|---|
| CZT HV Monitor | 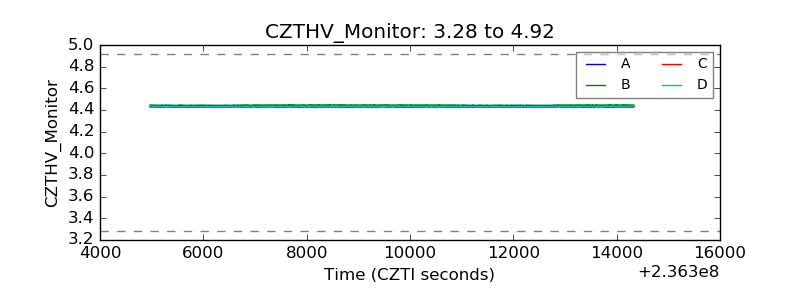 |
| D_VDD | 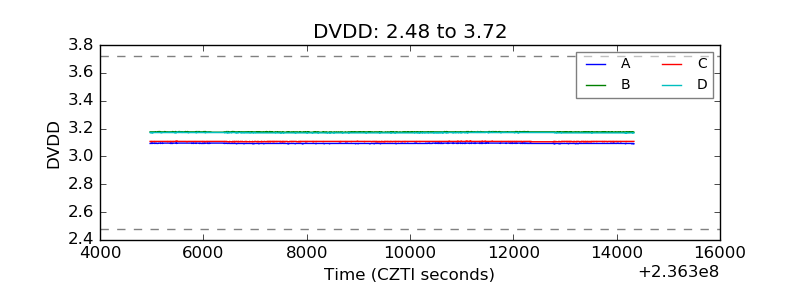 |
| Temperature 1 | 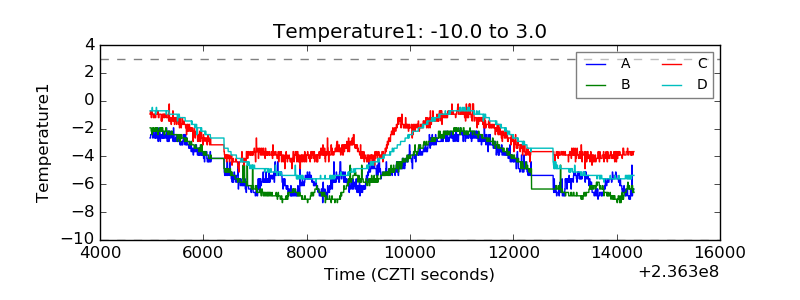 |
| Veto HV Monitor | 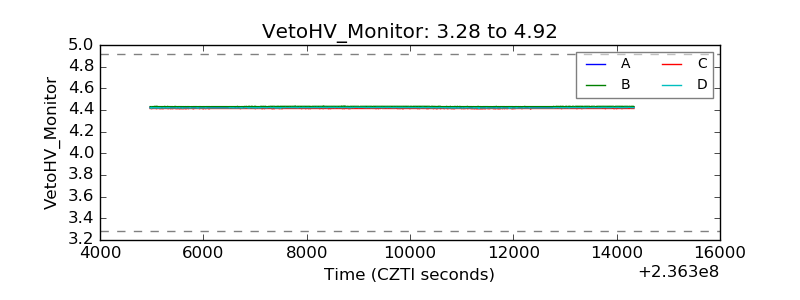 |
| Veto LLD | 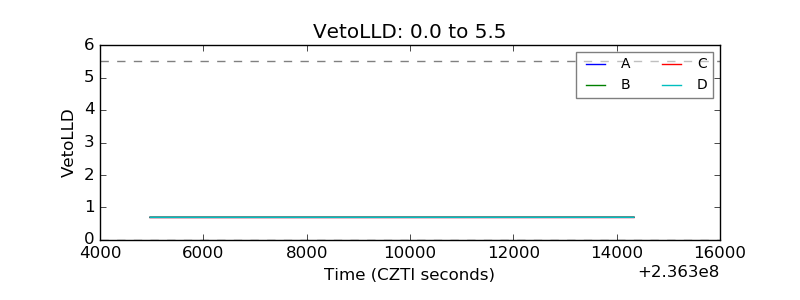 |
| Alpha Counter | 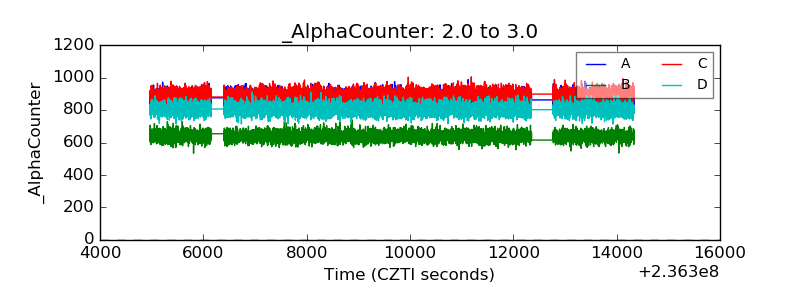 |
| _CPM_Rate | 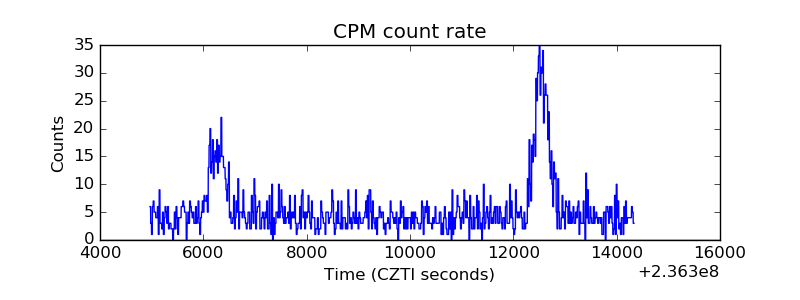 |
| CZT Counter | 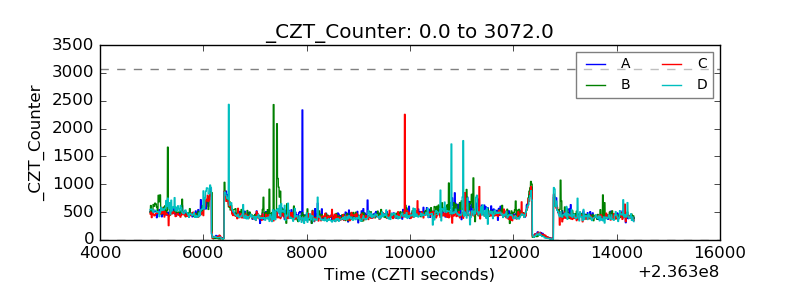 |
| +2.5 Volts monitor |  |
| +5 Volts monitor |  |
| _ROLL_ROT | 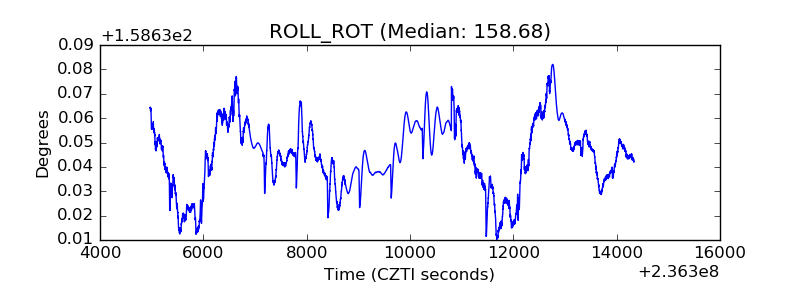 |
| _Roll_DEC | 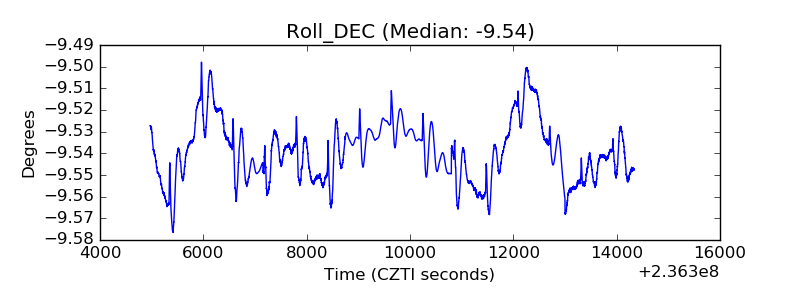 |
| _Roll_RA | 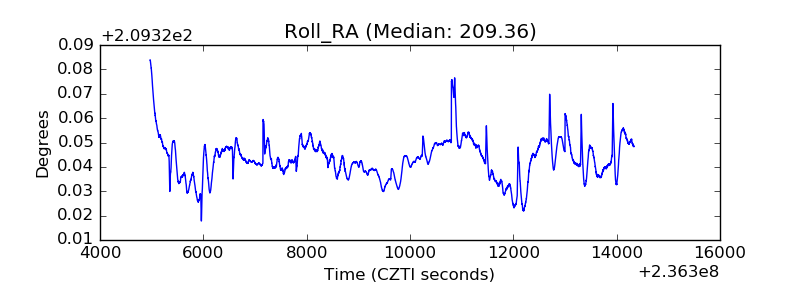 |
| Veto Counter | 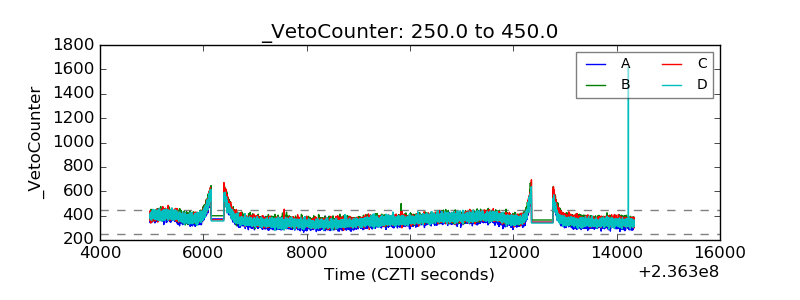 |