| Param | Original file | Final file |
|---|---|---|
| Filename | modeM0/AS1T01_177T01_9000001344_09459cztM0_level2.evt | modeM0/AS1T01_177T01_9000001344_09459cztM0_level2_quad_clean.evt |
| Size (bytes) | 856,189,440 | 144,506,880 |
| Size | 816.5 MB | 137.8 MB |
| Events in quadrant A | 6,647,528 | 883,013 |
| Events in quadrant B | 6,152,602 | 880,499 |
| Events in quadrant C | 5,768,276 | 862,597 |
| Events in quadrant D | 6,480,220 | 851,458 |
| Mode M9 | |||
|---|---|---|---|
| Quadrant | BADHDUFLAG | Total packets | Discarded packets |
| A | 0 | 16 | 1 |
| B | 0 | 16 | 0 |
| C | 0 | 16 | 0 |
| D | 0 | 16 | 0 |
| Mode M0 | |||
|---|---|---|---|
| Quadrant | BADHDUFLAG | Total packets | Discarded packets |
| A | 0 | 28489 | 274 |
| B | 0 | 27215 | 294 |
| C | 0 | 26809 | 270 |
| D | 0 | 28784 | 243 |
| Mode SS | |||
|---|---|---|---|
| Quadrant | BADHDUFLAG | Total packets | Discarded packets |
| A | 0 | 270 | 6 |
| B | 0 | 270 | 2 |
| C | 0 | 270 | 0 |
| D | 0 | 269 | 1 |
| Quadrant | Total seconds | Saturated seconds | Saturation percentage |
|---|---|---|---|
| A | 13003 | 199 | 1.530416% |
| B | 12985 | 162 | 1.247593% |
| C | 12994 | 101 | 0.777282% |
| D | 13012 | 184 | 1.414079% |
Noise dominated data is calculated using 1-second bins in cleaned event files. If a bin has >2000 counts, and if more than 50% of those come from <1% of pixels, then it is considered to be noise-dominated and hence unusable.
| Quadrant | # 1 sec bins | Bins with >0 counts | Bins with >2000 counts | High rate bins dominated by noise | Noise dominated (total time) | Noise dominated (detector-on time) | Marked lightcurve |
|---|---|---|---|---|---|---|---|
| A | 14775 | 13078 | 33 | 33 | 0.22% | 0.25% | 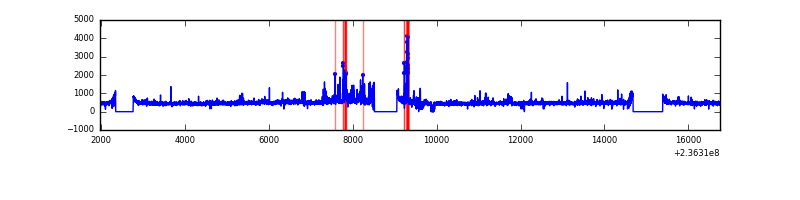 |
| B | 14775 | 13077 | 2 | 2 | 0.01% | 0.02% | 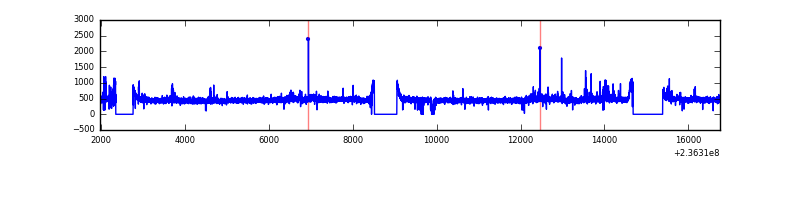 |
| C | 14775 | 13081 | 1 | 1 | 0.01% | 0.01% | 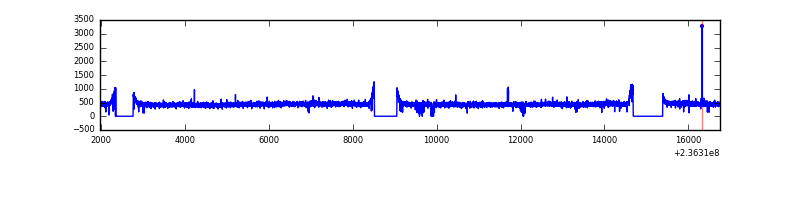 |
| D | 14775 | 13083 | 77 | 77 | 0.52% | 0.59% | 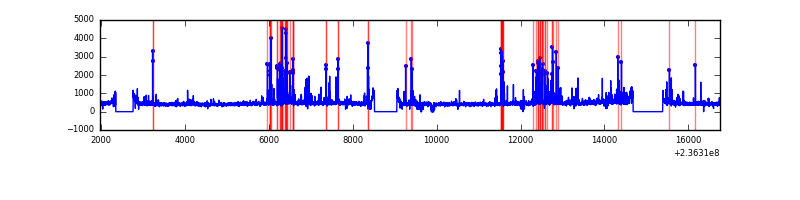 |
Top three noisy pixels from each quadrant. If the there are fewer than three noisy pixels in the level2.evt file, extra rows are filled as -1
| Pixel properties | Quadrant properties | ||||||
|---|---|---|---|---|---|---|---|
| Quadrant | DetID | PixID | Counts | Sigma | Mean | Median | Sigma |
| A | 8 | 5 | 658893 | 2104.62 | 1526 | 1490 | 312.4 |
| A | 1 | 162 | 58352 | 182.04 | 1526 | 1490 | 312.4 |
| A | 1 | 178 | 19452 | 57.5 | 1526 | 1490 | 312.4 |
| B | 5 | 255 | 101368 | 338.95 | 1528 | 1490 | 294.7 |
| B | 0 | 187 | 47018 | 154.51 | 1528 | 1490 | 294.7 |
| B | 12 | 111 | 33364 | 108.17 | 1528 | 1490 | 294.7 |
| C | 13 | 61 | 11316 | 28.63 | 1473 | 1479 | 343.6 |
| C | 14 | 234 | 10279 | 25.61 | 1473 | 1479 | 343.6 |
| C | 9 | 68 | 9717 | 23.97 | 1473 | 1479 | 343.6 |
| D | 12 | 233 | 396973 | 1101.11 | 1468 | 1432 | 359.2 |
| D | 1 | 52 | 161309 | 445.07 | 1468 | 1432 | 359.2 |
| D | 8 | 195 | 148464 | 409.31 | 1468 | 1432 | 359.2 |
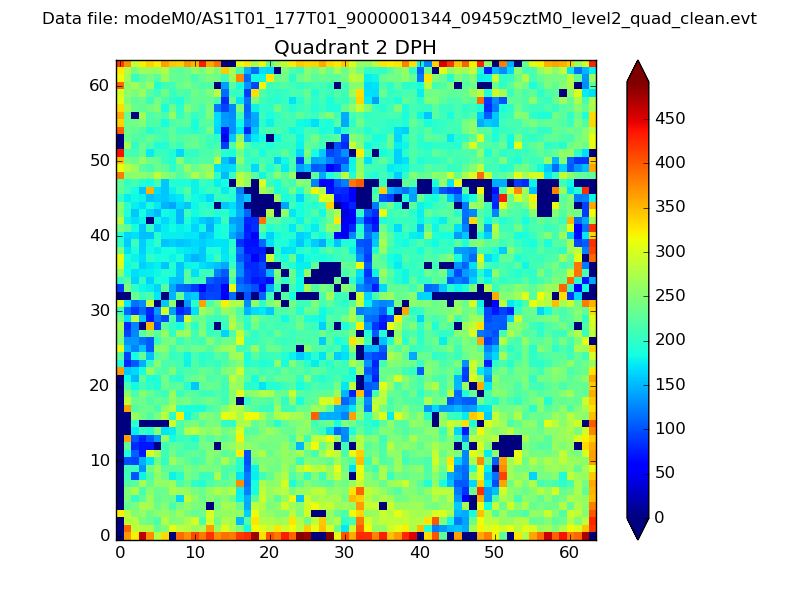
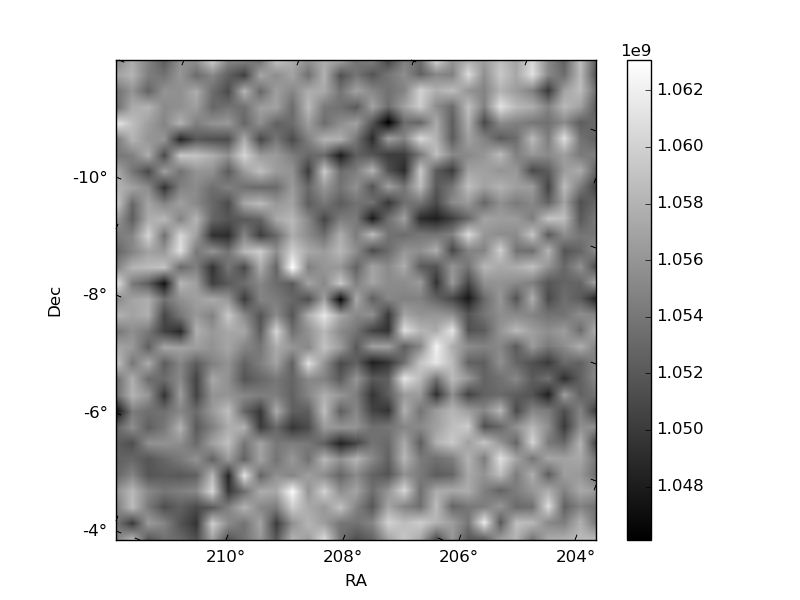
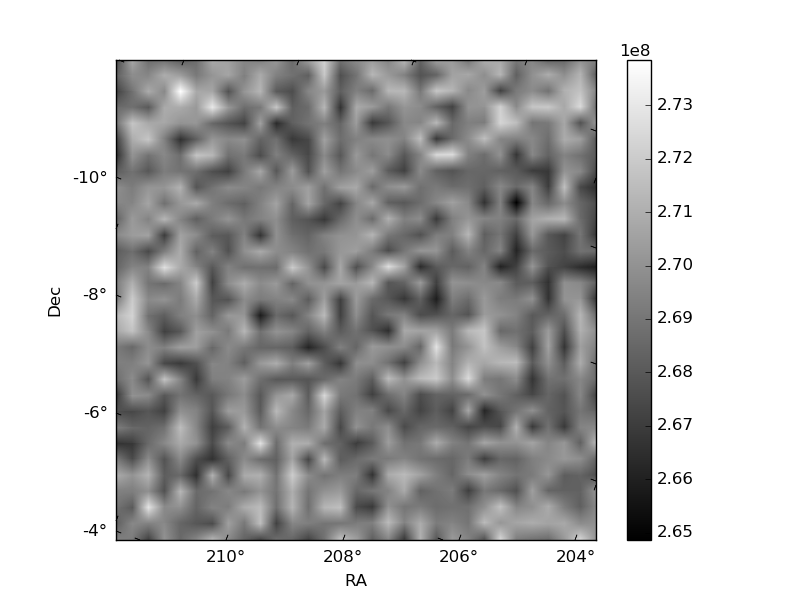
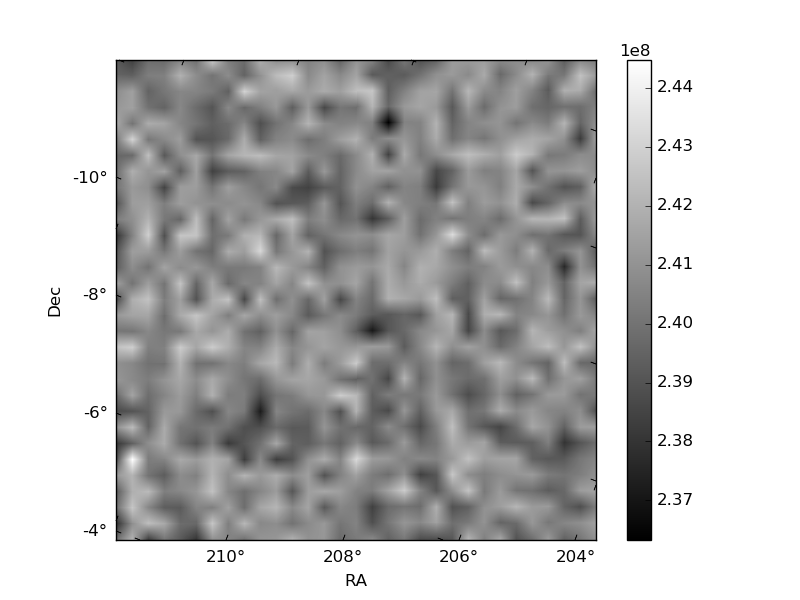
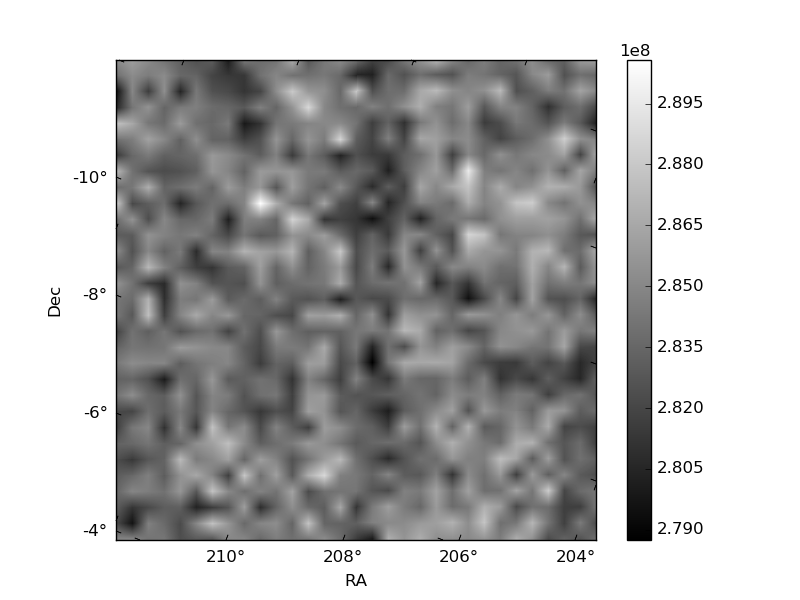
Histogram calculated using DETX and DETY for each event in the final _common_clean file
| Quadrant A | 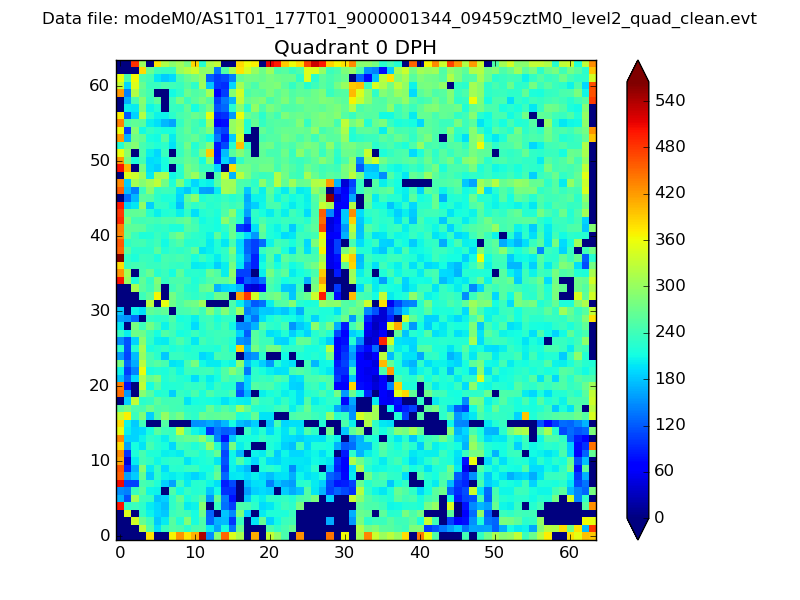 |
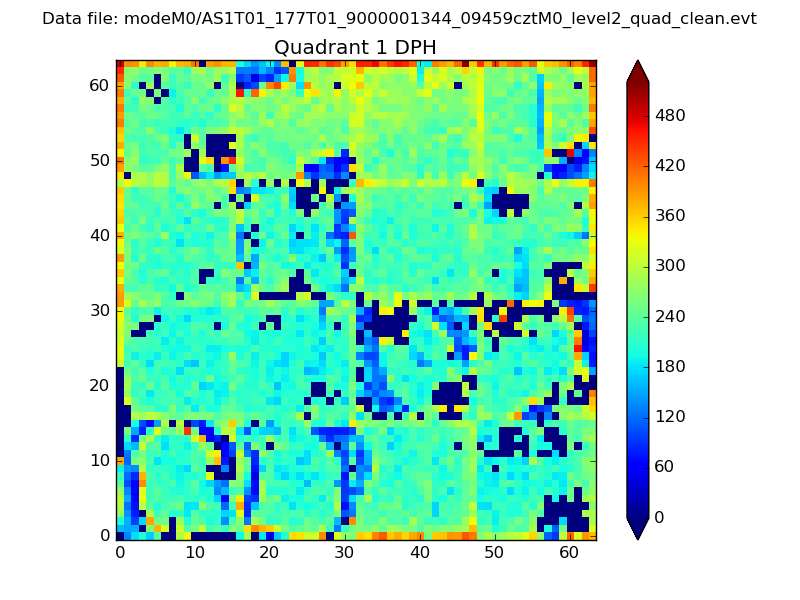 |
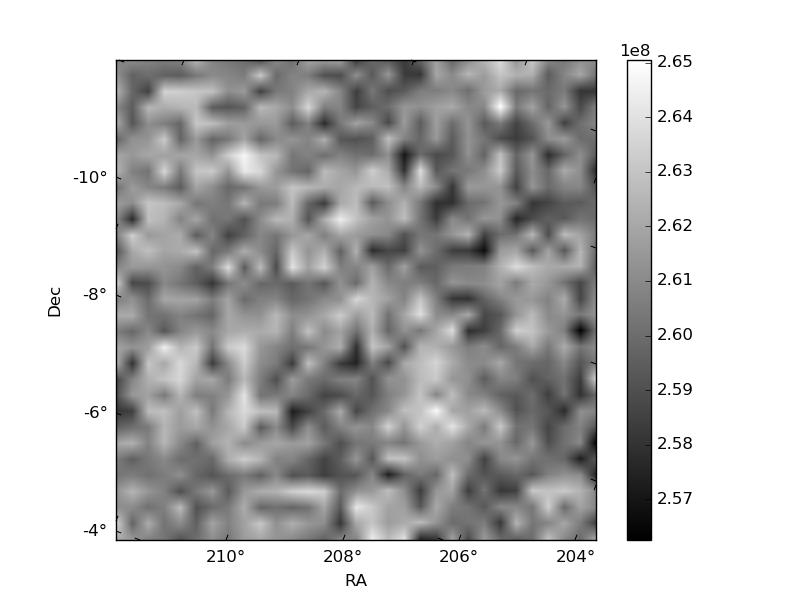
Quadrant B |
|---|---|---|---|
| Quadrant D | 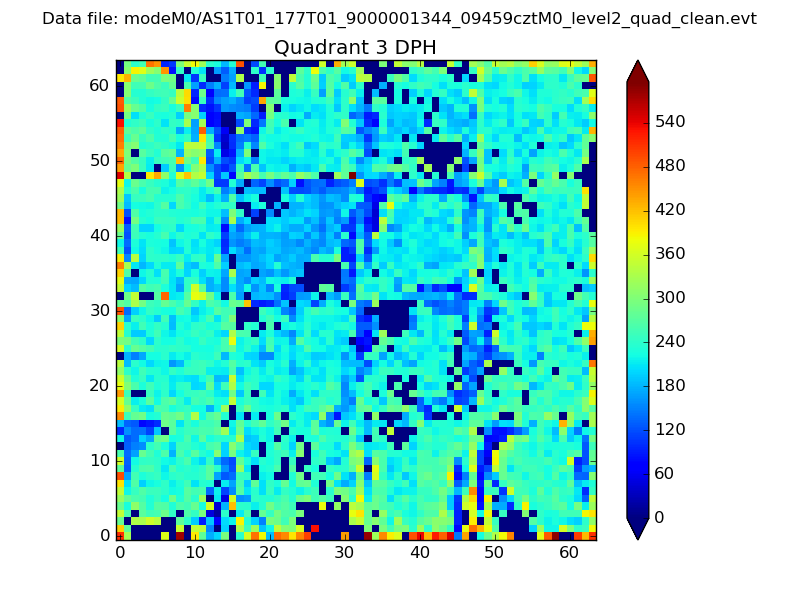 |
 |
Quadrant C |
| Plot type | Count rate plots | Images |
|---|---|---|
| Comparison with Poisson distribution Blue bars denote a histogram of data divided into 1 sec bins. Red curve is a Poisson curve with rate = median count rate of data. |
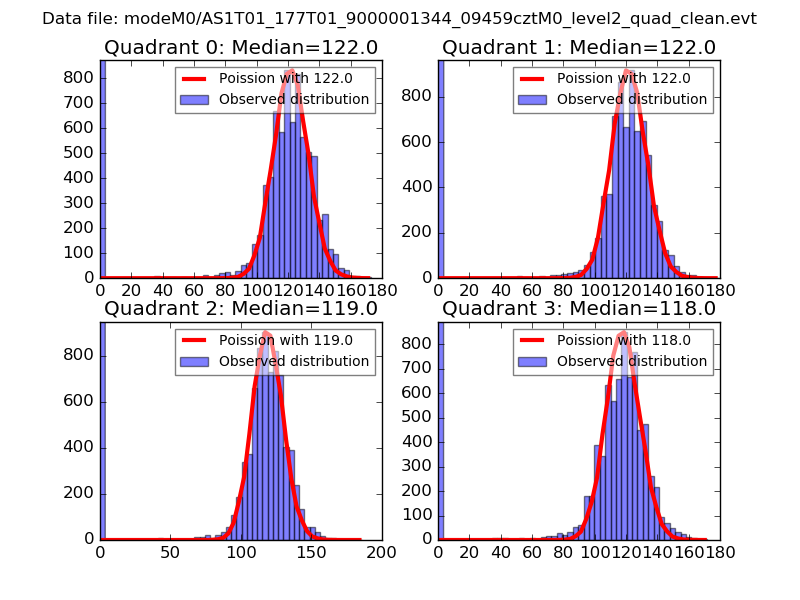 |
 |
| Quadrant-wise count rates Data is divided into 100 sec bins |
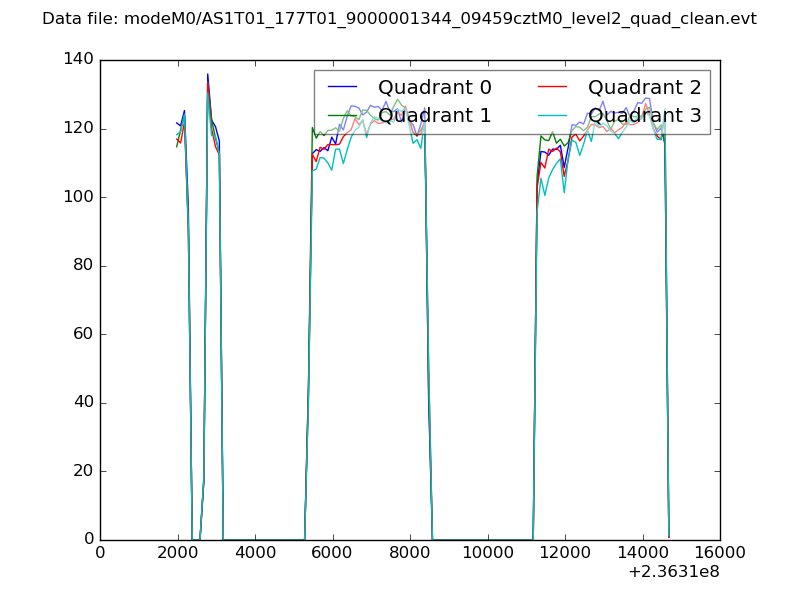 |
|
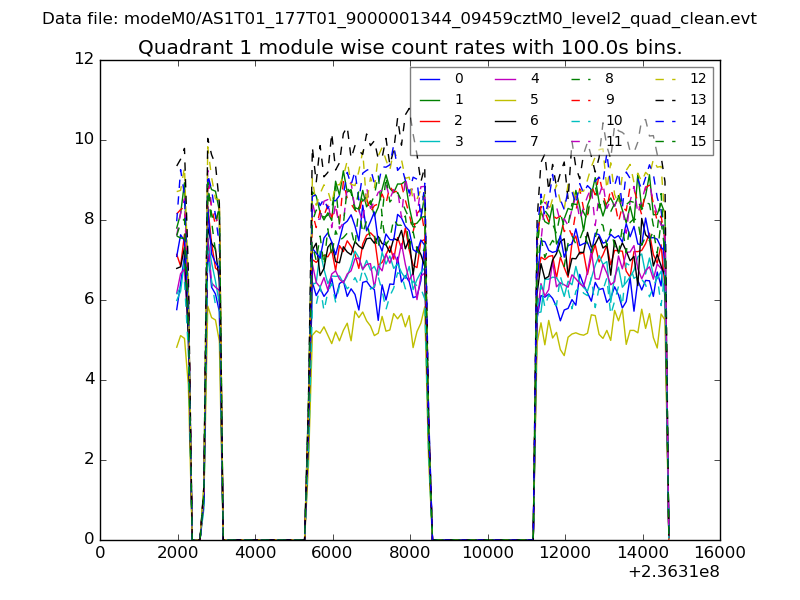
| Module-wise count rates for Quadrant A Data is divided into 100 sec bins |
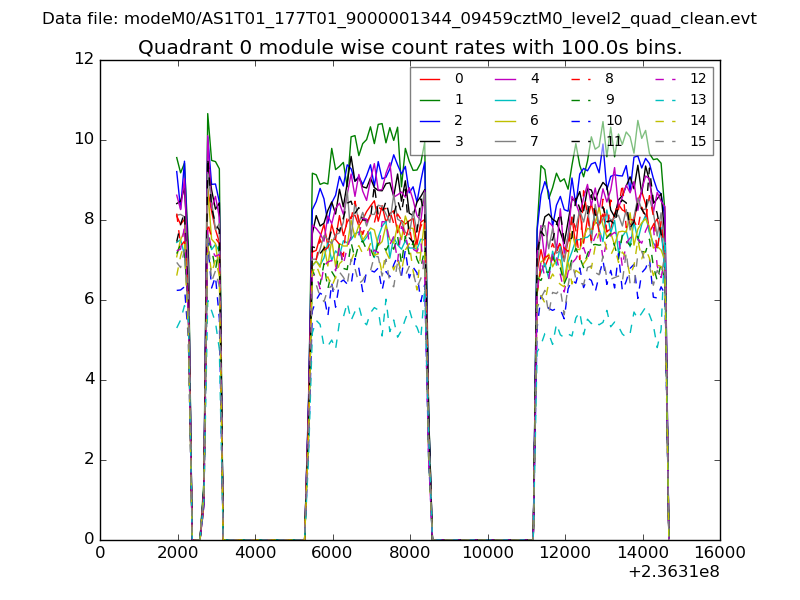 |
 |
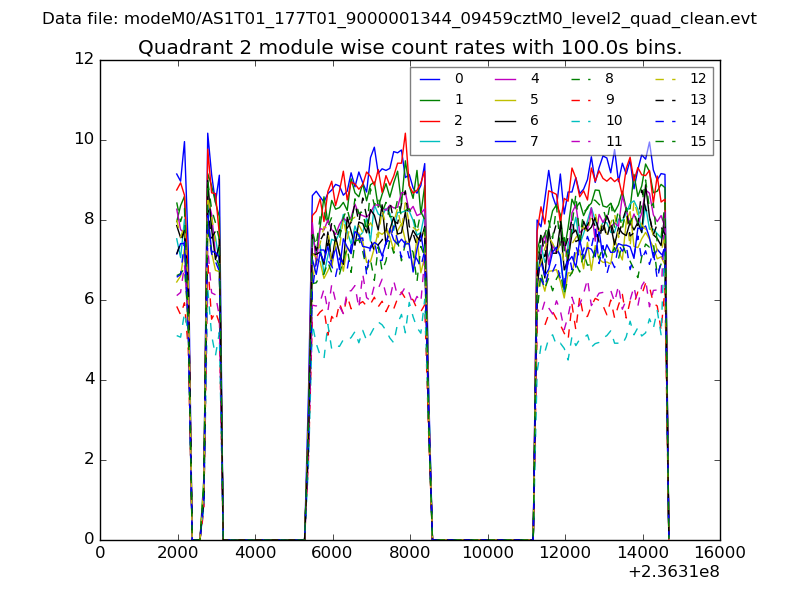
| Module-wise count rates for Quadrant B Data is divided into 100 sec bins |
 |
 |
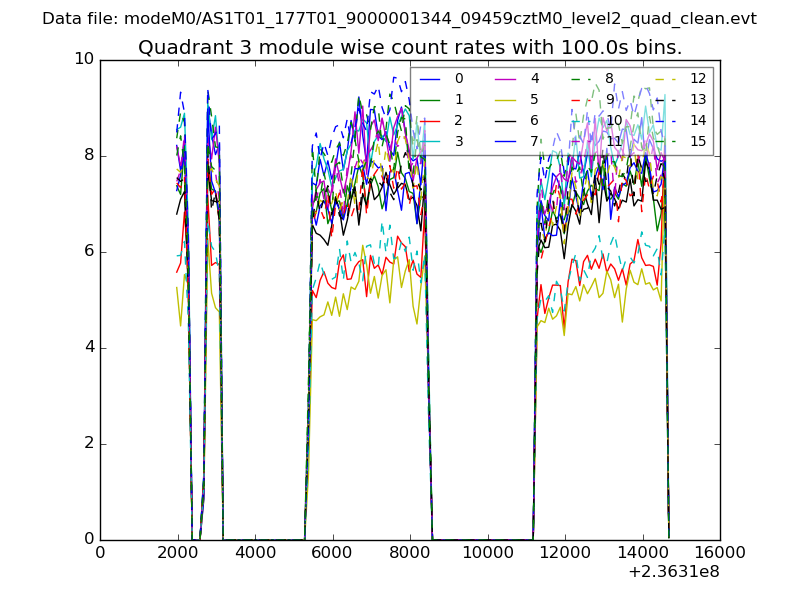
| Module-wise count rates for Quadrant C Data is divided into 100 sec bins |
 |
 |
| Module-wise count rates for Quadrant D Data is divided into 100 sec bins |
 |
 |
| Parameter | Plot |
|---|---|
| CZT HV Monitor | 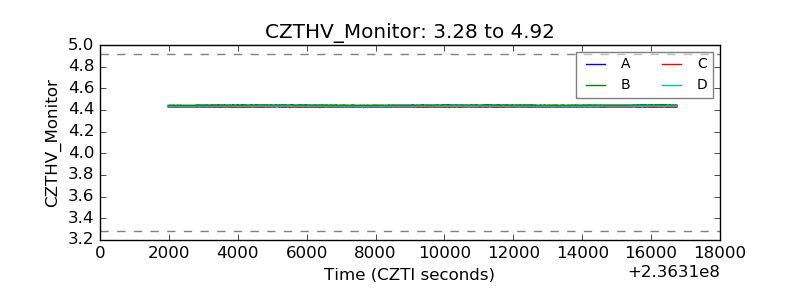 |
| D_VDD | 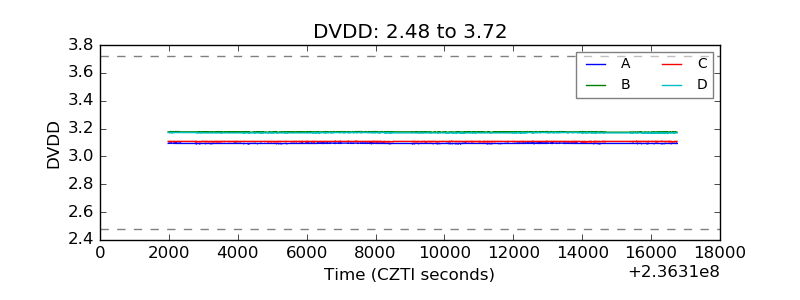 |
| Temperature 1 | 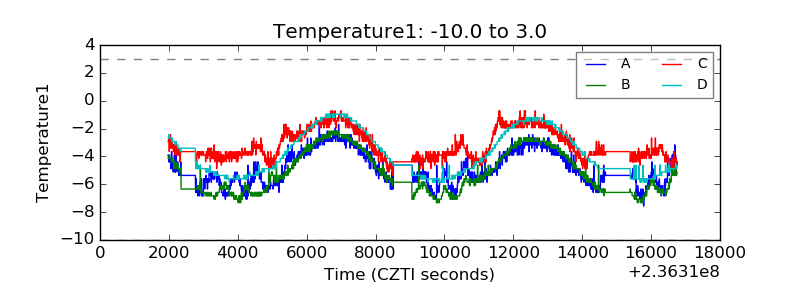 |
| Veto HV Monitor | 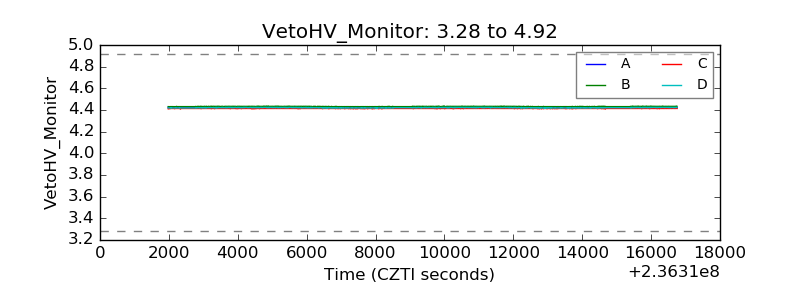 |
| Veto LLD | 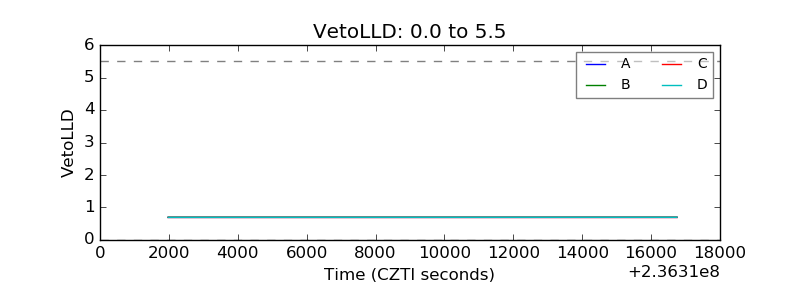 |
| Alpha Counter |  |
| _CPM_Rate |  |
| CZT Counter |  |
| +2.5 Volts monitor |  |
| +5 Volts monitor |  |
| _ROLL_ROT | 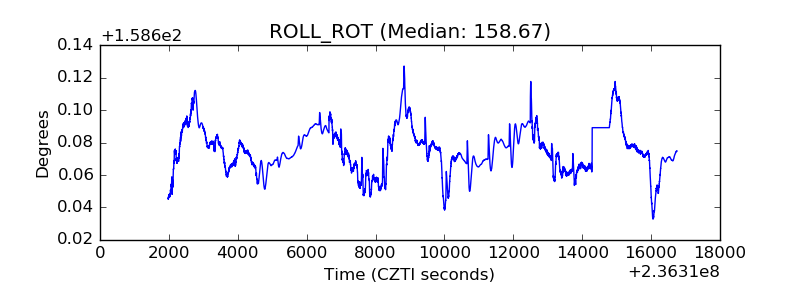 |
| _Roll_DEC | 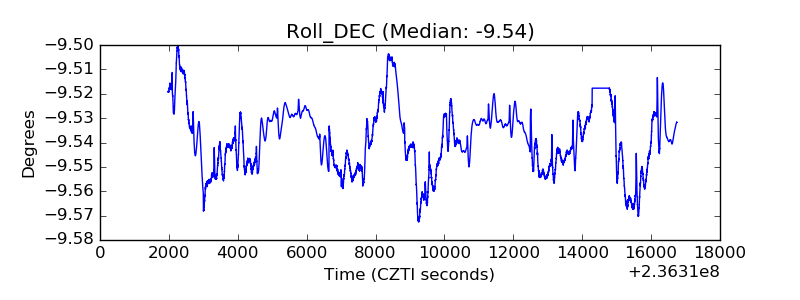 |
| _Roll_RA |  |
| Veto Counter | 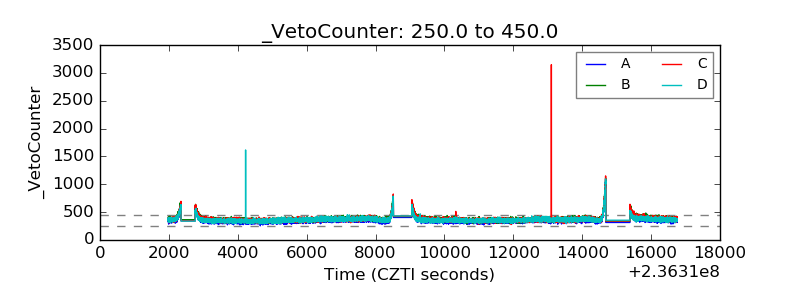 |