| Param | Original file | Final file |
|---|---|---|
| Filename | modeM0/AS1T01_177T01_9000001344_09461cztM0_level2.evt | modeM0/AS1T01_177T01_9000001344_09461cztM0_level2_quad_clean.evt |
| Size (bytes) | 461,131,200 | 79,182,720 |
| Size | 439.8 MB | 75.5 MB |
| Events in quadrant A | 3,343,586 | 493,203 |
| Events in quadrant B | 3,198,826 | 494,022 |
| Events in quadrant C | 3,133,439 | 483,200 |
| Events in quadrant D | 3,843,196 | 469,415 |
| Mode M9 | |||
|---|---|---|---|
| Quadrant | BADHDUFLAG | Total packets | Discarded packets |
| A | 0 | 12 | 0 |
| B | 0 | 12 | 0 |
| C | 0 | 12 | 0 |
| D | 0 | 13 | 0 |
| Mode M0 | |||
|---|---|---|---|
| Quadrant | BADHDUFLAG | Total packets | Discarded packets |
| A | 0 | 14126 | 148 |
| B | 0 | 13801 | 148 |
| C | 0 | 13957 | 130 |
| D | 0 | 15924 | 163 |
| Mode SS | |||
|---|---|---|---|
| Quadrant | BADHDUFLAG | Total packets | Discarded packets |
| A | 0 | 136 | 2 |
| B | 0 | 136 | 2 |
| C | 0 | 136 | 2 |
| D | 0 | 136 | 2 |
| Quadrant | Total seconds | Saturated seconds | Saturation percentage |
|---|---|---|---|
| A | 6564 | 84 | 1.279707% |
| B | 6561 | 78 | 1.188843% |
| C | 6571 | 59 | 0.897885% |
| D | 6558 | 176 | 2.683745% |
Noise dominated data is calculated using 1-second bins in cleaned event files. If a bin has >2000 counts, and if more than 50% of those come from <1% of pixels, then it is considered to be noise-dominated and hence unusable.
| Quadrant | # 1 sec bins | Bins with >0 counts | Bins with >2000 counts | High rate bins dominated by noise | Noise dominated (total time) | Noise dominated (detector-on time) | Marked lightcurve |
|---|---|---|---|---|---|---|---|
| A | 7668 | 6617 | 3 | 3 | 0.04% | 0.05% | 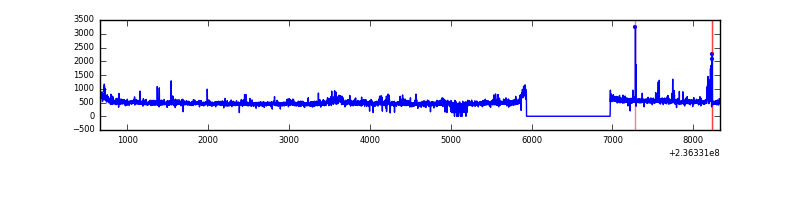 |
| B | 7668 | 6618 | 2 | 2 | 0.03% | 0.03% | 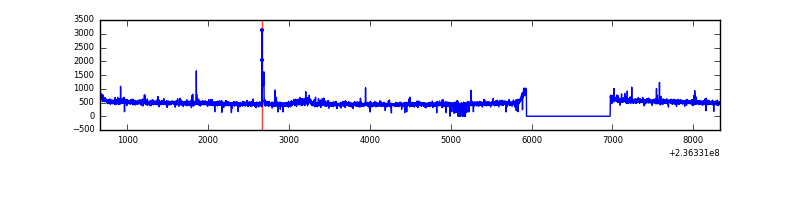 |
| C | 7668 | 6620 | 0 | 0 | 0.00% | 0.00% | 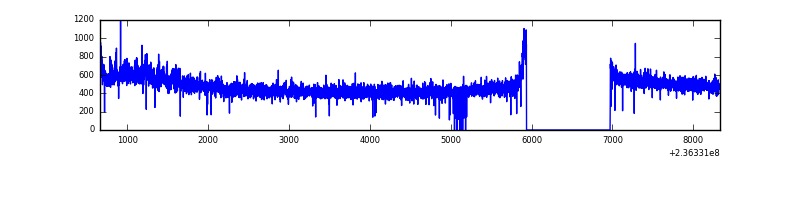 |
| D | 7668 | 6620 | 102 | 102 | 1.33% | 1.54% | 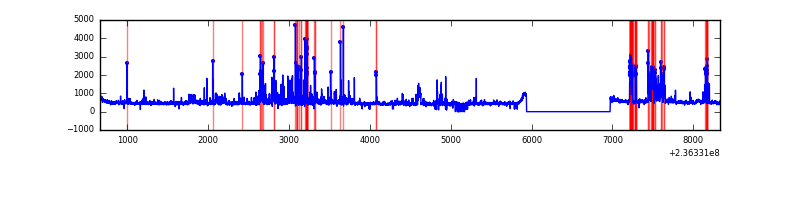 |
Top three noisy pixels from each quadrant. If the there are fewer than three noisy pixels in the level2.evt file, extra rows are filled as -1
| Pixel properties | Quadrant properties | ||||||
|---|---|---|---|---|---|---|---|
| Quadrant | DetID | PixID | Counts | Sigma | Mean | Median | Sigma |
| A | 8 | 5 | 181072 | 1094.58 | 804 | 787 | 164.7 |
| A | 1 | 162 | 29075 | 171.75 | 804 | 787 | 164.7 |
| A | 14 | 111 | 13341 | 76.22 | 804 | 787 | 164.7 |
| B | 5 | 255 | 40813 | 262.92 | 799 | 780 | 152.3 |
| B | 0 | 187 | 18819 | 118.47 | 799 | 780 | 152.3 |
| B | 0 | 214 | 18576 | 116.87 | 799 | 780 | 152.3 |
| C | 9 | 68 | 112516 | 621.53 | 774 | 778 | 179.8 |
| C | 13 | 61 | 5772 | 27.78 | 774 | 778 | 179.8 |
| C | 14 | 234 | 2457 | 9.34 | 774 | 778 | 179.8 |
| D | 1 | 52 | 561243 | 2953.38 | 768 | 749 | 189.8 |
| D | 12 | 233 | 191980 | 1007.64 | 768 | 749 | 189.8 |
| D | 13 | 104 | 67582 | 352.16 | 768 | 749 | 189.8 |
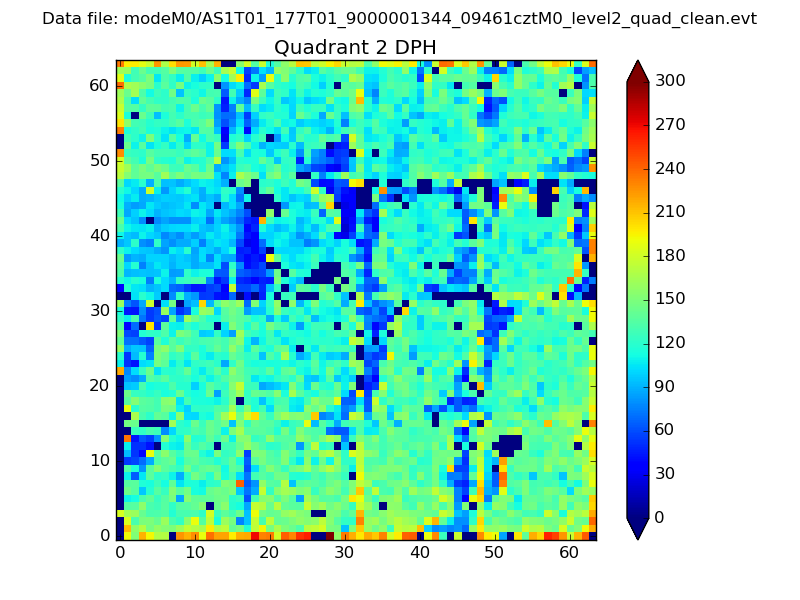
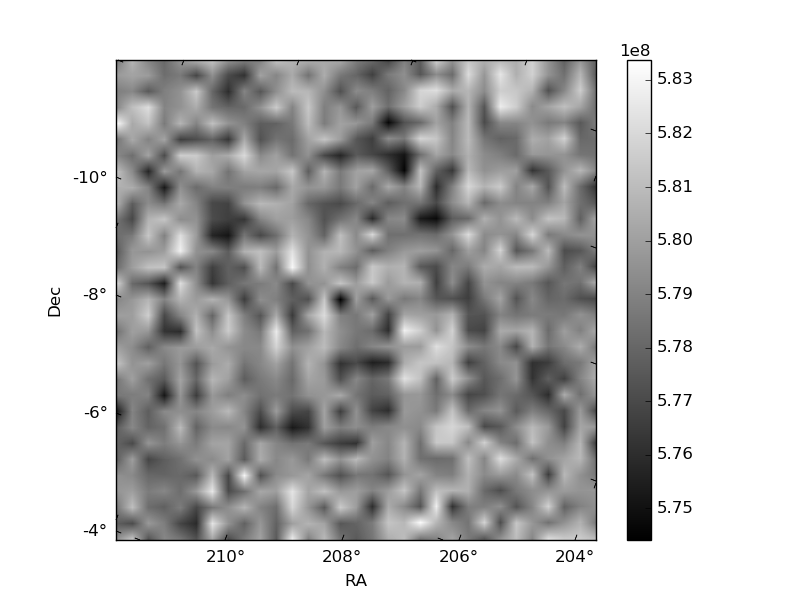
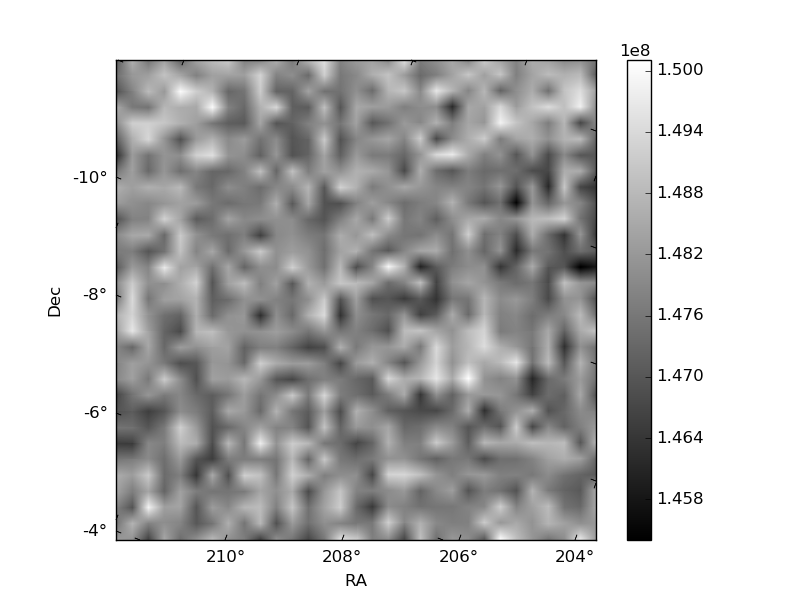
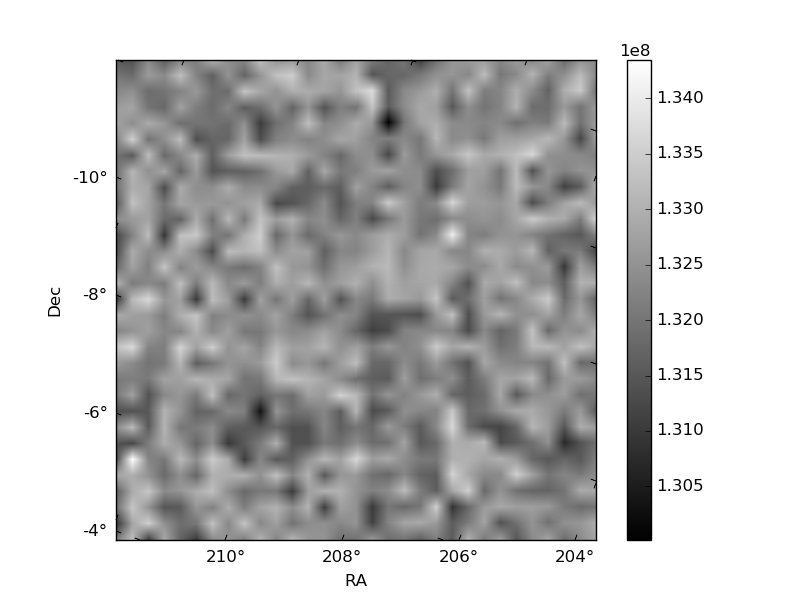
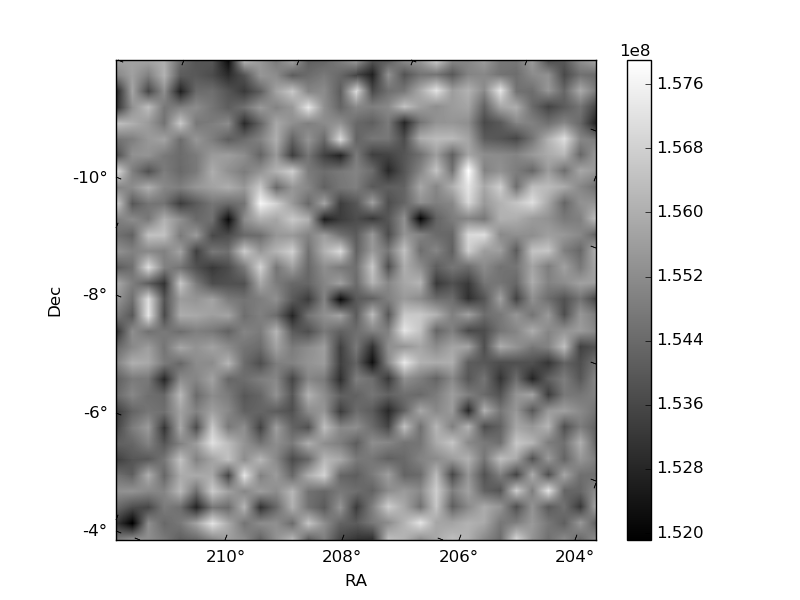
Histogram calculated using DETX and DETY for each event in the final _common_clean file
| Quadrant A | 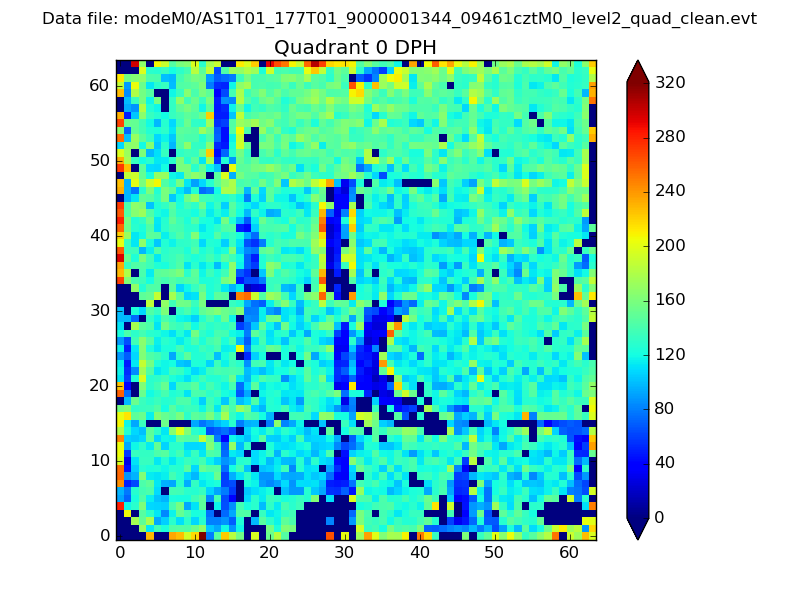 |
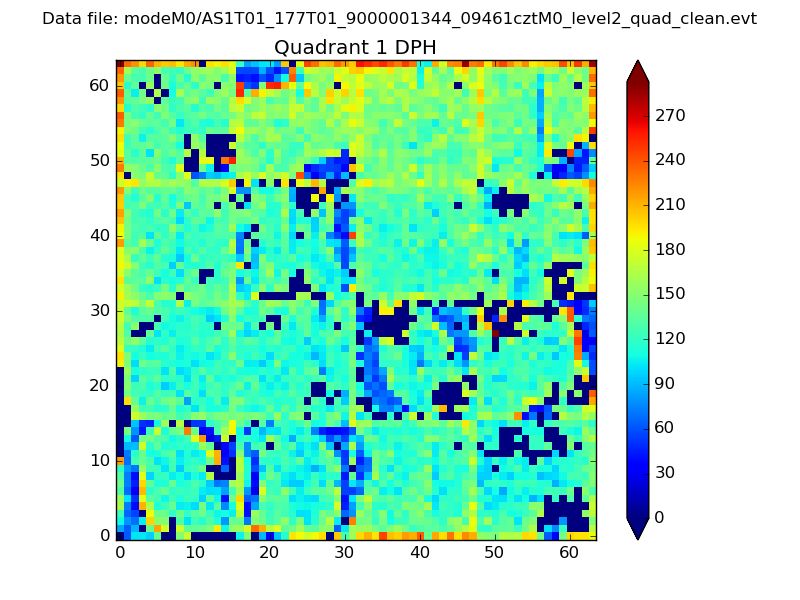 |
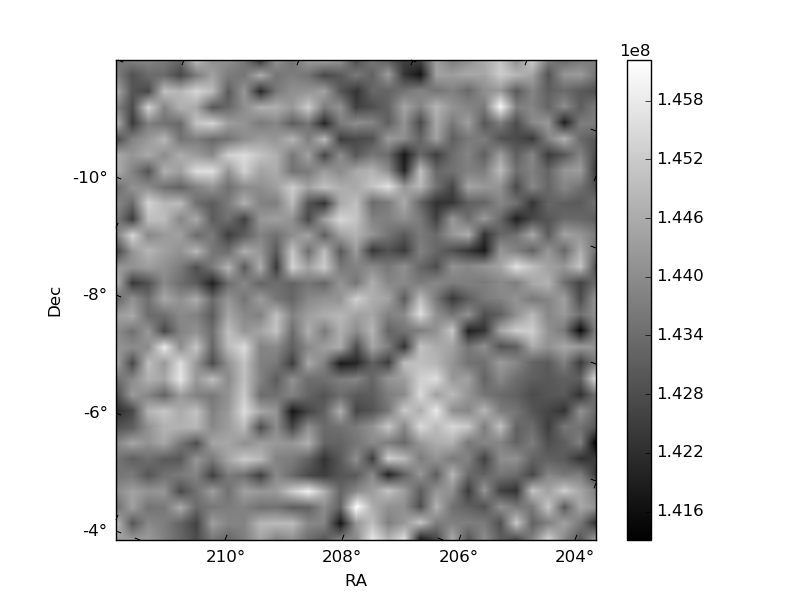
Quadrant B |
|---|---|---|---|
| Quadrant D | 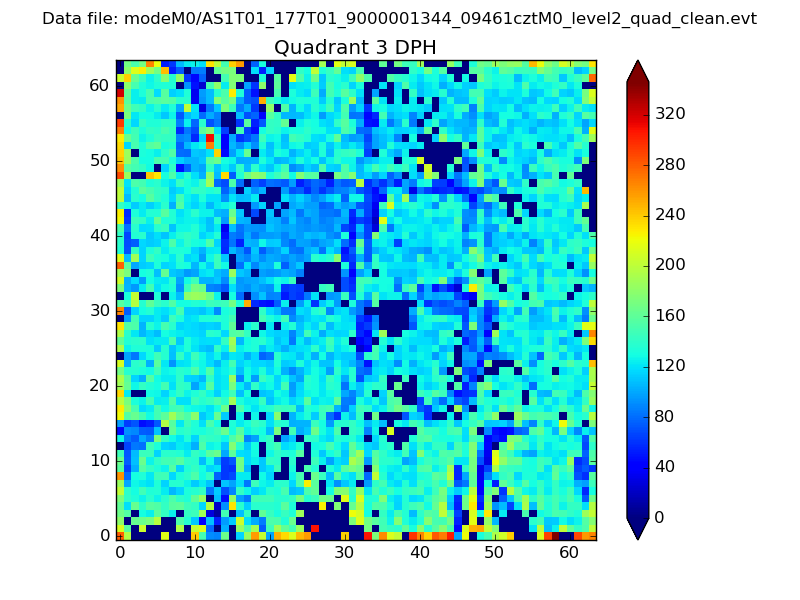 |
 |
Quadrant C |
| Plot type | Count rate plots | Images |
|---|---|---|
| Comparison with Poisson distribution Blue bars denote a histogram of data divided into 1 sec bins. Red curve is a Poisson curve with rate = median count rate of data. |
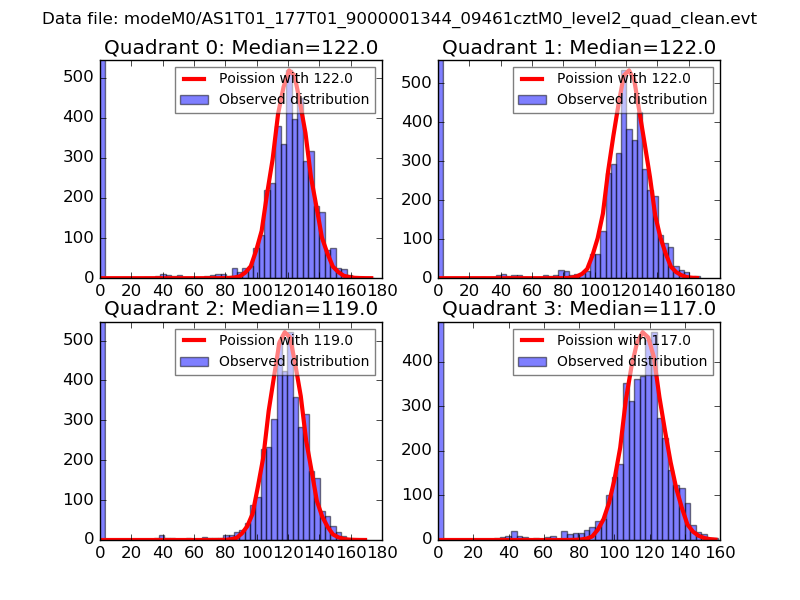 |
 |
| Quadrant-wise count rates Data is divided into 100 sec bins |
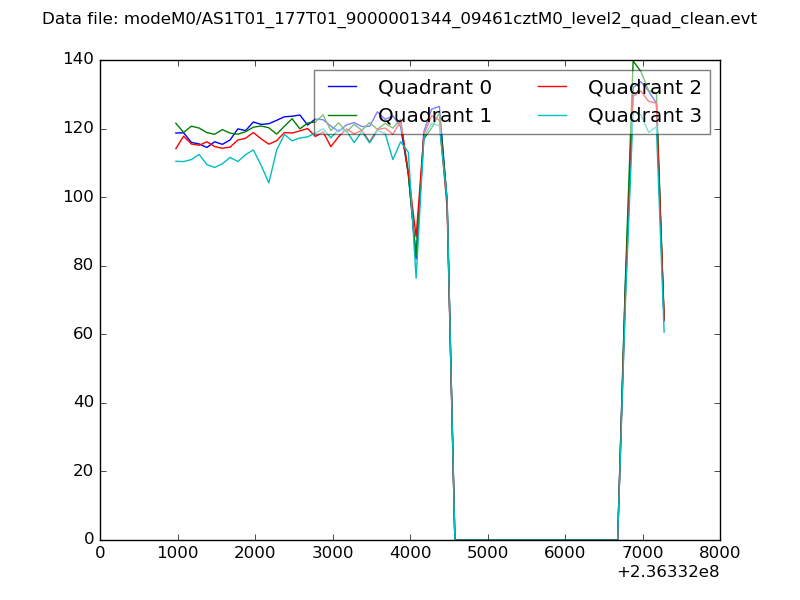 |
|
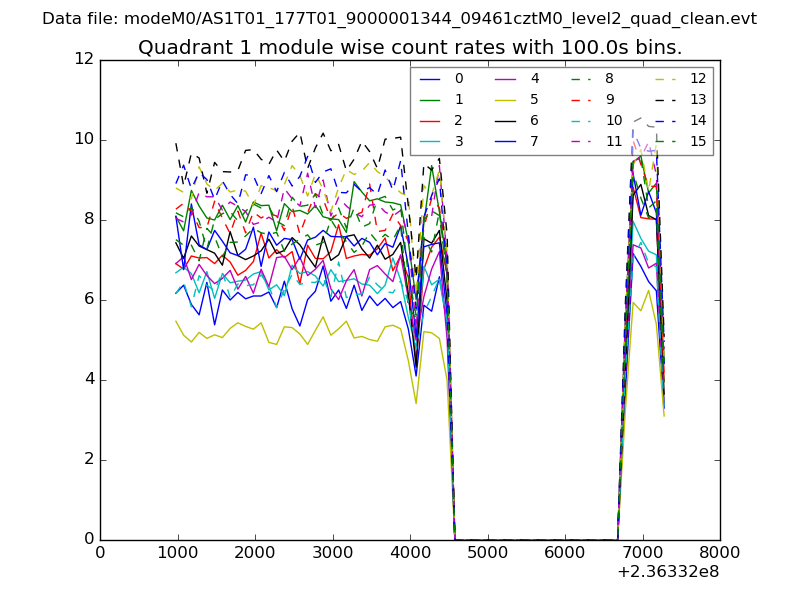
| Module-wise count rates for Quadrant A Data is divided into 100 sec bins |
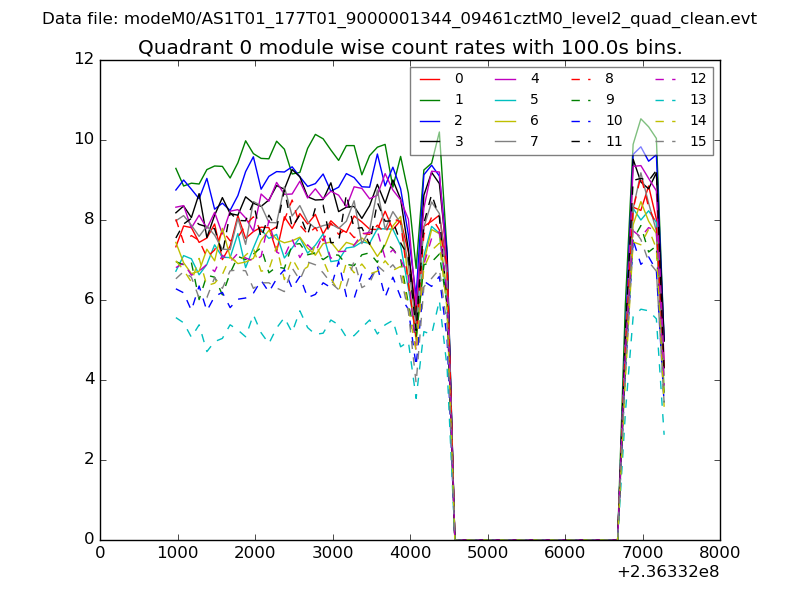 |
 |
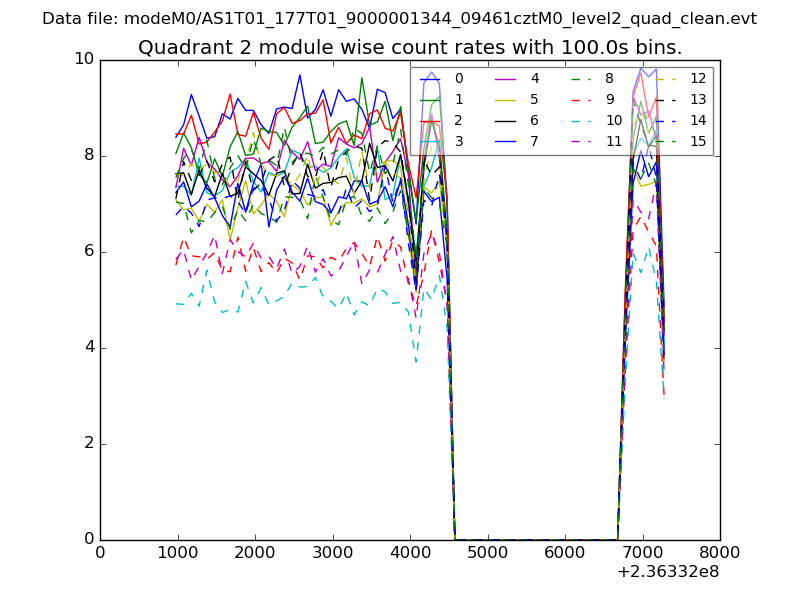
| Module-wise count rates for Quadrant B Data is divided into 100 sec bins |
 |
 |
| Module-wise count rates for Quadrant C Data is divided into 100 sec bins |
 |
 |
| Module-wise count rates for Quadrant D Data is divided into 100 sec bins |
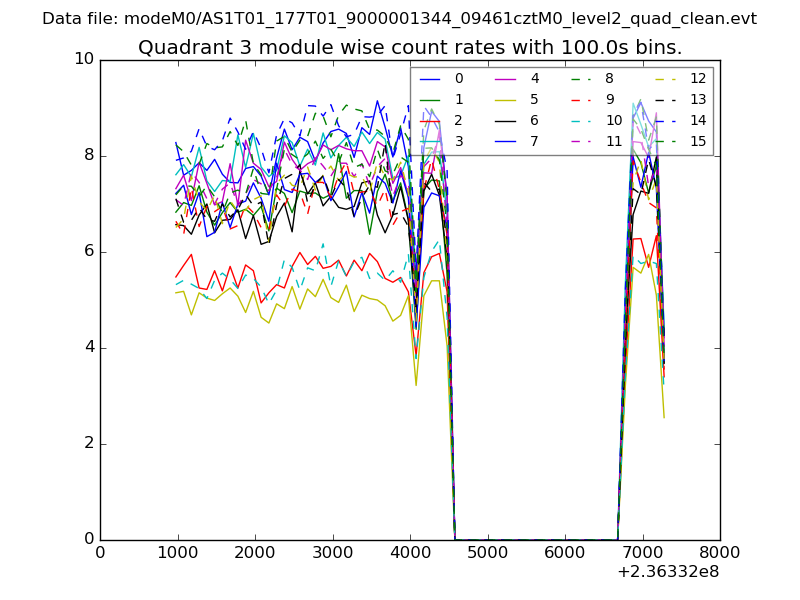 |
 |
| Parameter | Plot |
|---|---|
| CZT HV Monitor | 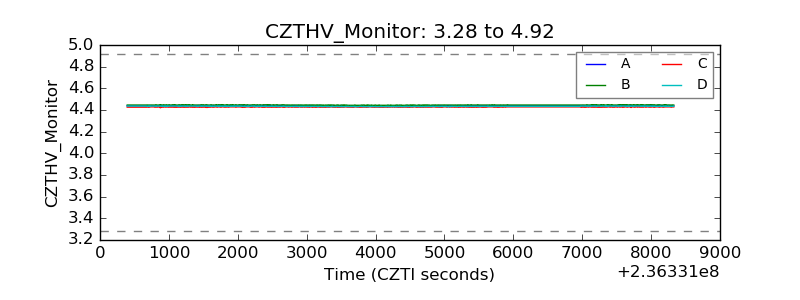 |
| D_VDD | 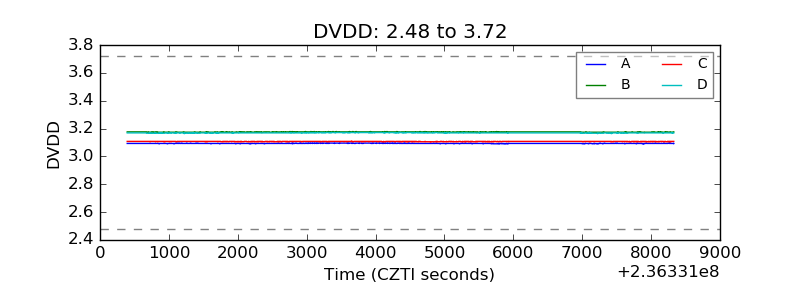 |
| Temperature 1 | 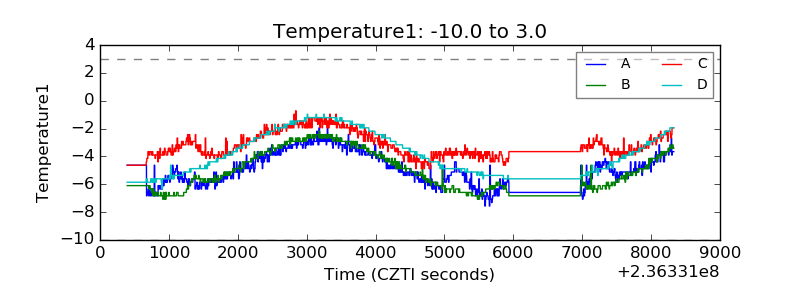 |
| Veto HV Monitor |  |
| Veto LLD | 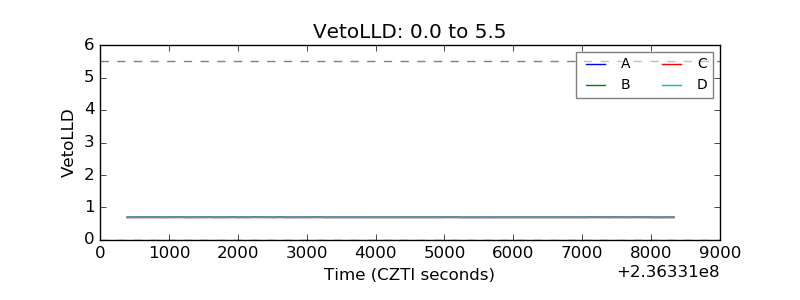 |
| Alpha Counter |  |
| _CPM_Rate | 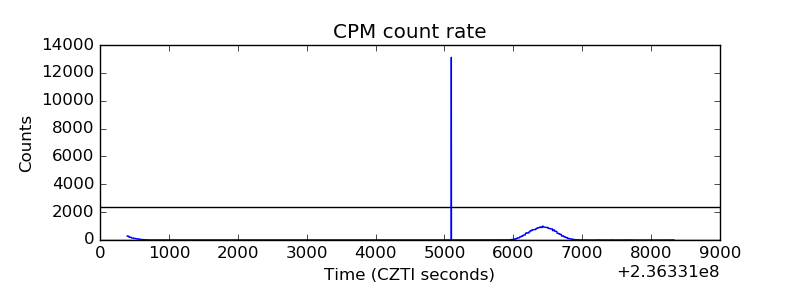 |
| CZT Counter | 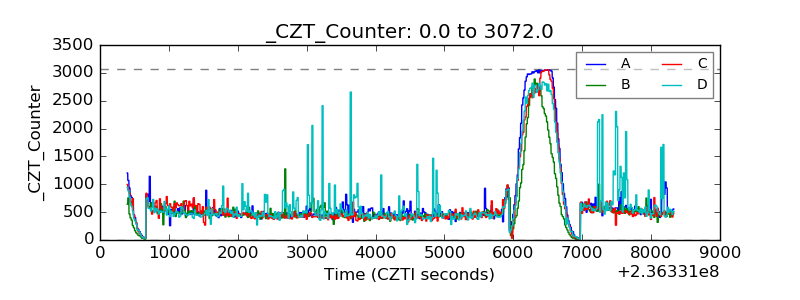 |
| +2.5 Volts monitor |  |
| +5 Volts monitor |  |
| _ROLL_ROT | 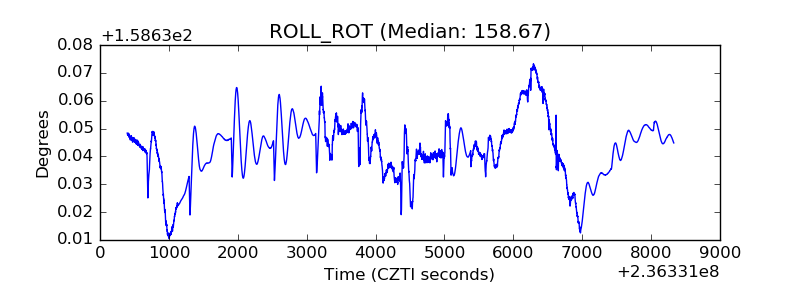 |
| _Roll_DEC | 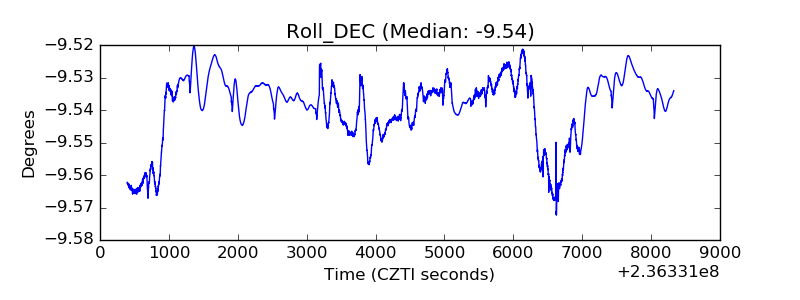 |
| _Roll_RA | 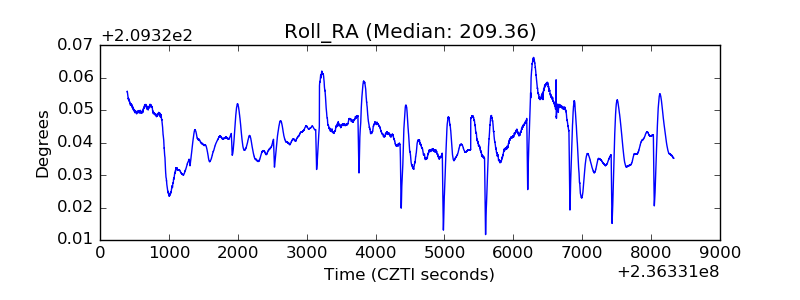 |
| Veto Counter | 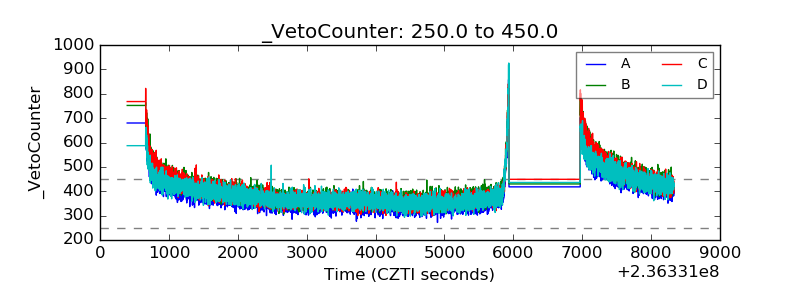 |