| Param | Original file | Final file |
|---|---|---|
| Filename | modeM0/AS1T01_177T01_9000001344_09463cztM0_level2.evt | modeM0/AS1T01_177T01_9000001344_09463cztM0_level2_quad_clean.evt |
| Size (bytes) | 110,396,160 | 25,914,240 |
| Size | 105.3 MB | 24.7 MB |
| Events in quadrant A | 793,122 | 171,965 |
| Events in quadrant B | 798,886 | 171,698 |
| Events in quadrant C | 718,685 | 165,812 |
| Events in quadrant D | 920,537 | 156,299 |
| Mode M0 | |||
|---|---|---|---|
| Quadrant | BADHDUFLAG | Total packets | Discarded packets |
| A | 0 | 5785 | 2440 |
| B | 0 | 5656 | 2316 |
| C | 0 | 5465 | 2228 |
| D | 0 | 7069 | 3390 |
| Mode SS | |||
|---|---|---|---|
| Quadrant | BADHDUFLAG | Total packets | Discarded packets |
| A | 0 | 54 | 26 |
| B | 0 | 54 | 18 |
| C | 0 | 54 | 22 |
| D | 0 | 54 | 18 |
| Quadrant | Total seconds | Saturated seconds | Saturation percentage |
|---|---|---|---|
| A | 1618 | 3 | 0.185414% |
| B | 1627 | 1 | 0.061463% |
| C | 1614 | 0 | 0.000000% |
| D | 1521 | 10 | 0.657462% |
Noise dominated data is calculated using 1-second bins in cleaned event files. If a bin has >2000 counts, and if more than 50% of those come from <1% of pixels, then it is considered to be noise-dominated and hence unusable.
| Quadrant | # 1 sec bins | Bins with >0 counts | Bins with >2000 counts | High rate bins dominated by noise | Noise dominated (total time) | Noise dominated (detector-on time) | Marked lightcurve |
|---|---|---|---|---|---|---|---|
| A | 2726 | 2116 | 0 | 0 | 0.00% | 0.00% | 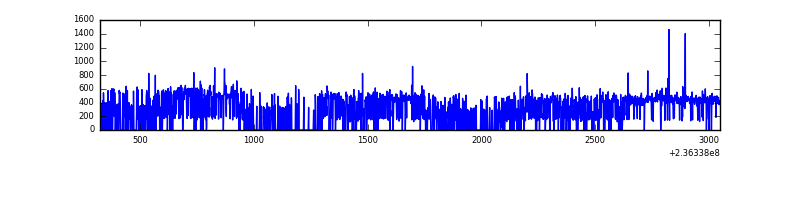 |
| B | 2720 | 2135 | 1 | 1 | 0.04% | 0.05% | 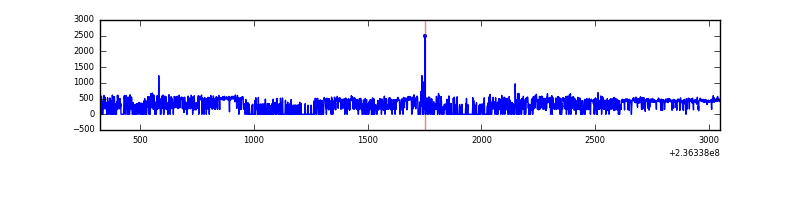 |
| C | 2725 | 2122 | 0 | 0 | 0.00% | 0.00% | 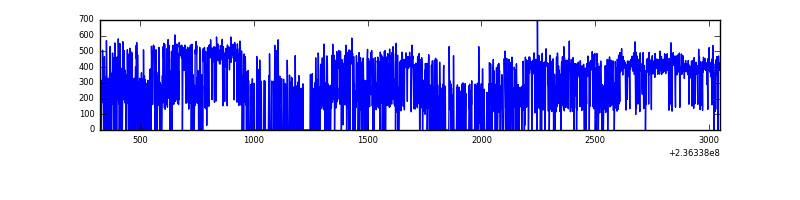 |
| D | 2726 | 2008 | 2 | 2 | 0.07% | 0.10% | 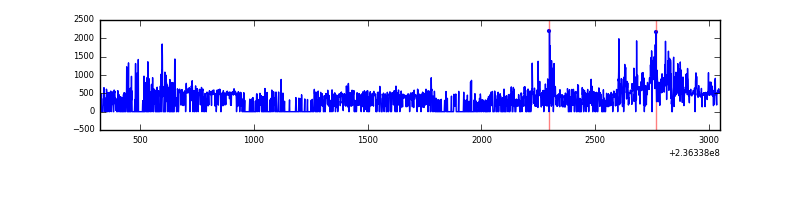 |
Top three noisy pixels from each quadrant. If the there are fewer than three noisy pixels in the level2.evt file, extra rows are filled as -1
| Pixel properties | Quadrant properties | ||||||
|---|---|---|---|---|---|---|---|
| Quadrant | DetID | PixID | Counts | Sigma | Mean | Median | Sigma |
| A | 8 | 5 | 27017 | 649.46 | 194 | 190 | 41.3 |
| A | 15 | 14 | 8260 | 195.37 | 194 | 190 | 41.3 |
| A | 1 | 162 | 5757 | 134.77 | 194 | 190 | 41.3 |
| B | 0 | 187 | 22773 | 583.57 | 192 | 188 | 38.7 |
| B | 0 | 214 | 13361 | 340.38 | 192 | 188 | 38.7 |
| B | 10 | 252 | 9404 | 238.13 | 192 | 188 | 38.7 |
| C | 13 | 61 | 1367 | 26.96 | 184 | 184 | 43.9 |
| C | 3 | 202 | 554 | 8.43 | 184 | 184 | 43.9 |
| C | 3 | 203 | 411 | 5.17 | 184 | 184 | 43.9 |
| D | 1 | 52 | 154190 | 3559.8 | 175 | 171 | 43.3 |
| D | 13 | 104 | 73192 | 1687.71 | 175 | 171 | 43.3 |
| D | 7 | 71 | 10374 | 235.82 | 175 | 171 | 43.3 |
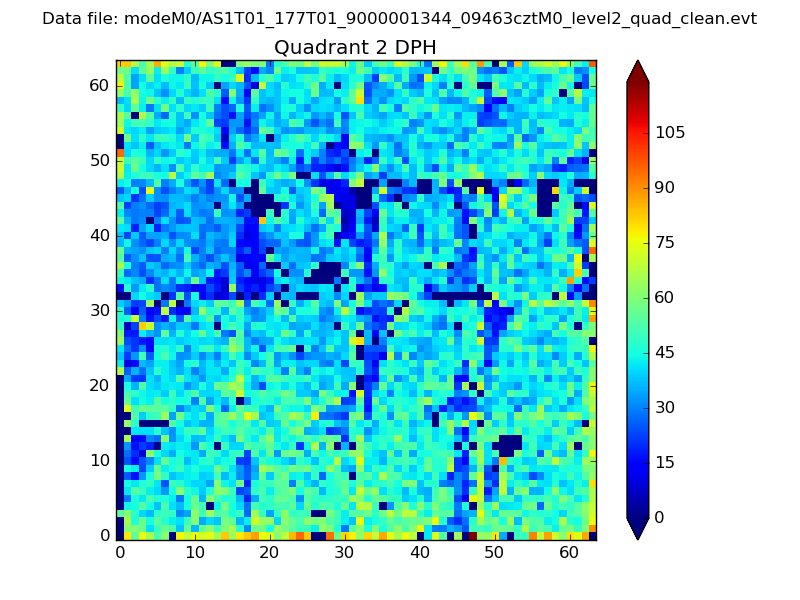
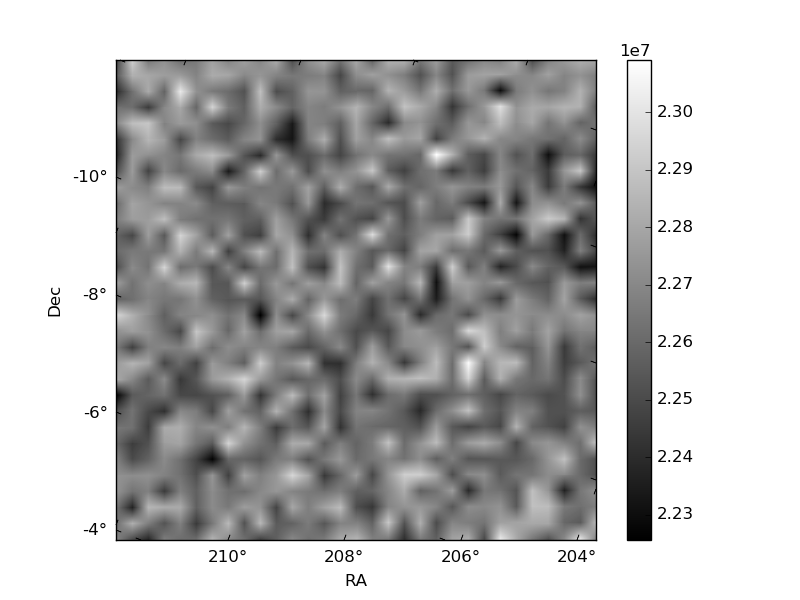
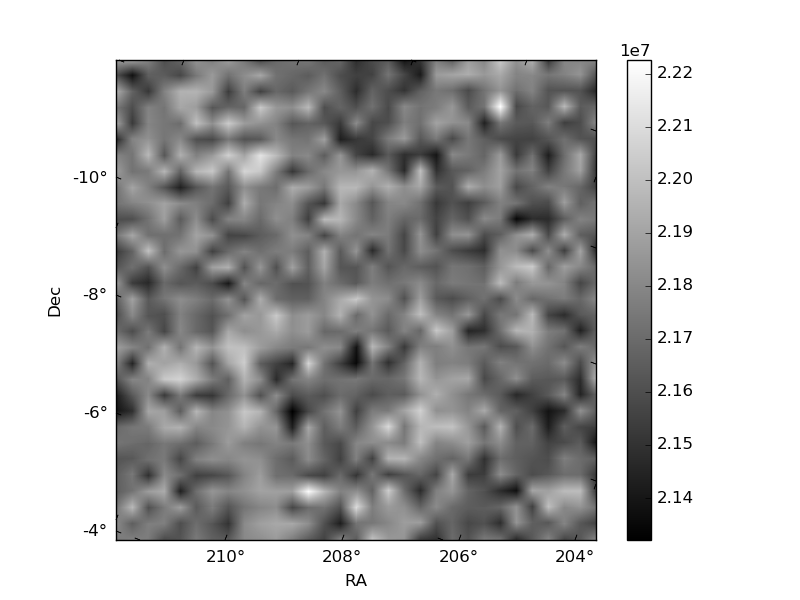
Histogram calculated using DETX and DETY for each event in the final _common_clean file
| Quadrant A | 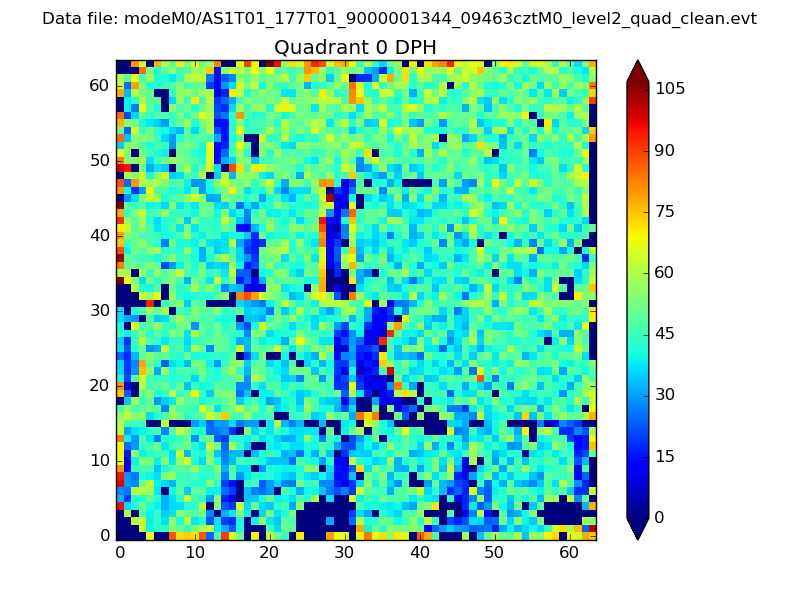 |
 |
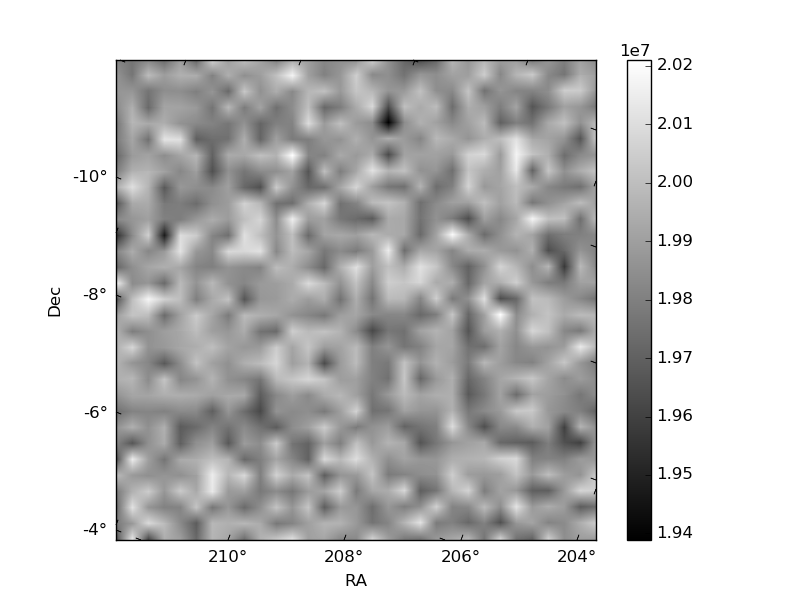
Quadrant B |
|---|---|---|---|
| Quadrant D | 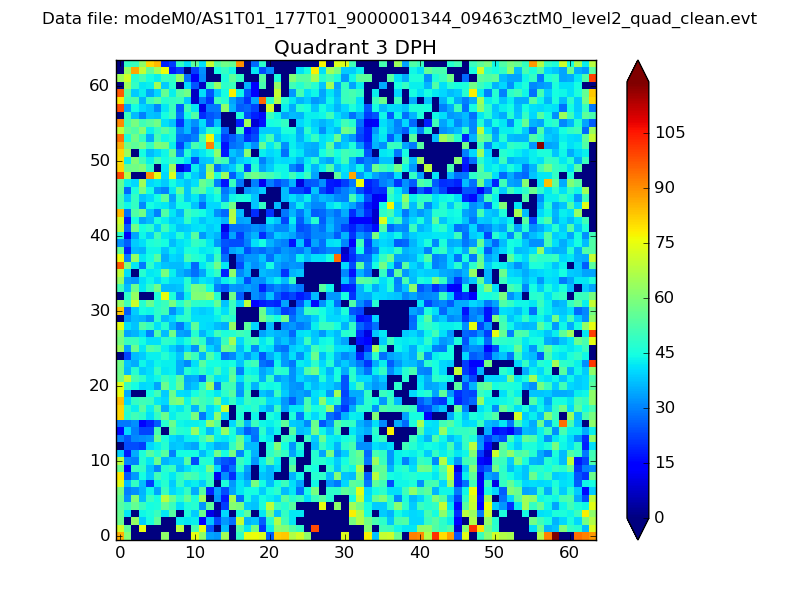 |
 |
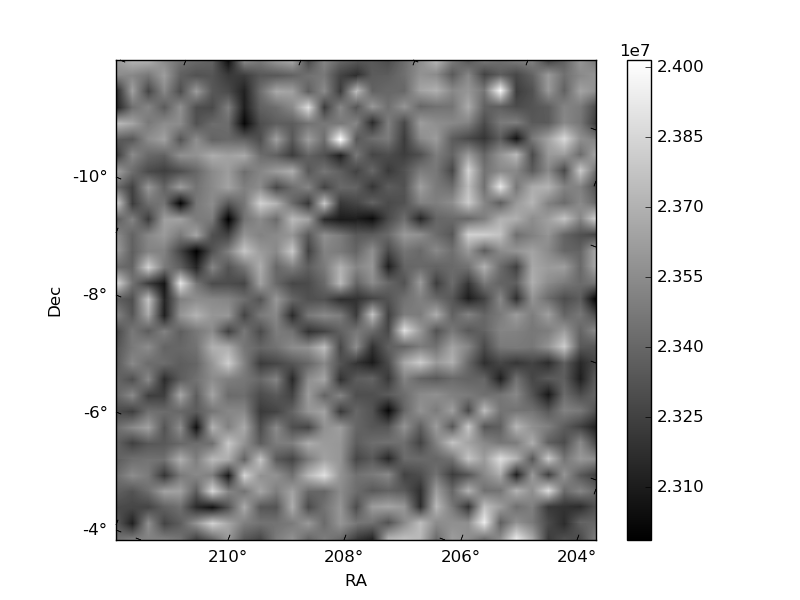
Quadrant C |
| Plot type | Count rate plots | Images |
|---|---|---|
| Comparison with Poisson distribution Blue bars denote a histogram of data divided into 1 sec bins. Red curve is a Poisson curve with rate = median count rate of data. |
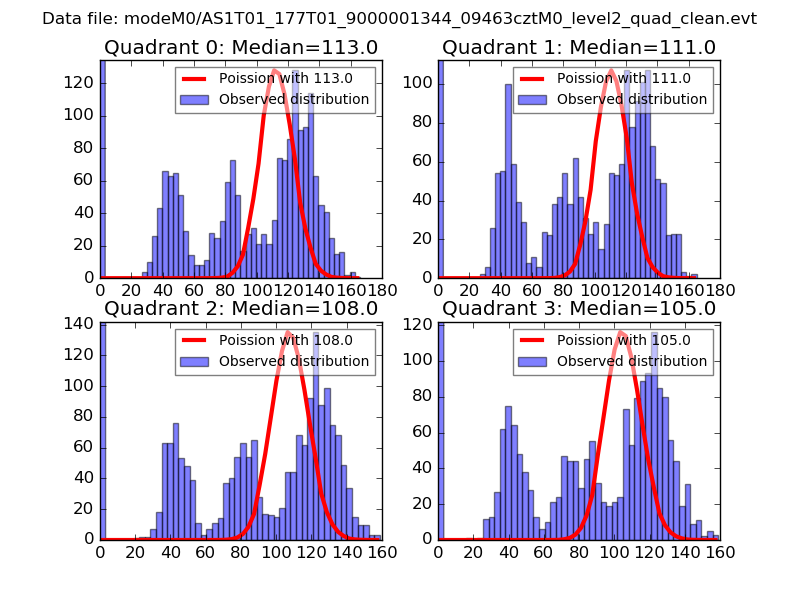 |
 |
| Quadrant-wise count rates Data is divided into 100 sec bins |
 |
|
| Module-wise count rates for Quadrant A Data is divided into 100 sec bins |
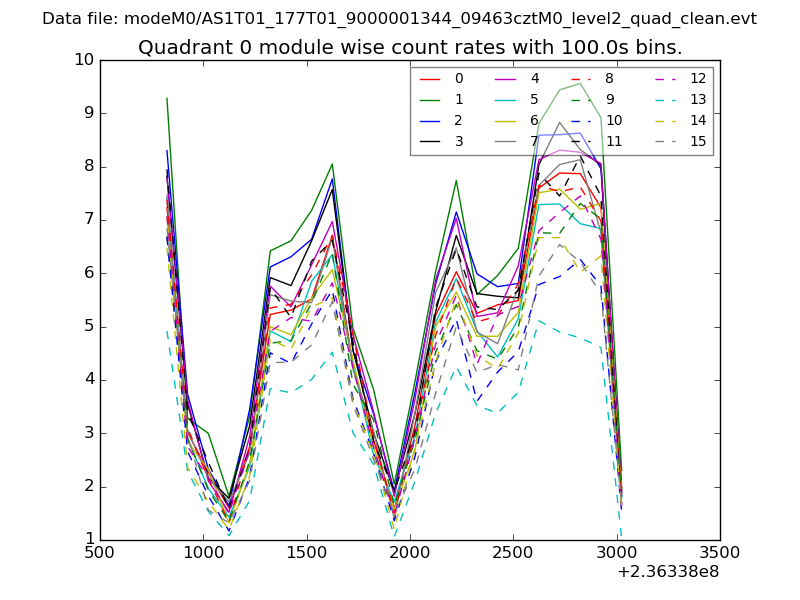 |
 |
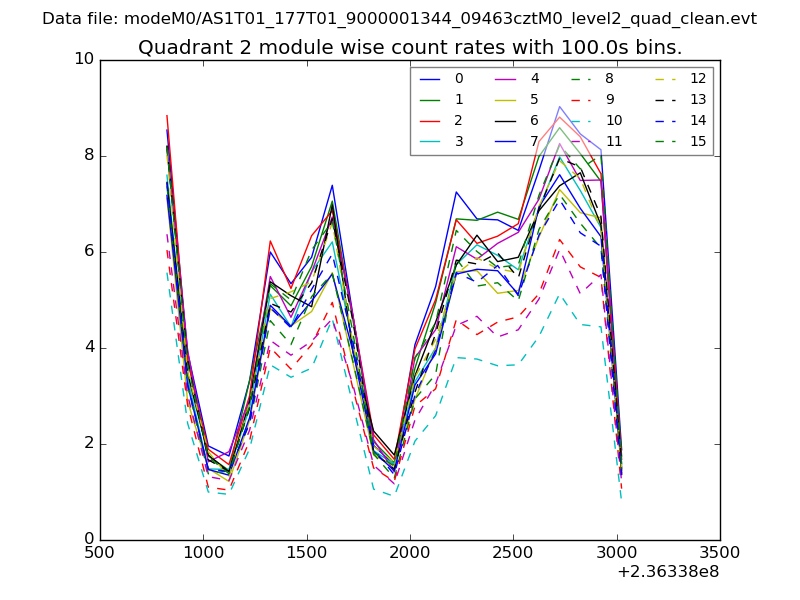
| Module-wise count rates for Quadrant B Data is divided into 100 sec bins |
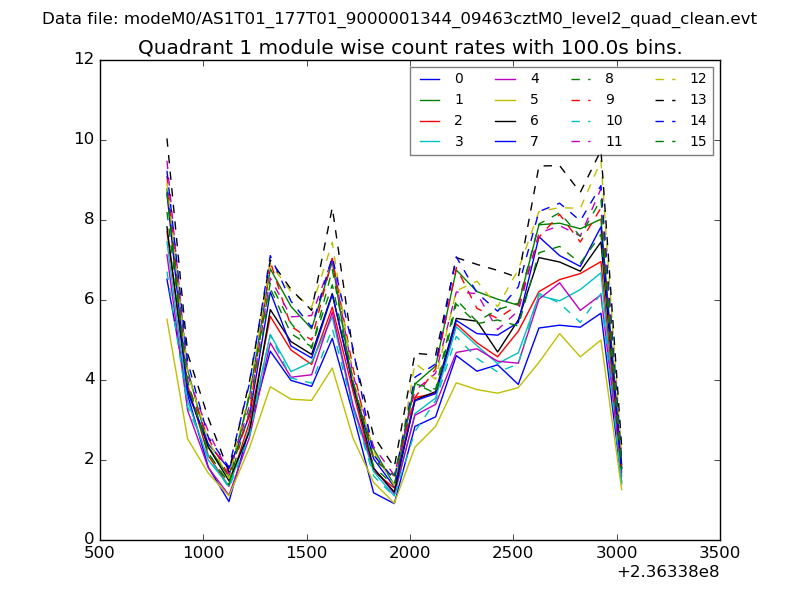 |
 |
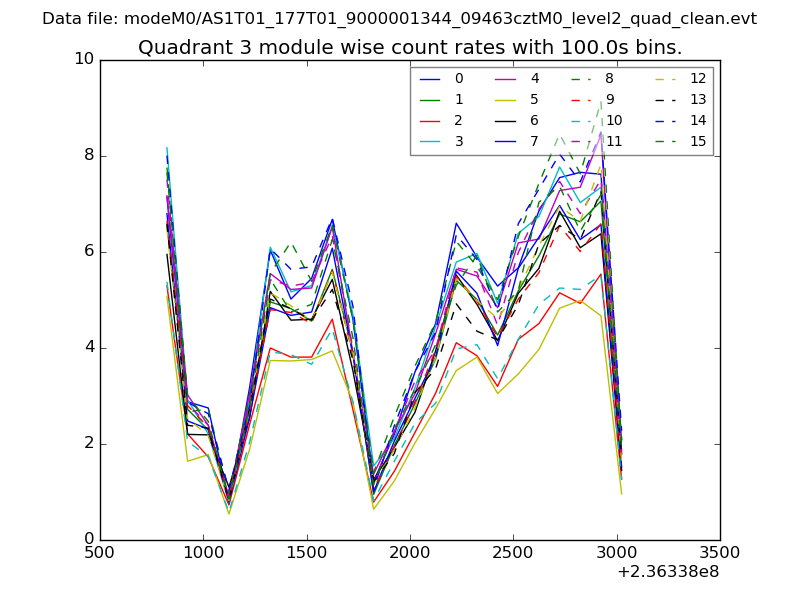
| Module-wise count rates for Quadrant C Data is divided into 100 sec bins |
 |
 |
| Module-wise count rates for Quadrant D Data is divided into 100 sec bins |
 |
 |
| Parameter | Plot |
|---|---|
| CZT HV Monitor | 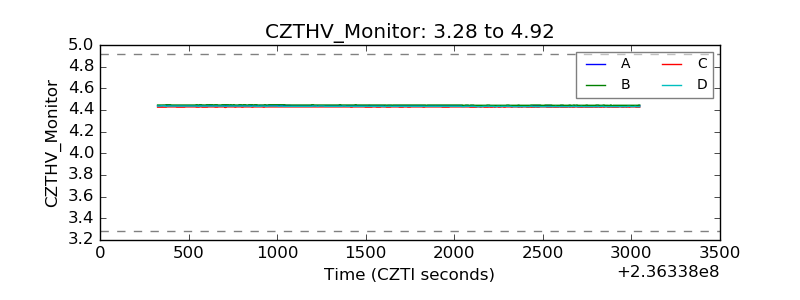 |
| D_VDD | 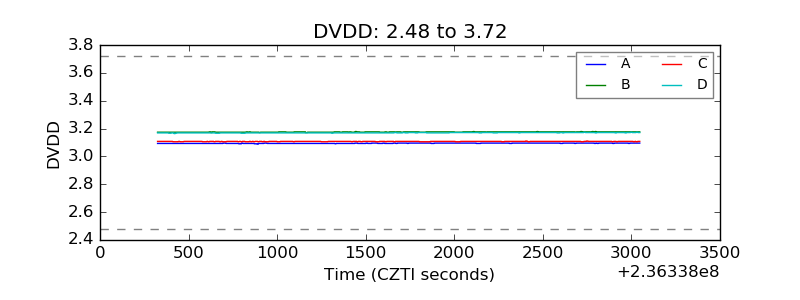 |
| Temperature 1 | 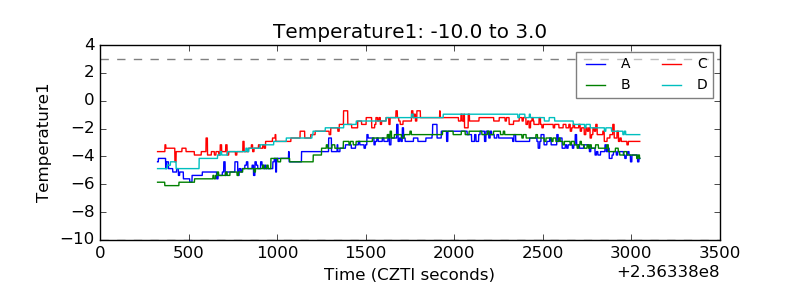 |
| Veto HV Monitor |  |
| Veto LLD | 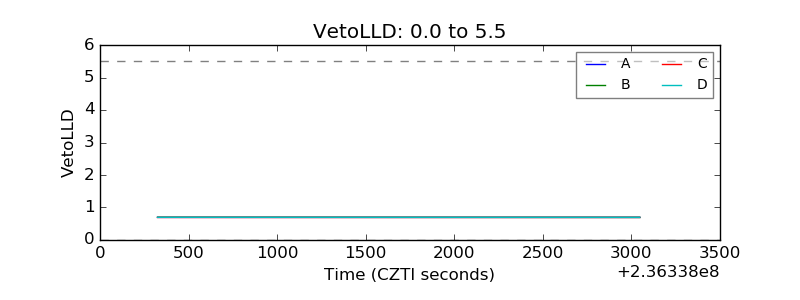 |
| Alpha Counter | 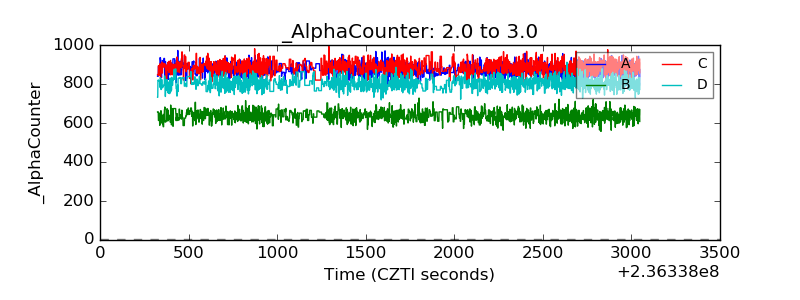 |
| _CPM_Rate | 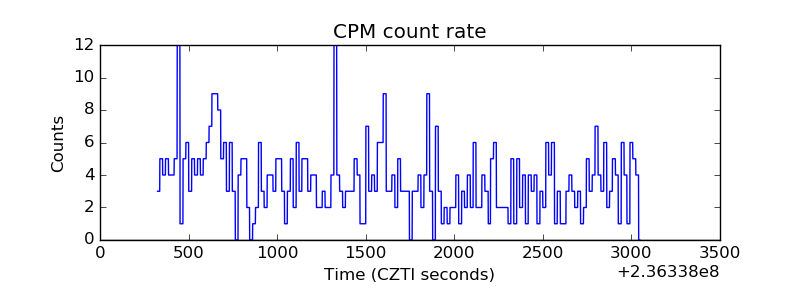 |
| CZT Counter | 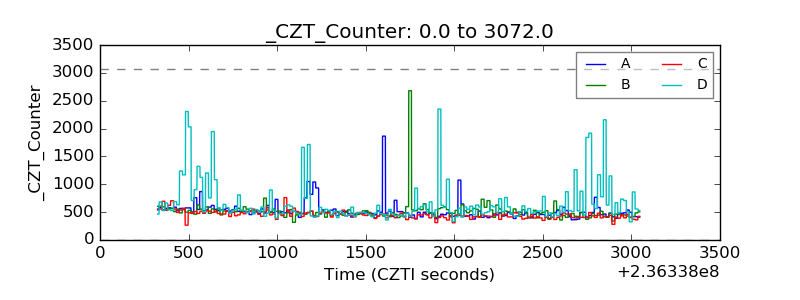 |
| +2.5 Volts monitor |  |
| +5 Volts monitor |  |
| _ROLL_ROT | 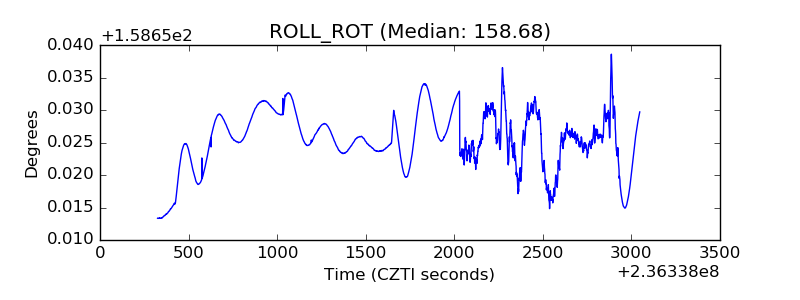 |
| _Roll_DEC | 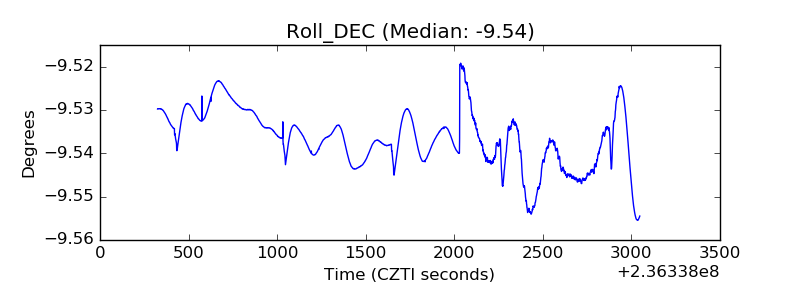 |
| _Roll_RA | 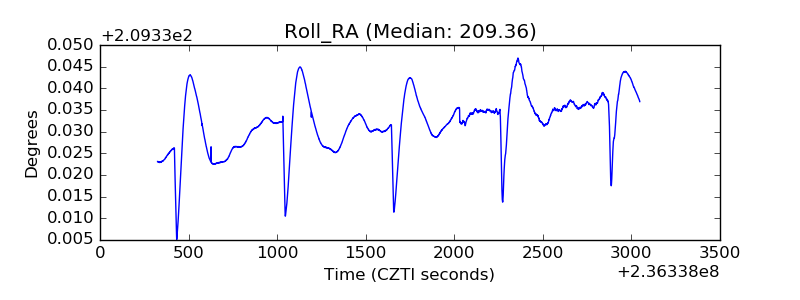 |
| Veto Counter | 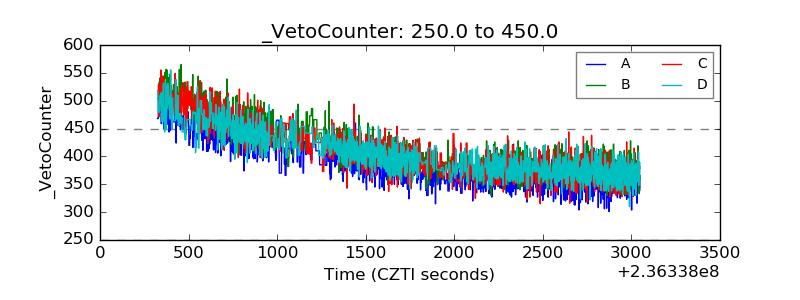 |