| Param | Original file | Final file |
|---|---|---|
| Filename | modeM0/AS1T01_177T01_9000001344_09464cztM0_level2.evt | modeM0/AS1T01_177T01_9000001344_09464cztM0_level2_quad_clean.evt |
| Size (bytes) | 197,907,840 | 43,185,600 |
| Size | 188.7 MB | 41.2 MB |
| Events in quadrant A | 1,393,727 | 284,768 |
| Events in quadrant B | 1,374,917 | 283,790 |
| Events in quadrant C | 1,230,458 | 275,832 |
| Events in quadrant D | 1,807,349 | 268,136 |
| Mode M0 | |||
|---|---|---|---|
| Quadrant | BADHDUFLAG | Total packets | Discarded packets |
| A | 0 | 5808 | 0 |
| B | 0 | 5677 | 0 |
| C | 0 | 5482 | 0 |
| D | 0 | 7093 | 0 |
| Mode SS | |||
|---|---|---|---|
| Quadrant | BADHDUFLAG | Total packets | Discarded packets |
| A | 0 | 54 | 0 |
| B | 0 | 54 | 0 |
| C | 0 | 54 | 0 |
| D | 0 | 54 | 0 |
| Quadrant | Total seconds | Saturated seconds | Saturation percentage |
|---|---|---|---|
| A | 2726 | 11 | 0.403522% |
| B | 2726 | 10 | 0.366838% |
| C | 2726 | 1 | 0.036684% |
| D | 2726 | 60 | 2.201027% |
Noise dominated data is calculated using 1-second bins in cleaned event files. If a bin has >2000 counts, and if more than 50% of those come from <1% of pixels, then it is considered to be noise-dominated and hence unusable.
| Quadrant | # 1 sec bins | Bins with >0 counts | Bins with >2000 counts | High rate bins dominated by noise | Noise dominated (total time) | Noise dominated (detector-on time) | Marked lightcurve |
|---|---|---|---|---|---|---|---|
| A | 2726 | 2726 | 3 | 3 | 0.11% | 0.11% | 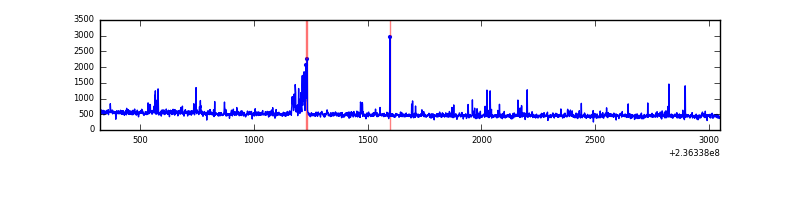 |
| B | 2726 | 2726 | 7 | 7 | 0.26% | 0.26% | 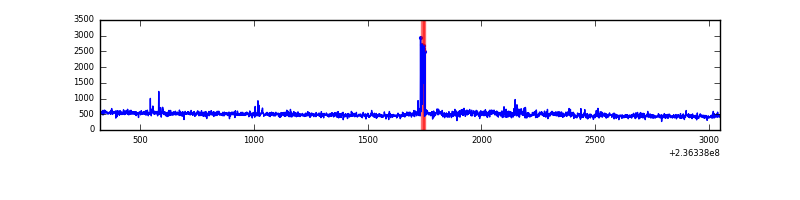 |
| C | 2726 | 2726 | 0 | 0 | 0.00% | 0.00% | 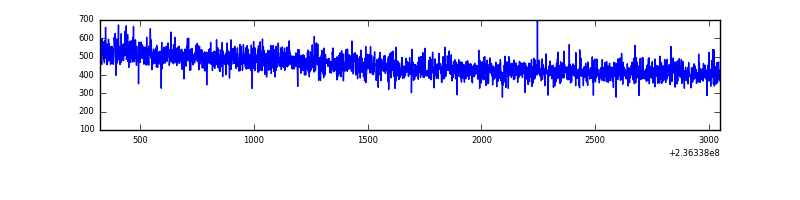 |
| D | 2726 | 2726 | 52 | 52 | 1.91% | 1.91% | 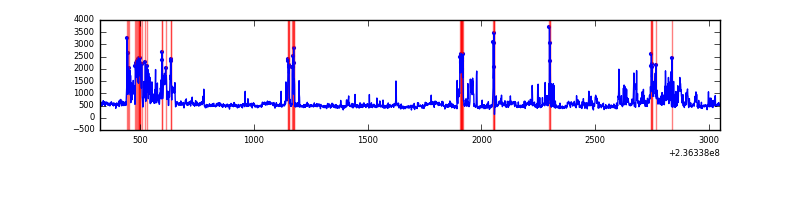 |
Top three noisy pixels from each quadrant. If the there are fewer than three noisy pixels in the level2.evt file, extra rows are filled as -1
| Pixel properties | Quadrant properties | ||||||
|---|---|---|---|---|---|---|---|
| Quadrant | DetID | PixID | Counts | Sigma | Mean | Median | Sigma |
| A | 8 | 5 | 77175 | 1116.39 | 332 | 324 | 68.8 |
| A | 15 | 14 | 18104 | 258.29 | 332 | 324 | 68.8 |
| A | 1 | 162 | 9937 | 139.65 | 332 | 324 | 68.8 |
| B | 0 | 187 | 48714 | 759.56 | 326 | 319 | 63.7 |
| B | 10 | 252 | 29072 | 451.28 | 326 | 319 | 63.7 |
| B | 0 | 214 | 21546 | 333.16 | 326 | 319 | 63.7 |
| C | 13 | 61 | 2375 | 27.97 | 315 | 316 | 73.6 |
| C | 3 | 202 | 872 | 7.55 | 315 | 316 | 73.6 |
| C | 7 | 247 | 732 | 5.65 | 315 | 316 | 73.6 |
| D | 1 | 52 | 437092 | 5561.31 | 318 | 310 | 78.5 |
| D | 13 | 104 | 114000 | 1447.55 | 318 | 310 | 78.5 |
| D | 7 | 71 | 18207 | 227.87 | 318 | 310 | 78.5 |
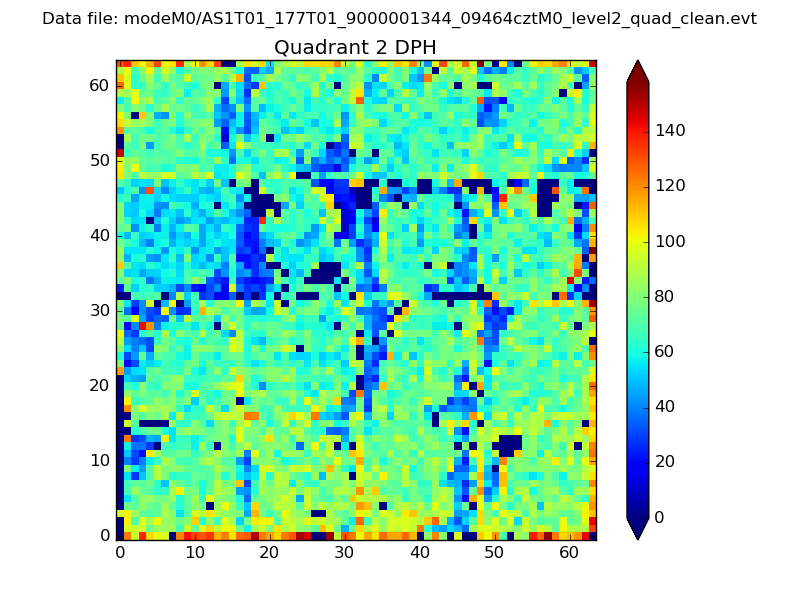
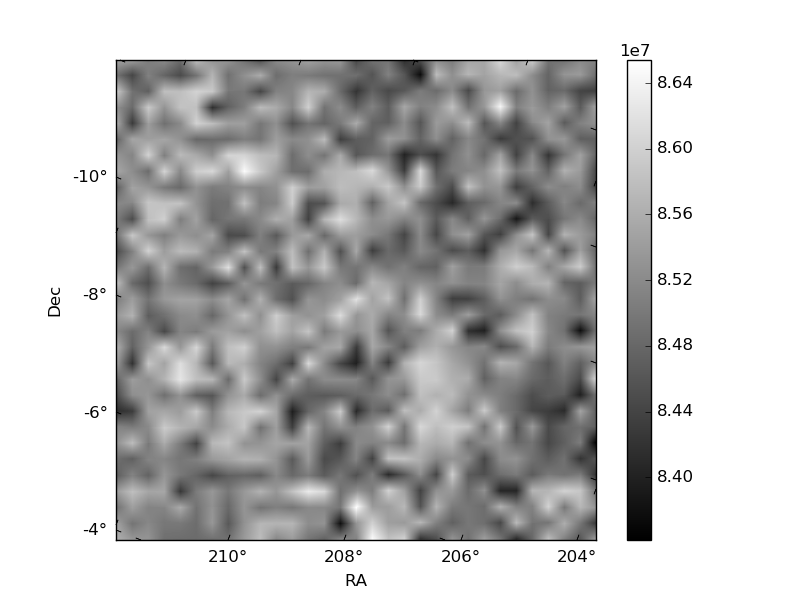
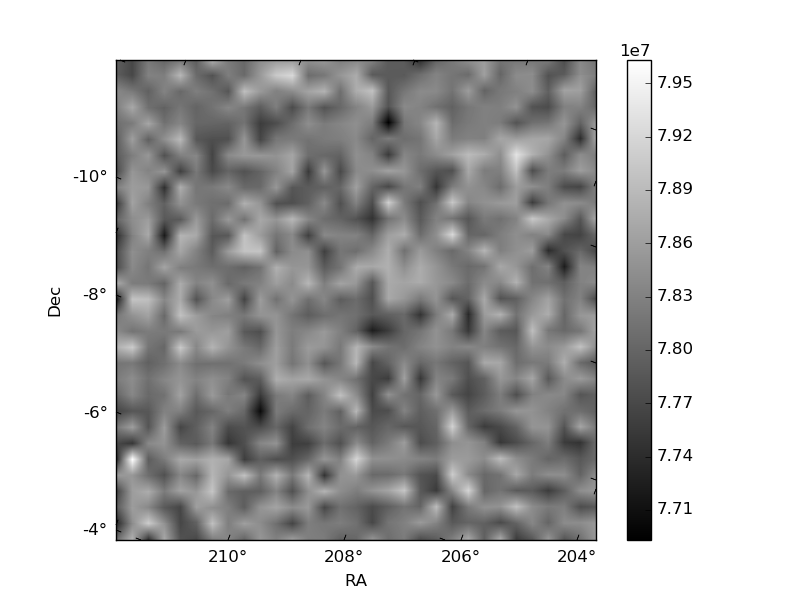
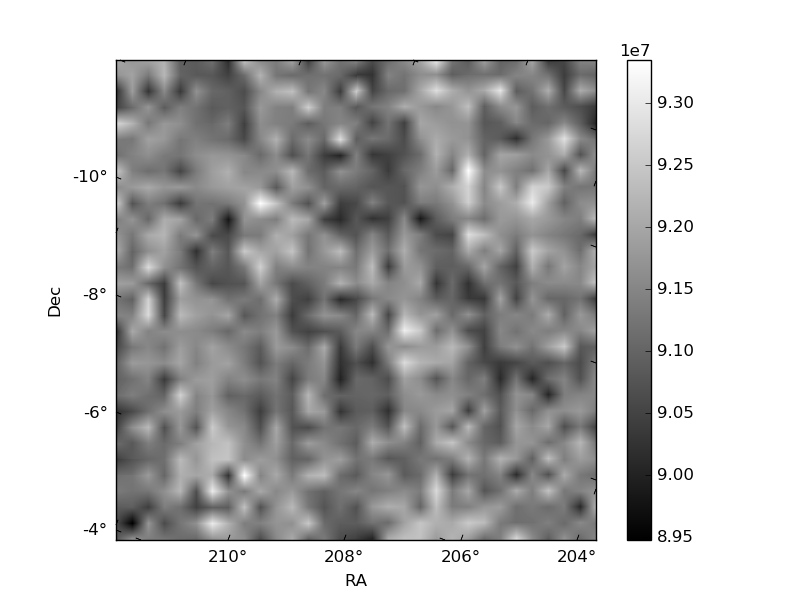
Histogram calculated using DETX and DETY for each event in the final _common_clean file
| Quadrant A | 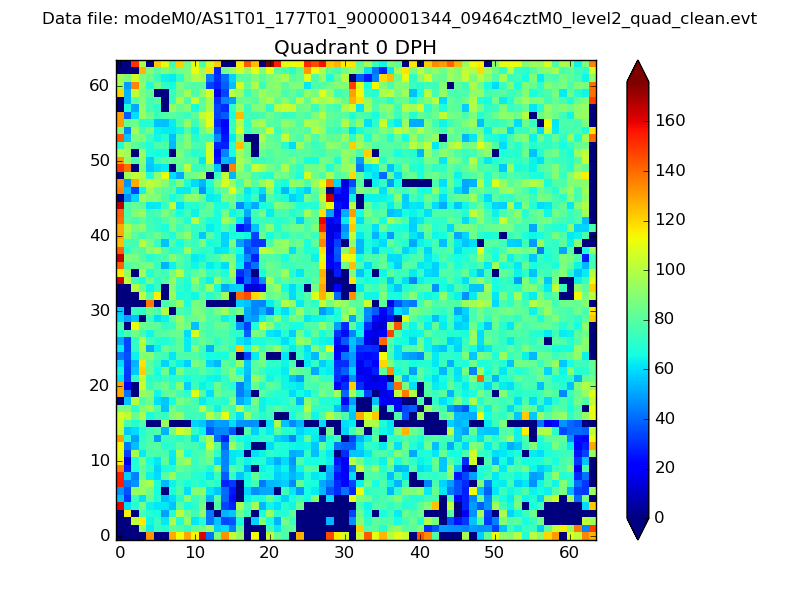 |
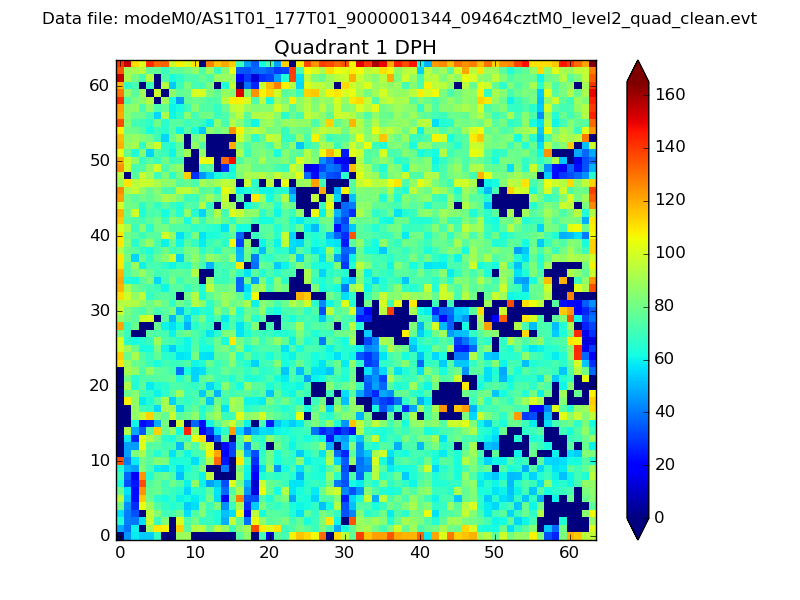 |
Quadrant B |
|---|---|---|---|
| Quadrant D | 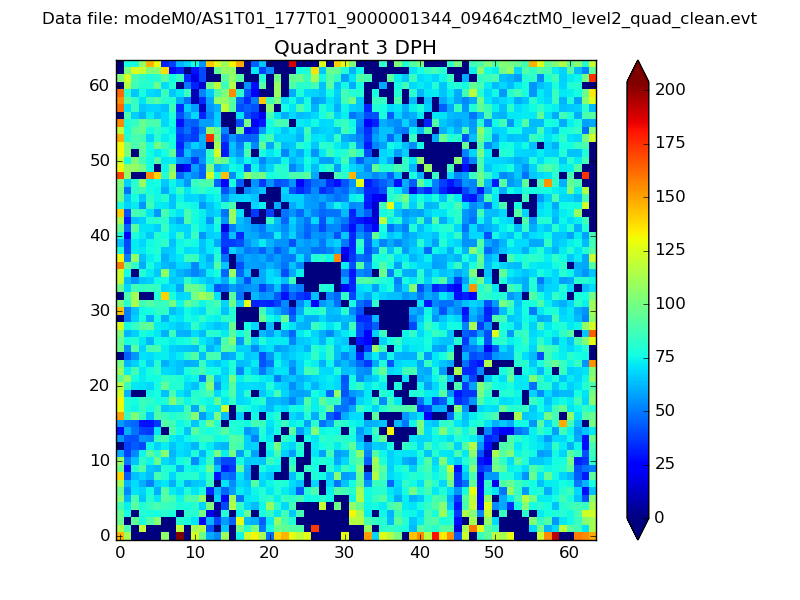 |
 |
Quadrant C |
| Plot type | Count rate plots | Images |
|---|---|---|
| Comparison with Poisson distribution Blue bars denote a histogram of data divided into 1 sec bins. Red curve is a Poisson curve with rate = median count rate of data. |
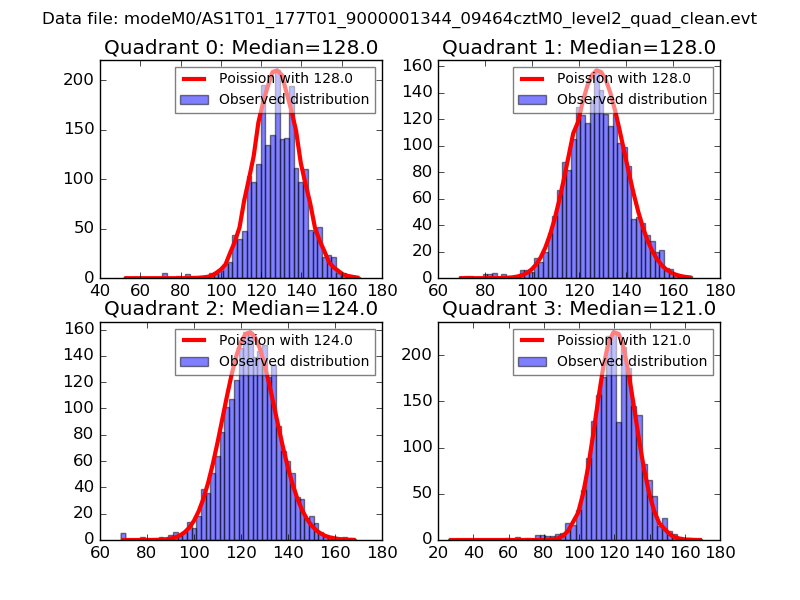 |
 |
| Quadrant-wise count rates Data is divided into 100 sec bins |
 |
|
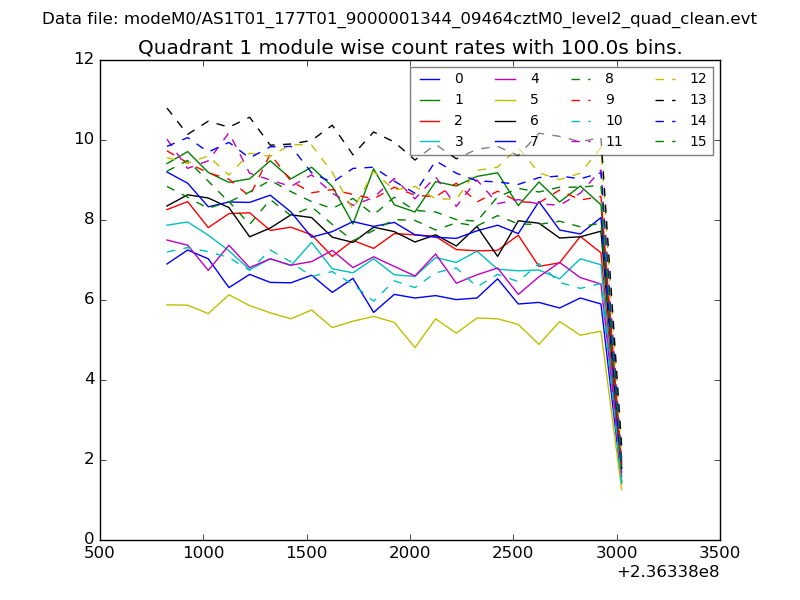
| Module-wise count rates for Quadrant A Data is divided into 100 sec bins |
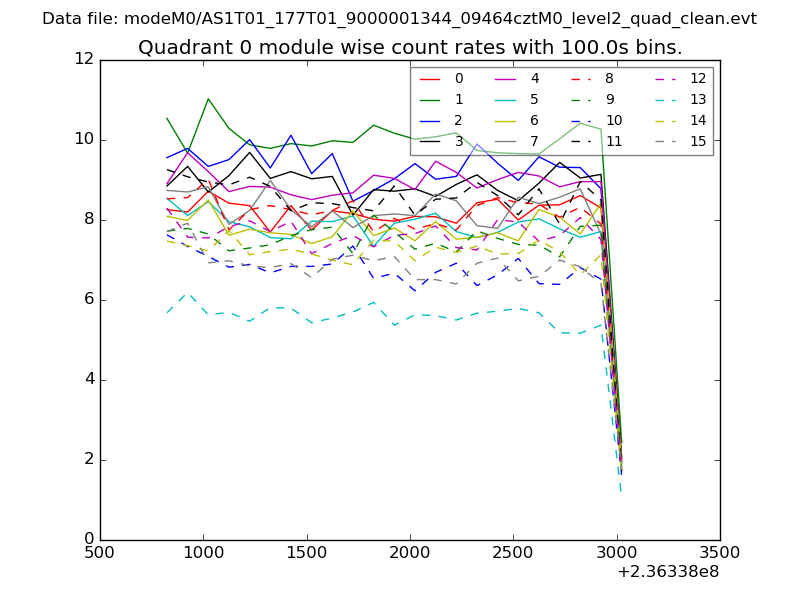 |
 |
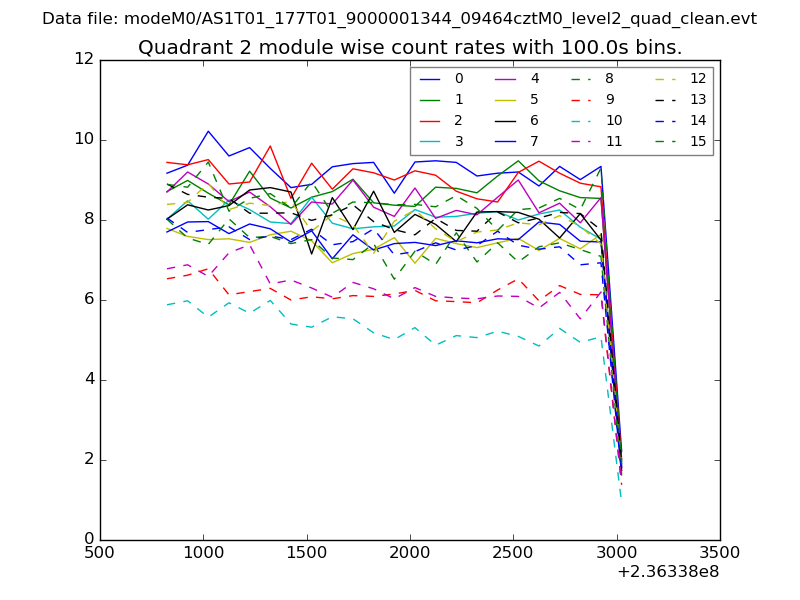
| Module-wise count rates for Quadrant B Data is divided into 100 sec bins |
 |
 |
| Module-wise count rates for Quadrant C Data is divided into 100 sec bins |
 |
 |
| Module-wise count rates for Quadrant D Data is divided into 100 sec bins |
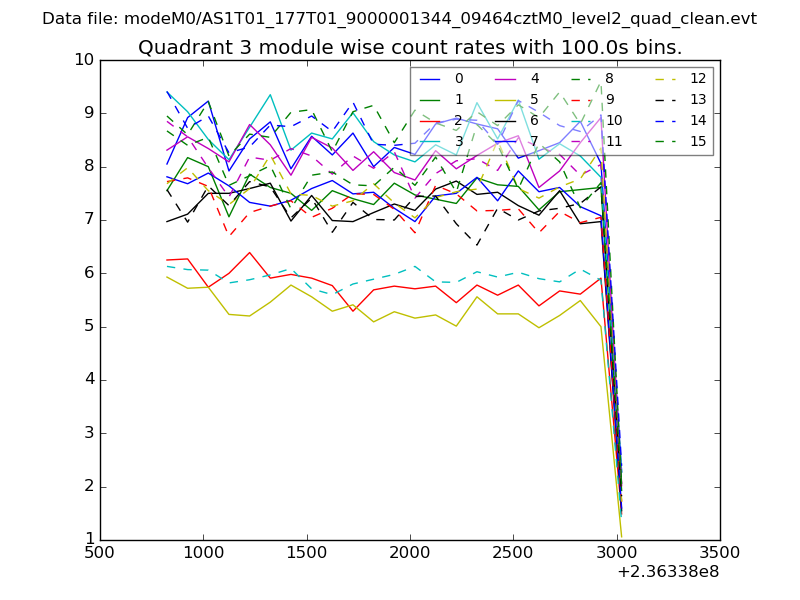 |
 |
| Parameter | Plot |
|---|---|
| CZT HV Monitor | 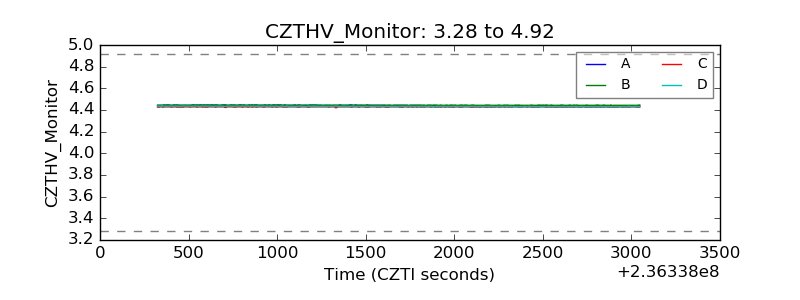 |
| D_VDD | 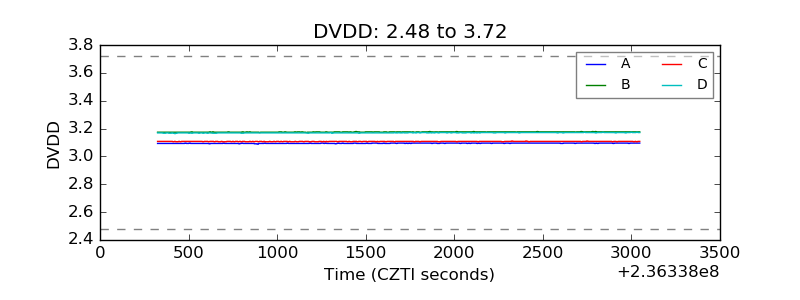 |
| Temperature 1 | 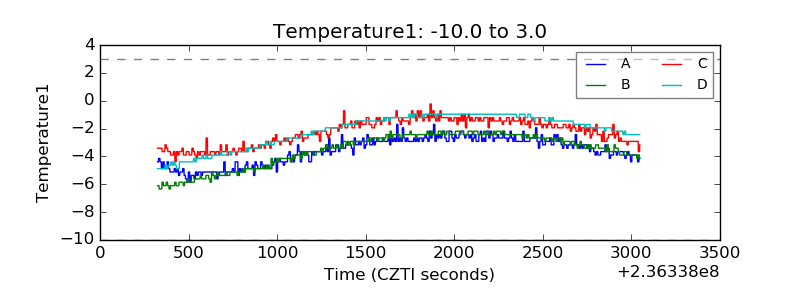 |
| Veto HV Monitor | 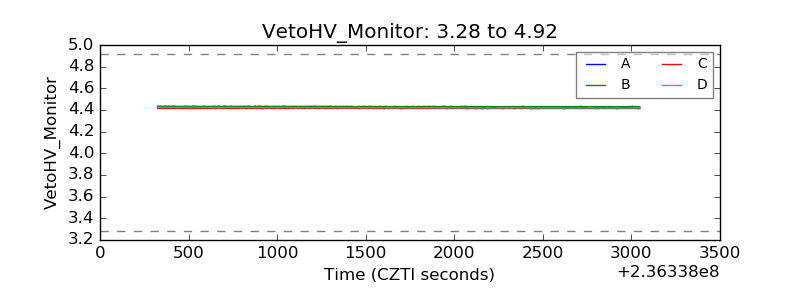 |
| Veto LLD | 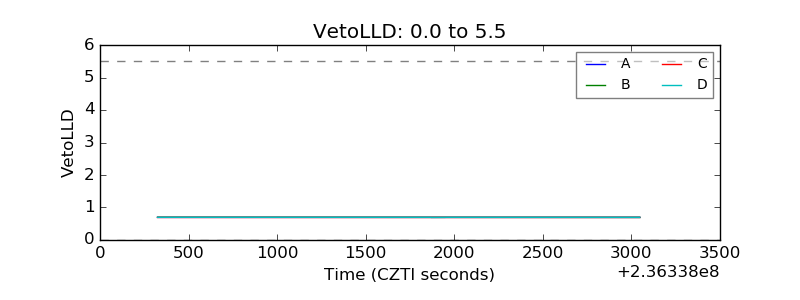 |
| Alpha Counter | 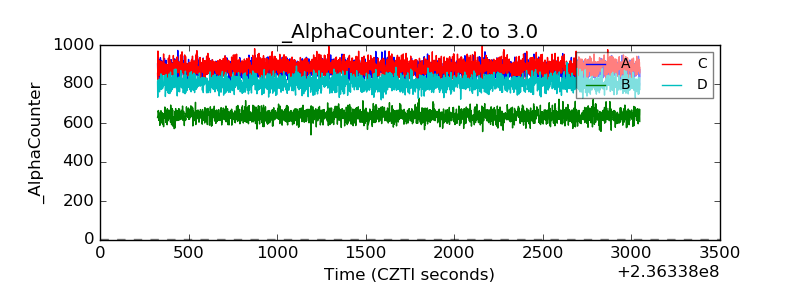 |
| _CPM_Rate | 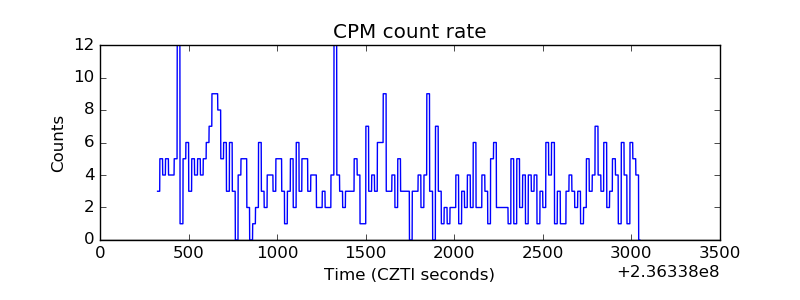 |
| CZT Counter | 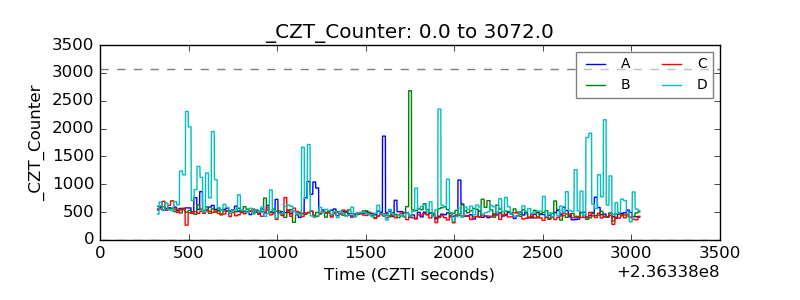 |
| +2.5 Volts monitor |  |
| +5 Volts monitor |  |
| _ROLL_ROT | 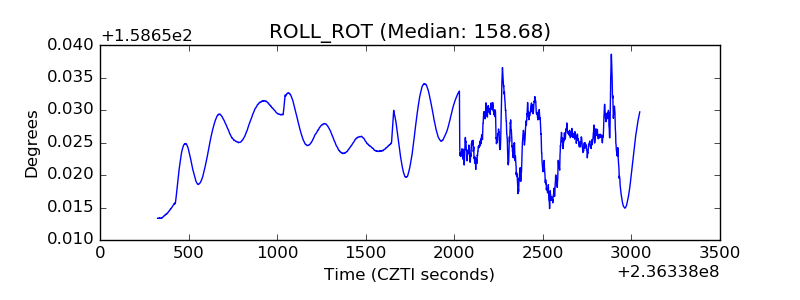 |
| _Roll_DEC | 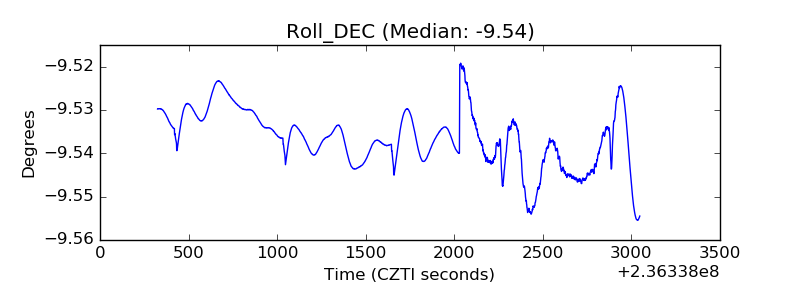 |
| _Roll_RA | 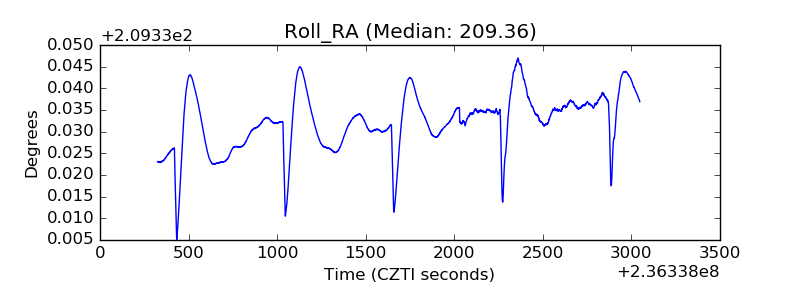 |
| Veto Counter | 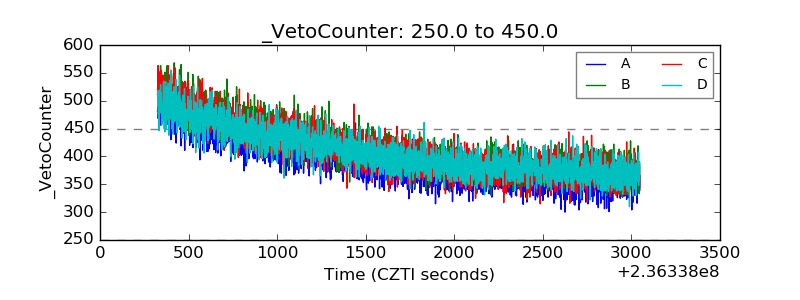 |