| Param | Original file | Final file |
|---|---|---|
| Filename | modeM0/AS1A03_051T01_9000001346cztM0_level2.fits | modeM0/AS1A03_051T01_9000001346cztM0_level2_quad_clean.evt |
| Size (bytes) | 615,360,960 | 584,856,000 |
| Size | 586.9 MB | 557.8 MB |
| Events in quadrant A | 3,731,984 | 3,489,095 |
| Events in quadrant B | 3,618,038 | 3,470,801 |
| Events in quadrant C | 3,664,246 | 3,299,428 |
| Events in quadrant D | 3,126,293 | 2,964,165 |
| Mode M0 | |||
|---|---|---|---|
| Quadrant | BADHDUFLAG | Total packets | Discarded packets |
| A | 0 | 159671 | 0 |
| B | 0 | 137904 | 0 |
| C | 0 | 136071 | 0 |
| D | 0 | 173101 | 0 |
| Mode M9 | |||
|---|---|---|---|
| Quadrant | BADHDUFLAG | Total packets | Discarded packets |
| A | 0 | 119 | 0 |
| B | 0 | 121 | 0 |
| C | 0 | 124 | 0 |
| D | 0 | 120 | 0 |
| Mode SS | |||
|---|---|---|---|
| Quadrant | BADHDUFLAG | Total packets | Discarded packets |
| A | 0 | 1347 | 0 |
| B | 0 | 1349 | 0 |
| C | 0 | 1354 | 0 |
| D | 0 | 1377 | 0 |
| Quadrant | Total seconds | Saturated seconds | Saturation percentage |
|---|---|---|---|
| A | 64820 | 1216 | 1.875964% |
| B | 65653 | 719 | 1.095152% |
| C | 65778 | 444 | 0.674998% |
| D | 65071 | 2925 | 4.495090% |
Noise dominated data is calculated using 1-second bins in cleaned event files. If a bin has >2000 counts, and if more than 50% of those come from <1% of pixels, then it is considered to be noise-dominated and hence unusable.
| Quadrant | # 1 sec bins | Bins with >0 counts | Bins with >2000 counts | High rate bins dominated by noise | Noise dominated (total time) | Noise dominated (detector-on time) | Marked lightcurve |
|---|---|---|---|---|---|---|---|
| A | 93178 | 69159 | 0 | 0 | 0.00% | 0.00% | 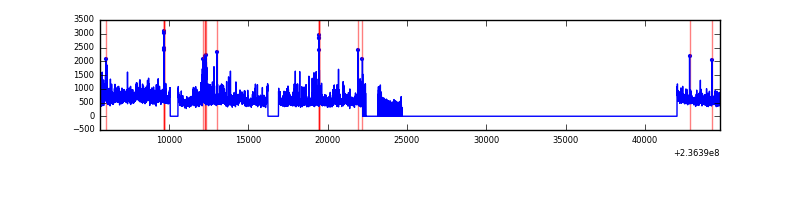 |
| B | 93178 | 70016 | 0 | 0 | 0.00% | 0.00% | 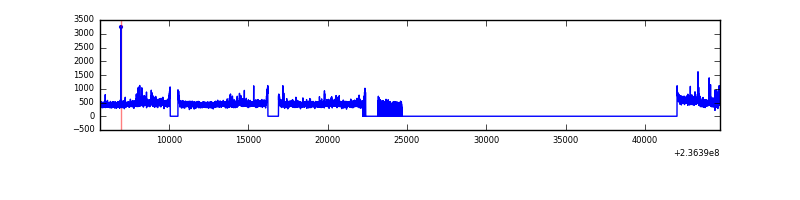 |
| C | 93178 | 70172 | 0 | 0 | 0.00% | 0.00% | 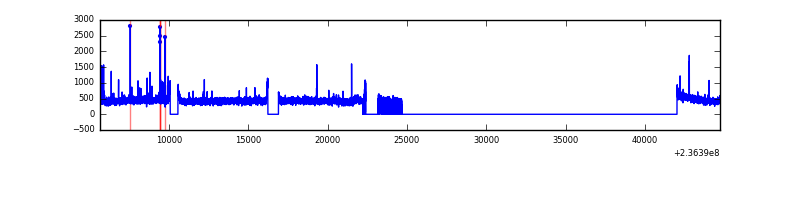 |
| D | 93178 | 69213 | 0 | 0 | 0.00% | 0.00% | 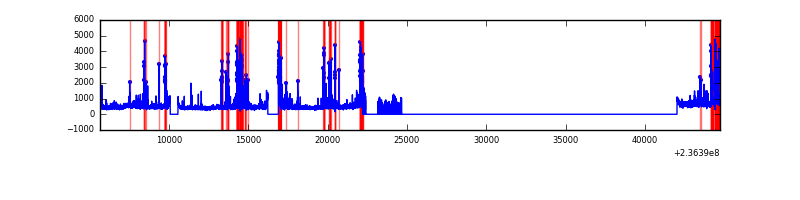 |
Top three noisy pixels from each quadrant. If the there are fewer than three noisy pixels in the level2.evt file, extra rows are filled as -1
| Pixel properties | Quadrant properties | ||||||
|---|---|---|---|---|---|---|---|
| Quadrant | DetID | PixID | Counts | Sigma | Mean | Median | Sigma |
| A | 14 | 188 | 3765 | 11.73 | 968 | 908 | 243.5 |
| A | 0 | 29 | 3659 | 11.3 | 968 | 908 | 243.5 |
| A | 14 | 204 | 3096 | 8.98 | 968 | 908 | 243.5 |
| B | 2 | 9 | 3151 | 11.86 | 955 | 910 | 189.0 |
| B | 14 | 254 | 2500 | 8.41 | 955 | 910 | 189.0 |
| B | 12 | 226 | 2456 | 8.18 | 955 | 910 | 189.0 |
| C | 12 | 241 | 2422 | 6.05 | 969 | 901 | 251.6 |
| C | 2 | 191 | 2396 | 5.94 | 969 | 901 | 251.6 |
| C | 3 | 126 | 2386 | 5.9 | 969 | 901 | 251.6 |
| D | 6 | 231 | 2281 | 6.2 | 891 | 812 | 237.0 |
| D | 7 | 5 | 2260 | 6.11 | 891 | 812 | 237.0 |
| D | 1 | 19 | 2242 | 6.03 | 891 | 812 | 237.0 |
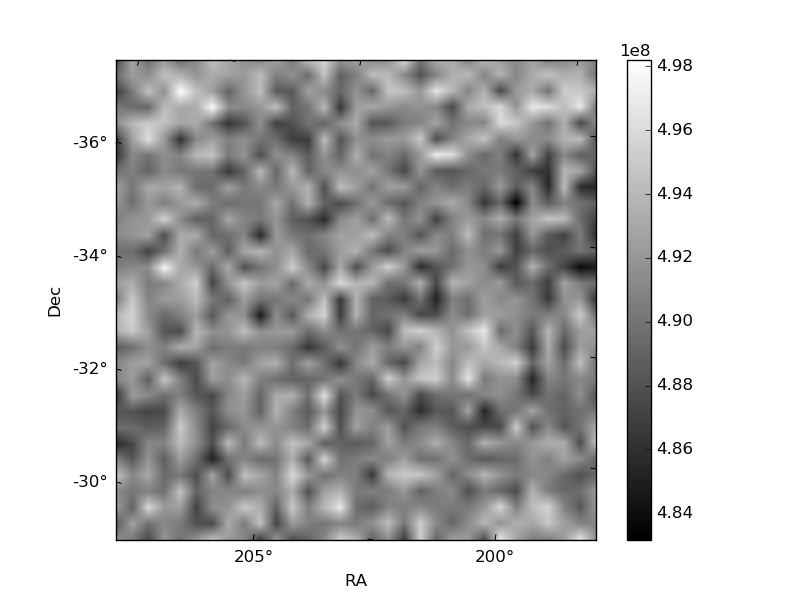
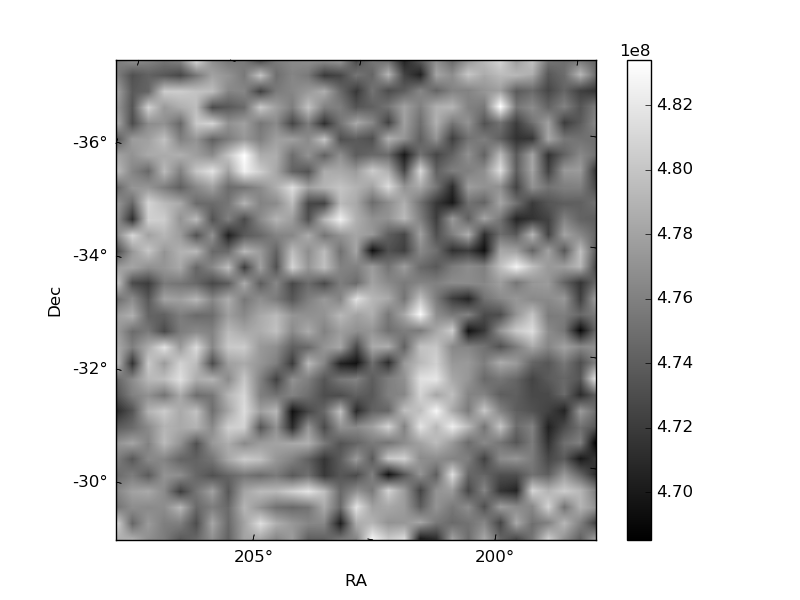
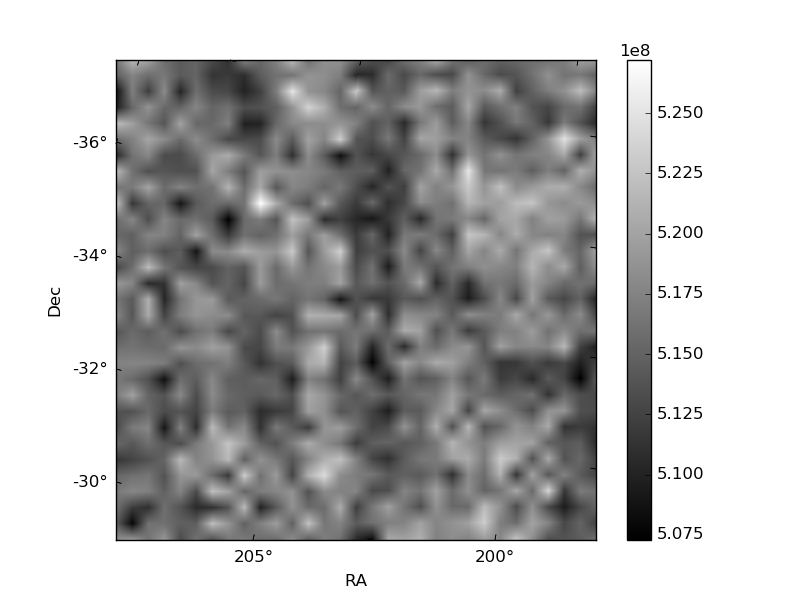
Histogram calculated using DETX and DETY for each event in the final _common_clean file
| Quadrant A | 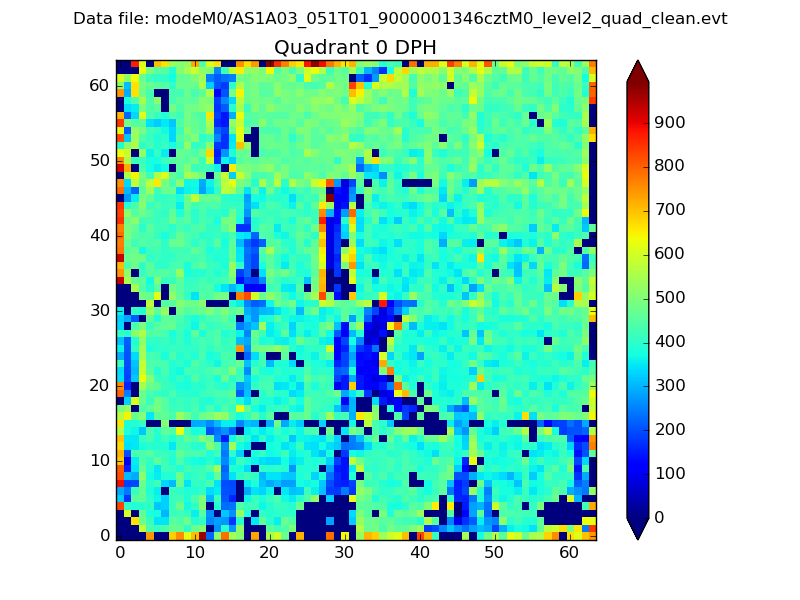 |
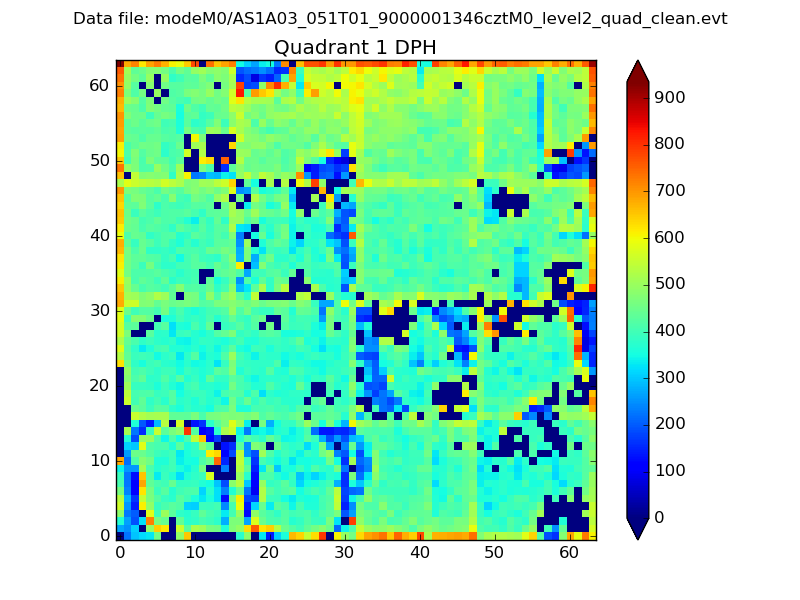 |
Quadrant B |
|---|---|---|---|
| Quadrant D | 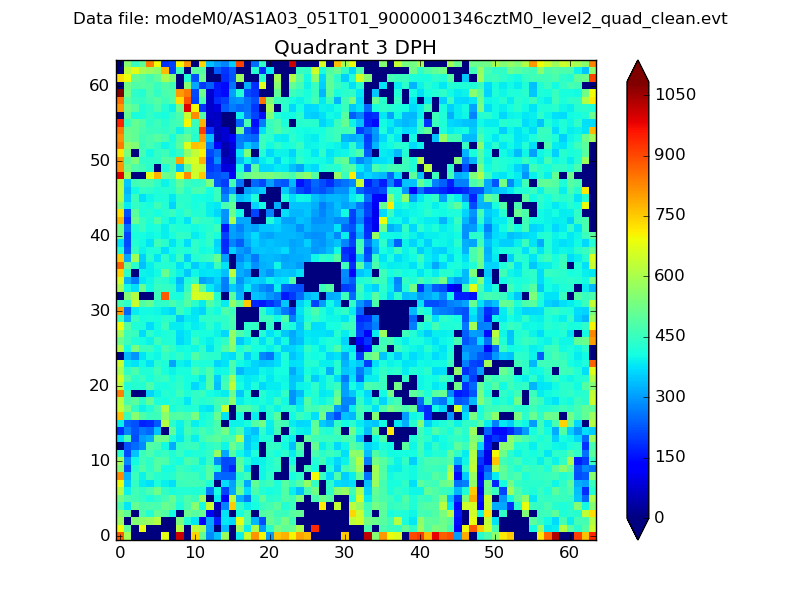 |
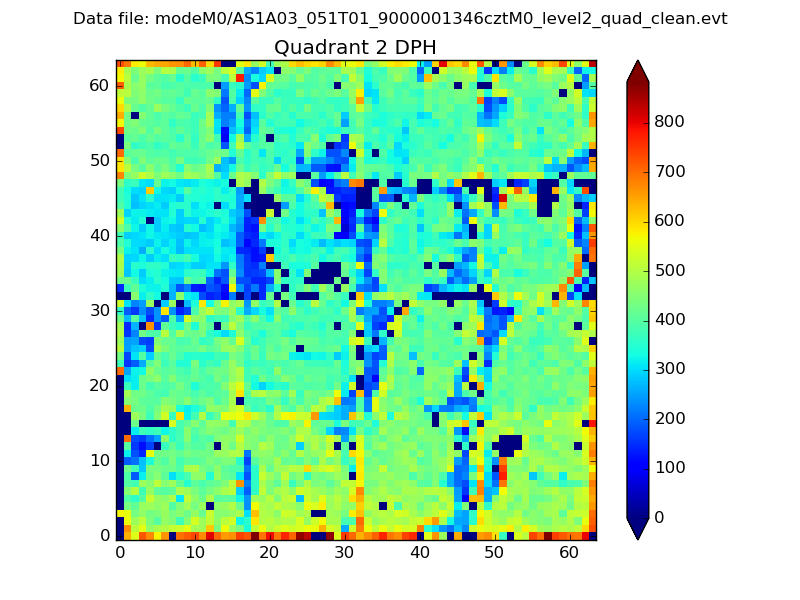 |
Quadrant C |
| Plot type | Count rate plots | Images |
|---|---|---|
| Comparison with Poisson distribution Blue bars denote a histogram of data divided into 1 sec bins. Red curve is a Poisson curve with rate = median count rate of data. |
 |
 |
| Quadrant-wise count rates Data is divided into 100 sec bins |
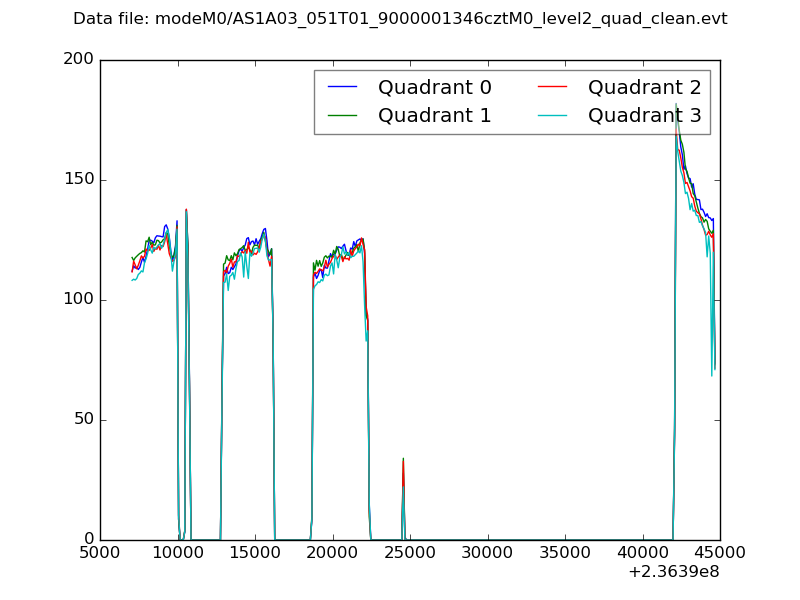 |
|
| Module-wise count rates for Quadrant A Data is divided into 100 sec bins |
 |
 |
| Module-wise count rates for Quadrant B Data is divided into 100 sec bins |
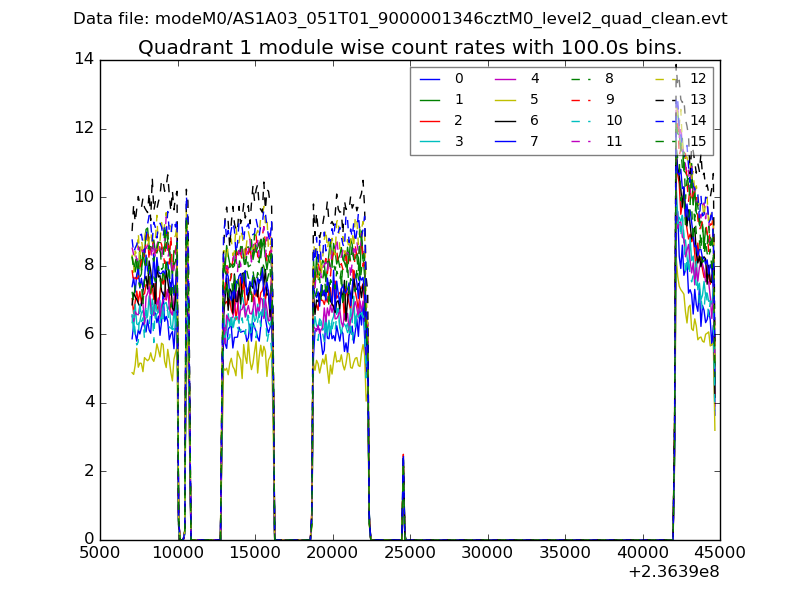 |
 |
| Module-wise count rates for Quadrant C Data is divided into 100 sec bins |
 |
 |
| Module-wise count rates for Quadrant D Data is divided into 100 sec bins |
 |
 |
| Parameter | Plot |
|---|---|
| CZT HV Monitor |  |
| D_VDD | 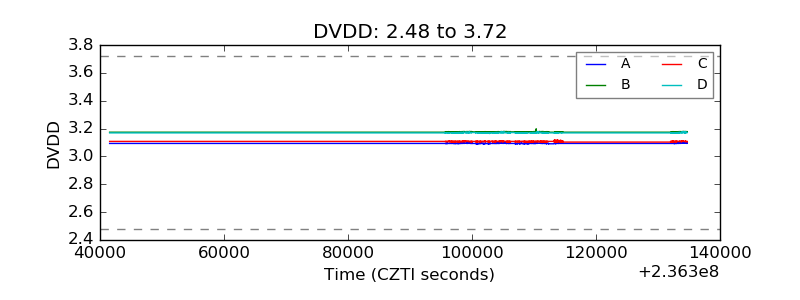 |
| Temperature 1 |  |
| Veto HV Monitor | 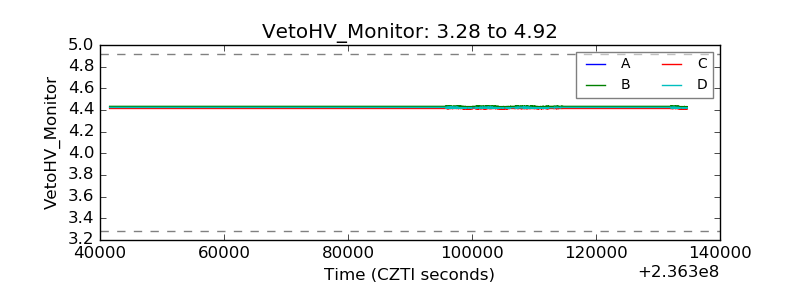 |
| Veto LLD | 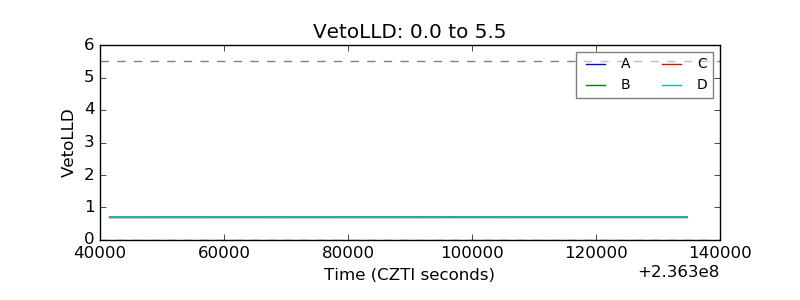 |
| Alpha Counter |  |
| _CPM_Rate |  |
| CZT Counter |  |
| +2.5 Volts monitor | 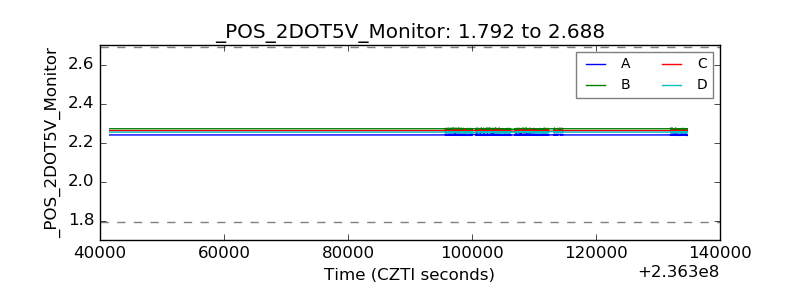 |
| +5 Volts monitor | 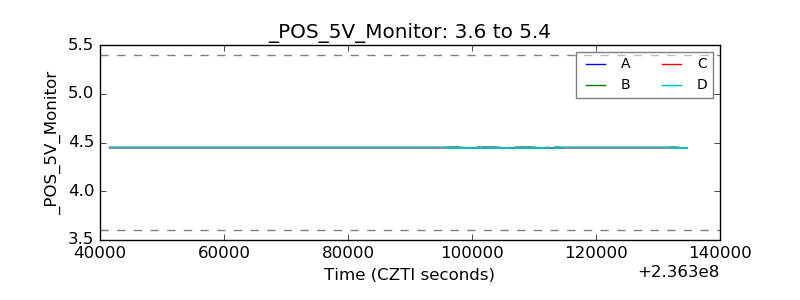 |
| _ROLL_ROT | 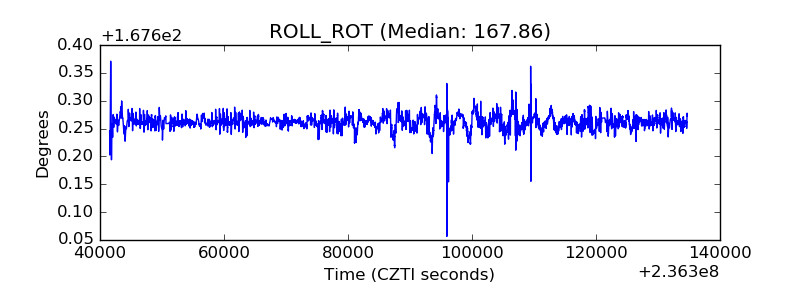 |
| _Roll_DEC | 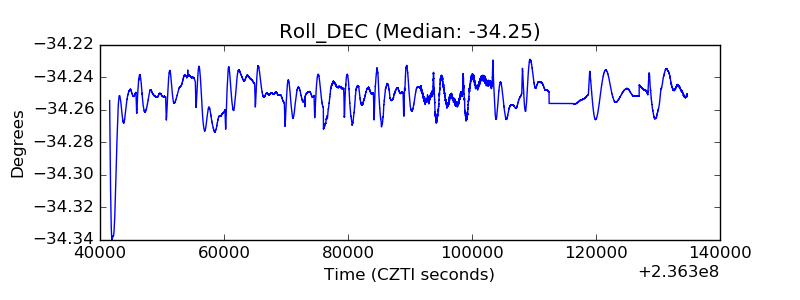 |
| _Roll_RA | 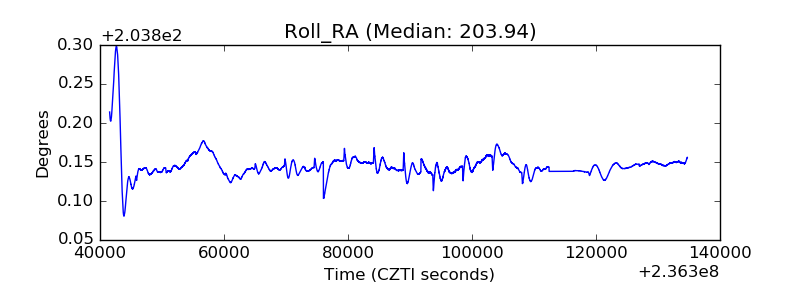 |
| Veto Counter |  |