| Param | Original file | Final file |
|---|---|---|
| Filename | modeM0/AS1A03_051T01_9000001346_09463cztM0_level2.evt | modeM0/AS1A03_051T01_9000001346_09463cztM0_level2_quad_clean.evt |
| Size (bytes) | 175,628,160 | 35,046,720 |
| Size | 167.5 MB | 33.4 MB |
| Events in quadrant A | 1,295,492 | 225,481 |
| Events in quadrant B | 1,240,313 | 227,896 |
| Events in quadrant C | 1,201,773 | 224,563 |
| Events in quadrant D | 1,416,471 | 211,280 |
| Mode M0 | |||
|---|---|---|---|
| Quadrant | BADHDUFLAG | Total packets | Discarded packets |
| A | 0 | 6529 | 1228 |
| B | 0 | 6306 | 1068 |
| C | 0 | 6176 | 1029 |
| D | 0 | 7161 | 1411 |
| Mode M9 | |||
|---|---|---|---|
| Quadrant | BADHDUFLAG | Total packets | Discarded packets |
| A | 0 | 12 | 1 |
| B | 0 | 12 | 0 |
| C | 0 | 12 | 0 |
| D | 0 | 12 | 2 |
| Mode SS | |||
|---|---|---|---|
| Quadrant | BADHDUFLAG | Total packets | Discarded packets |
| A | 0 | 58 | 16 |
| B | 0 | 58 | 12 |
| C | 0 | 58 | 14 |
| D | 0 | 58 | 14 |
| Quadrant | Total seconds | Saturated seconds | Saturation percentage |
|---|---|---|---|
| A | 2378 | 46 | 1.934399% |
| B | 2404 | 42 | 1.747088% |
| C | 2416 | 24 | 0.993377% |
| D | 2378 | 75 | 3.153911% |
Noise dominated data is calculated using 1-second bins in cleaned event files. If a bin has >2000 counts, and if more than 50% of those come from <1% of pixels, then it is considered to be noise-dominated and hence unusable.
| Quadrant | # 1 sec bins | Bins with >0 counts | Bins with >2000 counts | High rate bins dominated by noise | Noise dominated (total time) | Noise dominated (detector-on time) | Marked lightcurve |
|---|---|---|---|---|---|---|---|
| A | 4029 | 2738 | 0 | 0 | 0.00% | 0.00% | 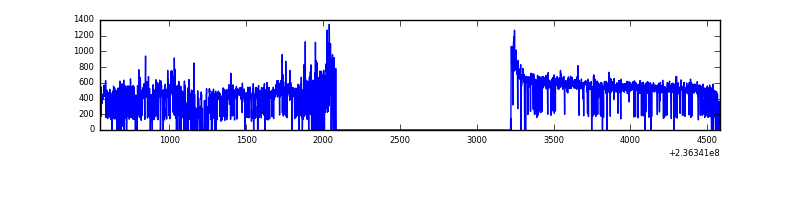 |
| B | 4033 | 2747 | 0 | 0 | 0.00% | 0.00% | 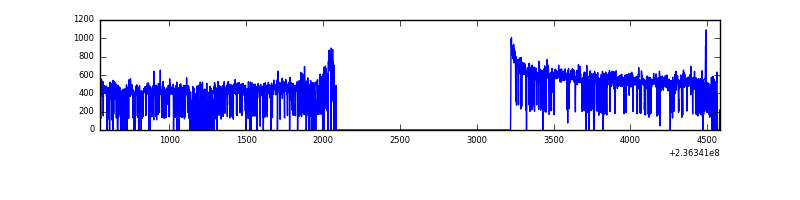 |
| C | 4031 | 2754 | 0 | 0 | 0.00% | 0.00% | 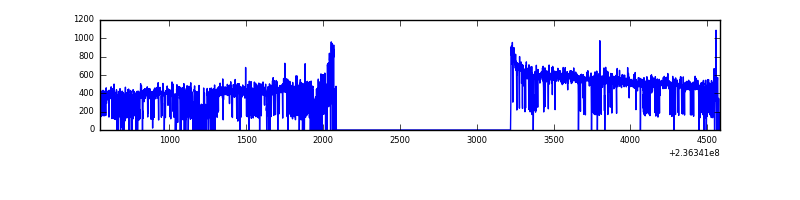 |
| D | 4027 | 2749 | 27 | 27 | 0.67% | 0.98% | 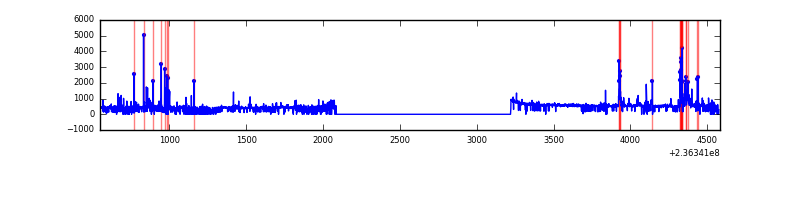 |
Top three noisy pixels from each quadrant. If the there are fewer than three noisy pixels in the level2.evt file, extra rows are filled as -1
| Pixel properties | Quadrant properties | ||||||
|---|---|---|---|---|---|---|---|
| Quadrant | DetID | PixID | Counts | Sigma | Mean | Median | Sigma |
| A | 8 | 5 | 27823 | 425.69 | 314 | 307 | 64.6 |
| A | 1 | 162 | 19523 | 297.28 | 314 | 307 | 64.6 |
| A | 8 | 15 | 14466 | 219.05 | 314 | 307 | 64.6 |
| B | 12 | 111 | 6725 | 104.19 | 315 | 308 | 61.6 |
| B | 11 | 111 | 5365 | 82.11 | 315 | 308 | 61.6 |
| B | 0 | 187 | 4495 | 67.98 | 315 | 308 | 61.6 |
| C | 5 | 128 | 2366 | 28.31 | 307 | 308 | 72.7 |
| C | 13 | 61 | 2242 | 26.61 | 307 | 308 | 72.7 |
| C | 14 | 234 | 998 | 9.49 | 307 | 308 | 72.7 |
| D | 13 | 104 | 122074 | 1612.09 | 301 | 292 | 75.5 |
| D | 12 | 233 | 75567 | 996.45 | 301 | 292 | 75.5 |
| D | 1 | 52 | 36208 | 475.44 | 301 | 292 | 75.5 |
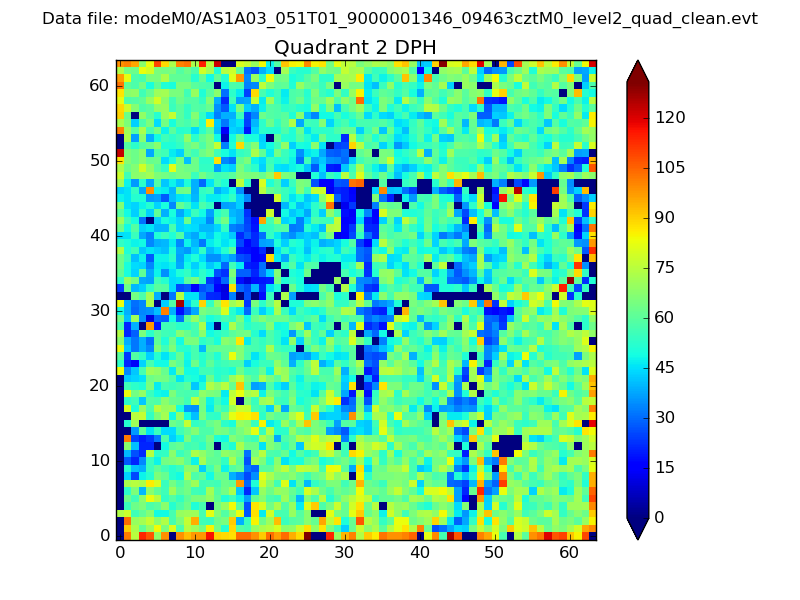
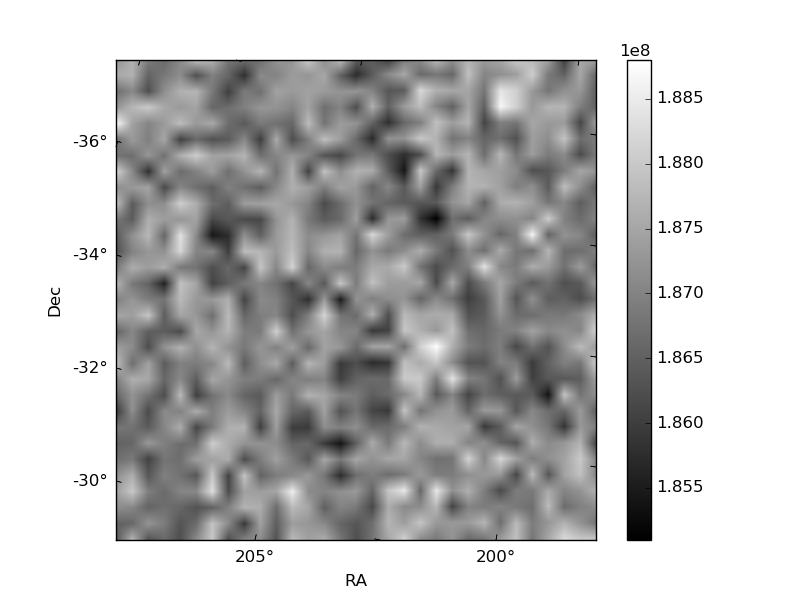
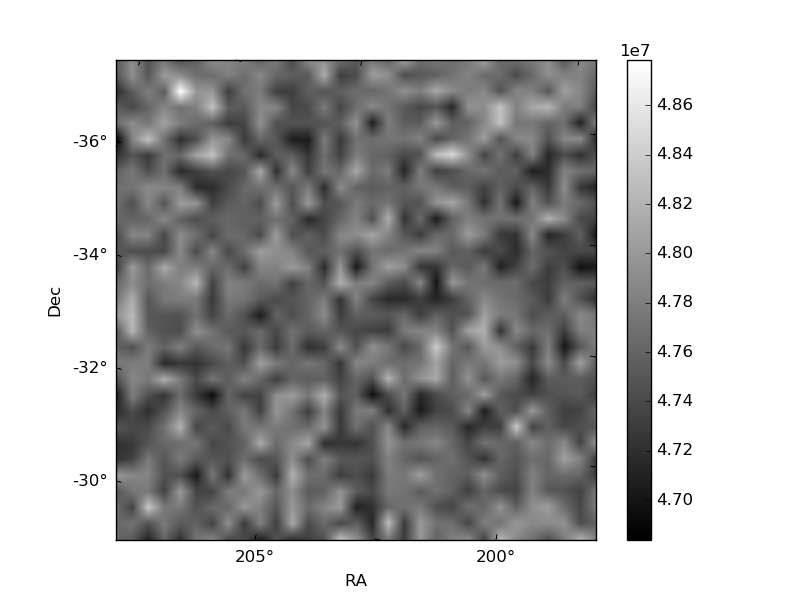
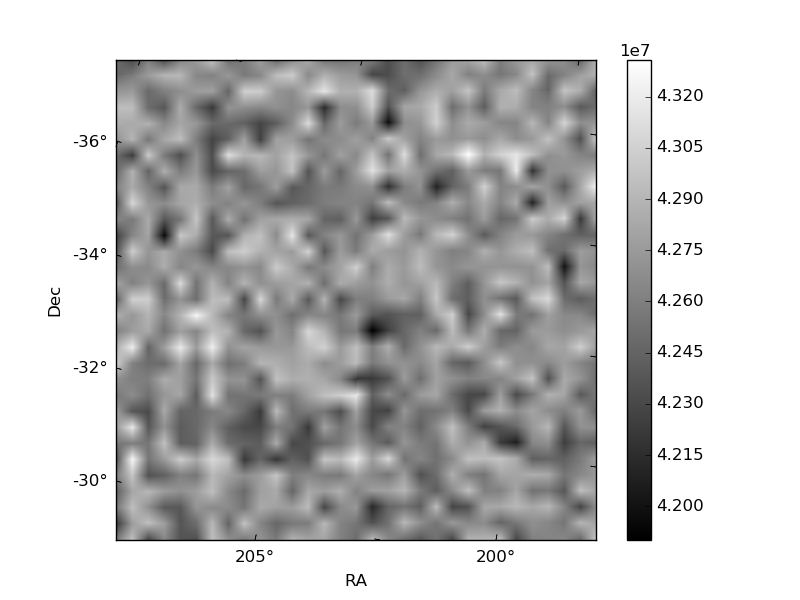
Histogram calculated using DETX and DETY for each event in the final _common_clean file
| Quadrant A | 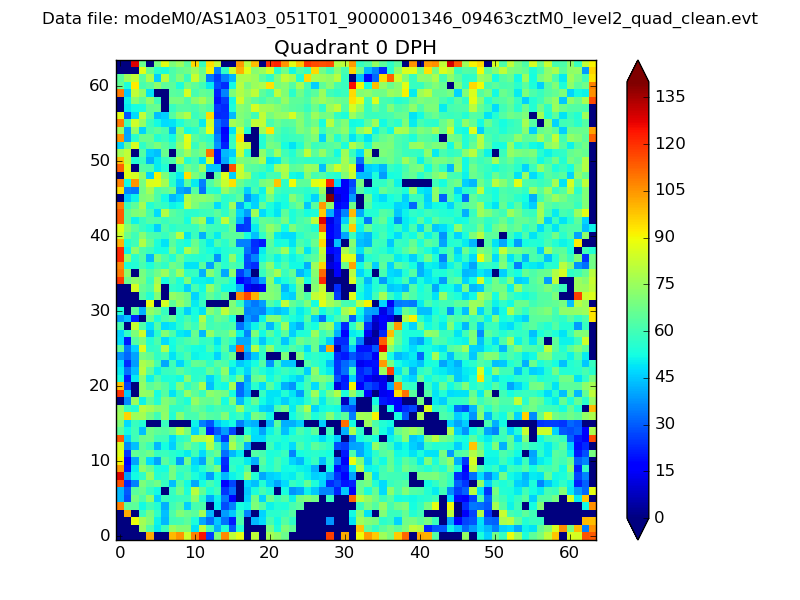 |
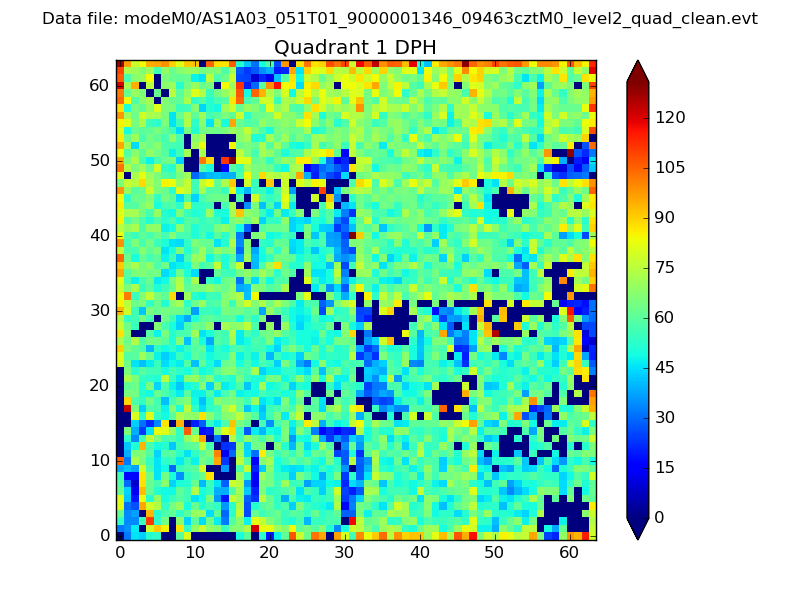 |
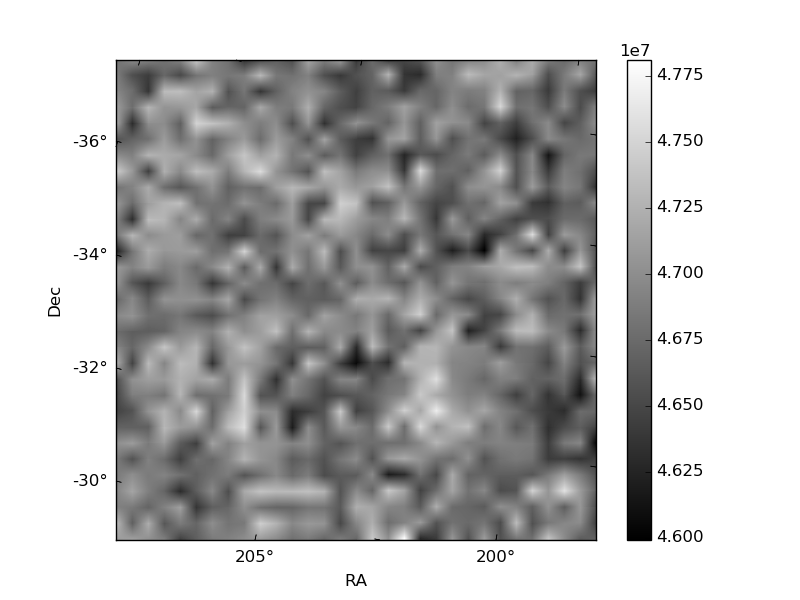
Quadrant B |
|---|---|---|---|
| Quadrant D | 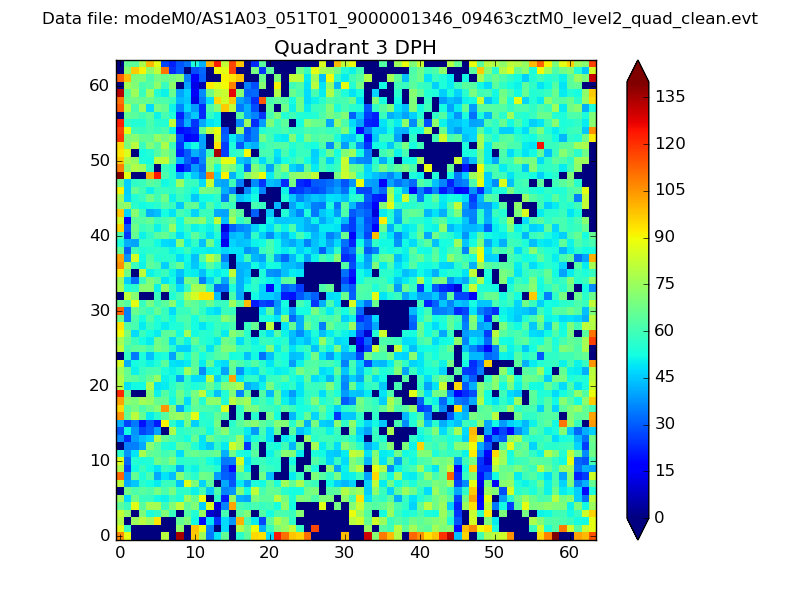 |
 |
Quadrant C |
| Plot type | Count rate plots | Images |
|---|---|---|
| Comparison with Poisson distribution Blue bars denote a histogram of data divided into 1 sec bins. Red curve is a Poisson curve with rate = median count rate of data. |
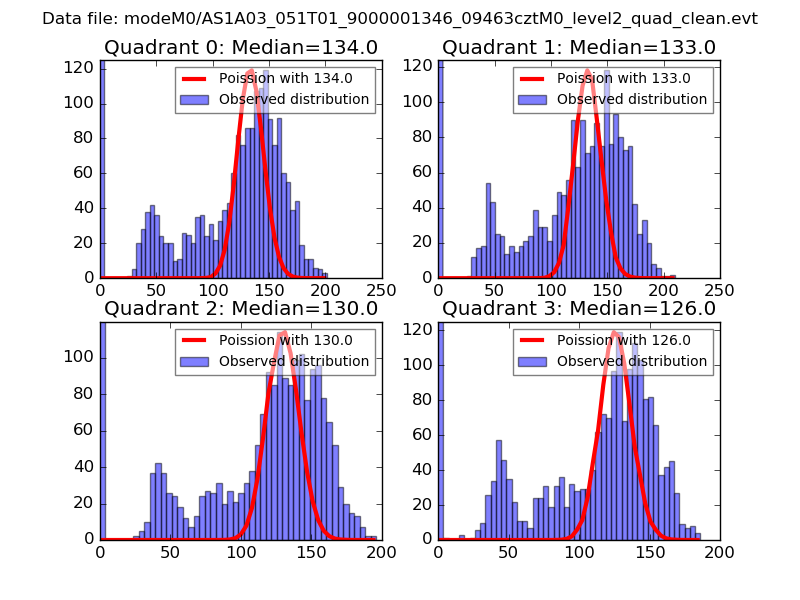 |
 |
| Quadrant-wise count rates Data is divided into 100 sec bins |
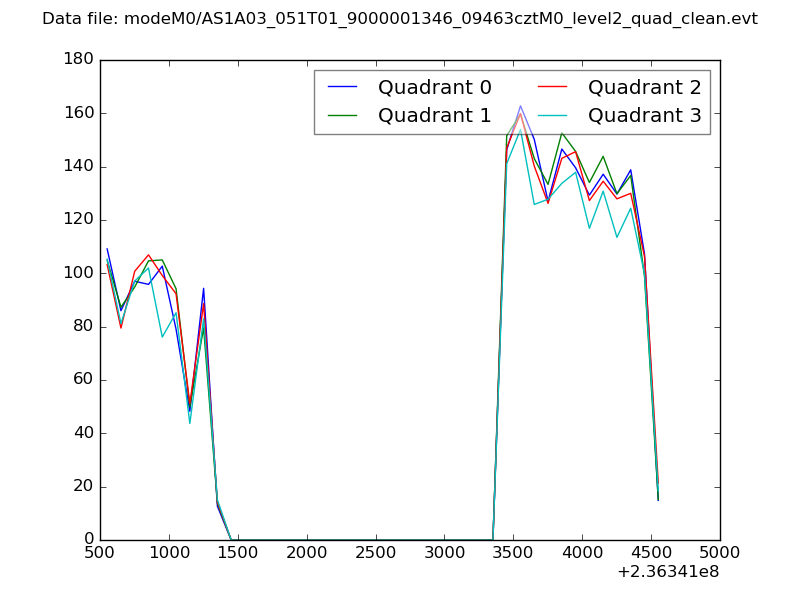 |
|
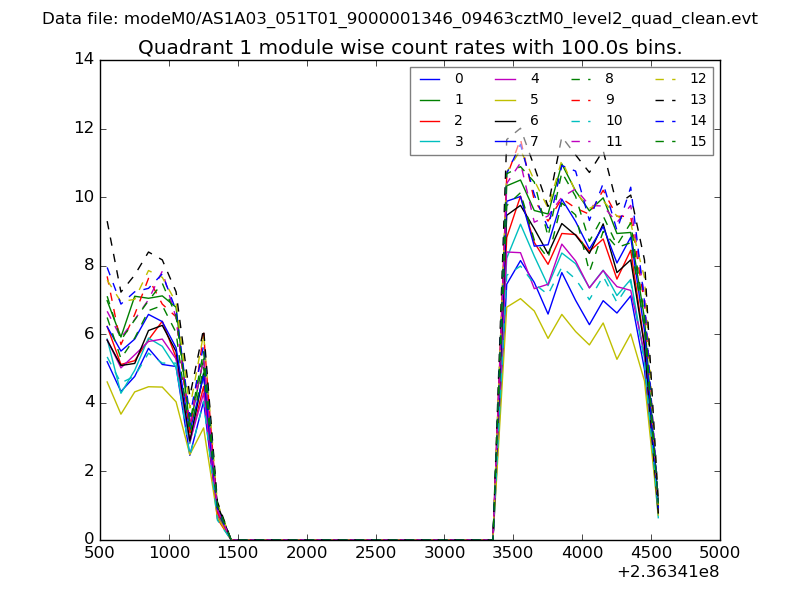
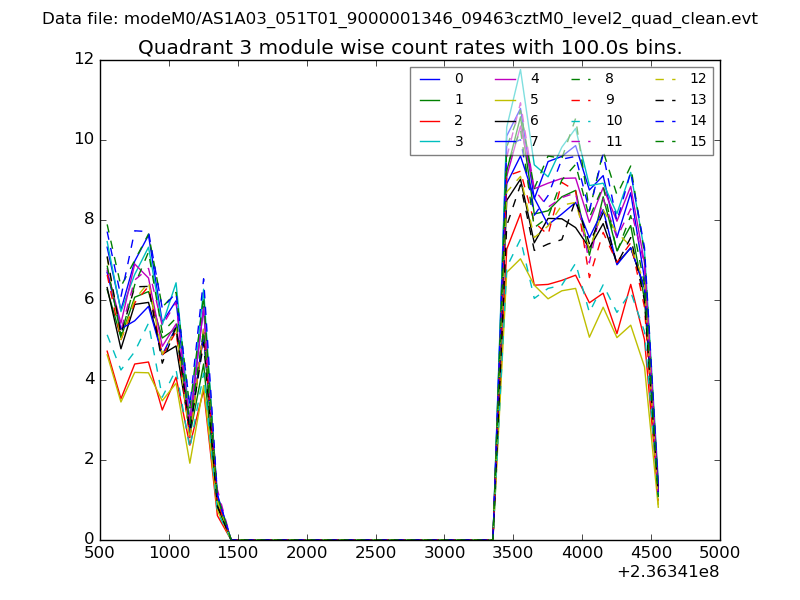
| Module-wise count rates for Quadrant A Data is divided into 100 sec bins |
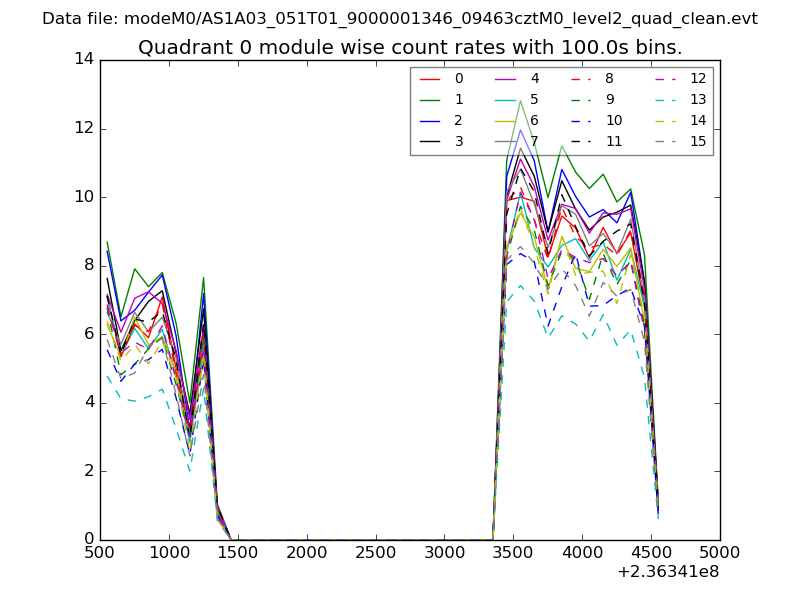 |
 |
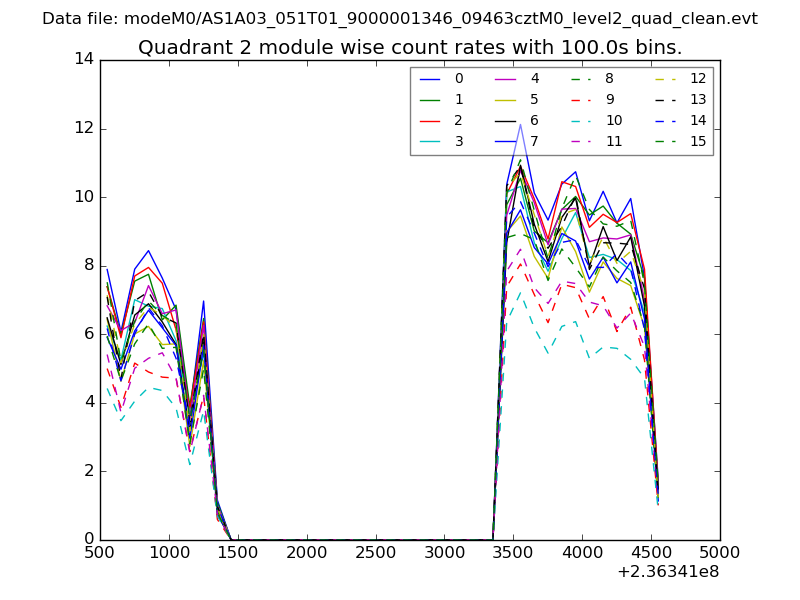
| Module-wise count rates for Quadrant B Data is divided into 100 sec bins |
 |
 |
| Module-wise count rates for Quadrant C Data is divided into 100 sec bins |
 |
 |
| Module-wise count rates for Quadrant D Data is divided into 100 sec bins |
 |
 |
| Parameter | Plot |
|---|---|
| CZT HV Monitor | 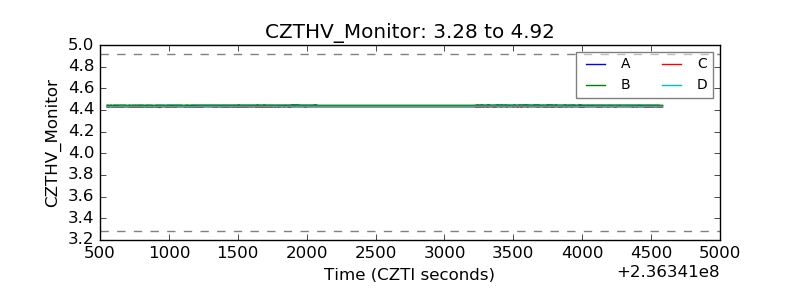 |
| D_VDD | 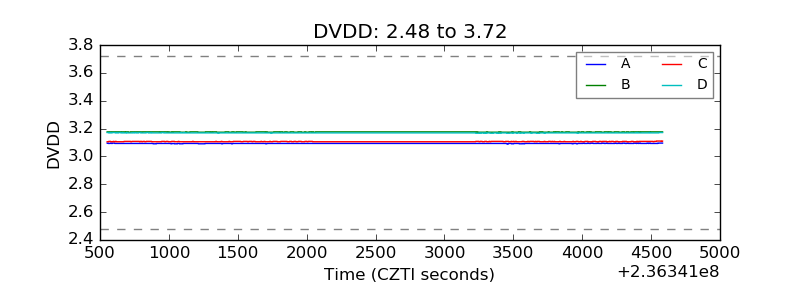 |
| Temperature 1 | 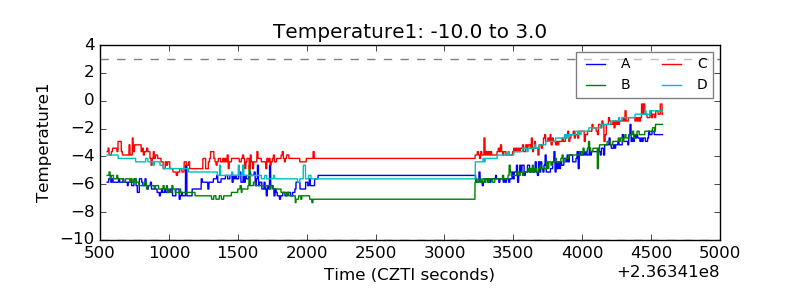 |
| Veto HV Monitor | 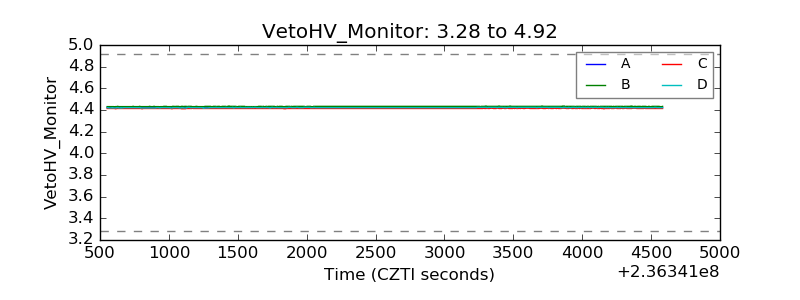 |
| Veto LLD | 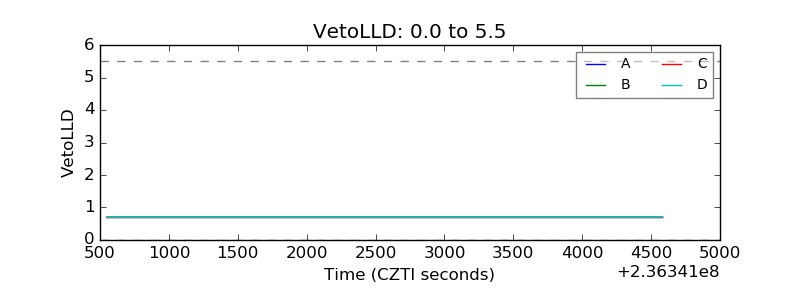 |
| Alpha Counter | 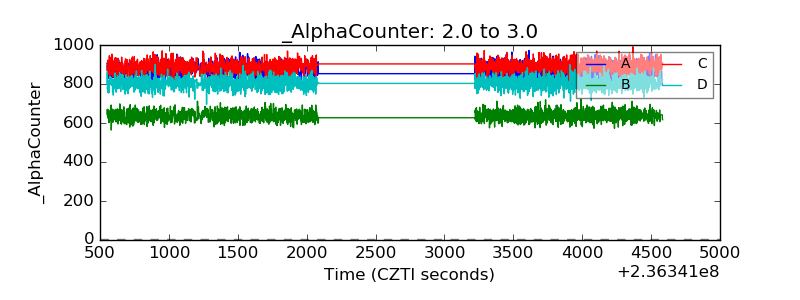 |
| _CPM_Rate | 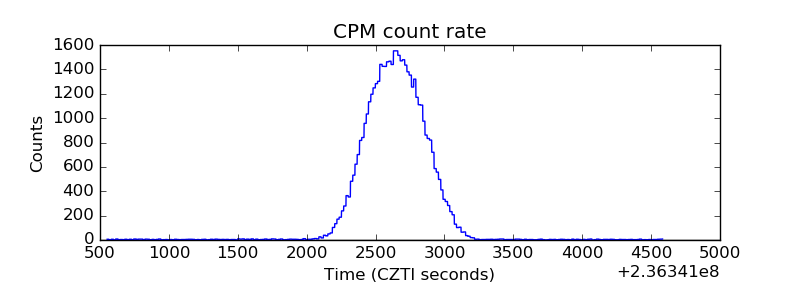 |
| CZT Counter | 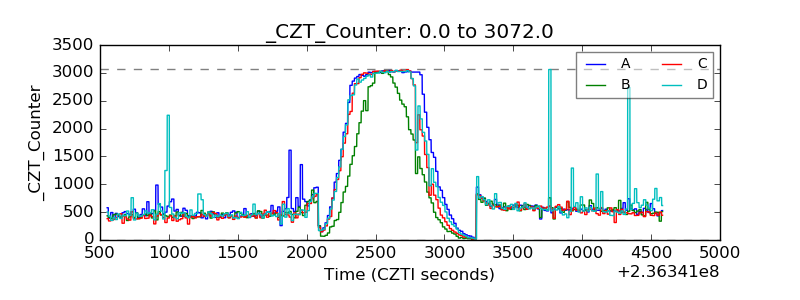 |
| +2.5 Volts monitor | 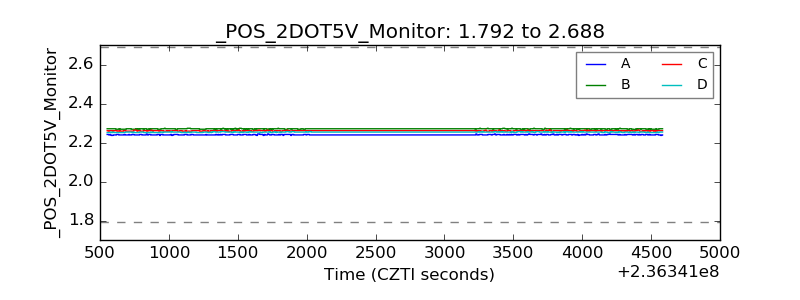 |
| +5 Volts monitor |  |
| _ROLL_ROT | 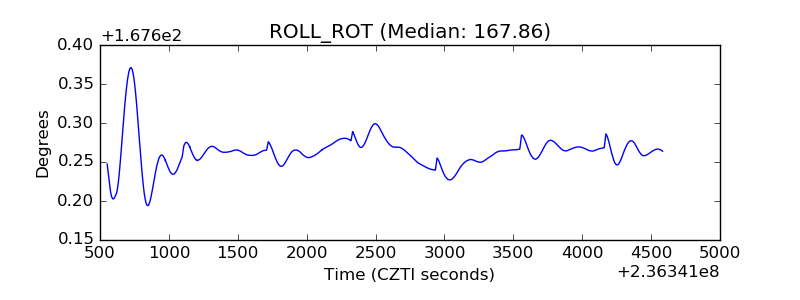 |
| _Roll_DEC | 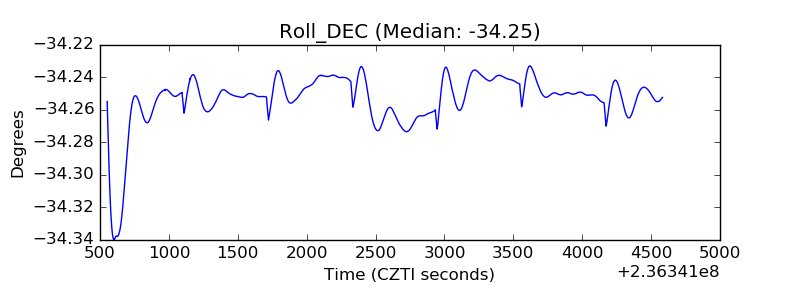 |
| _Roll_RA | 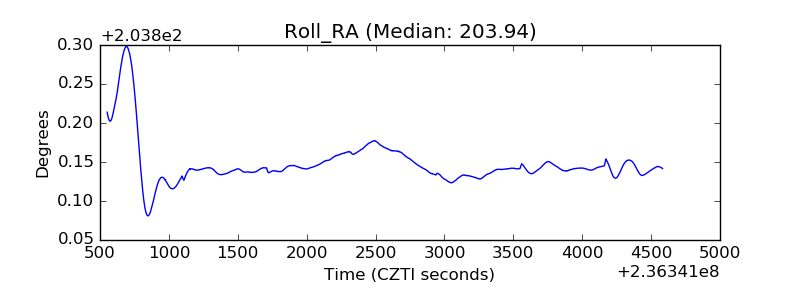 |
| Veto Counter | 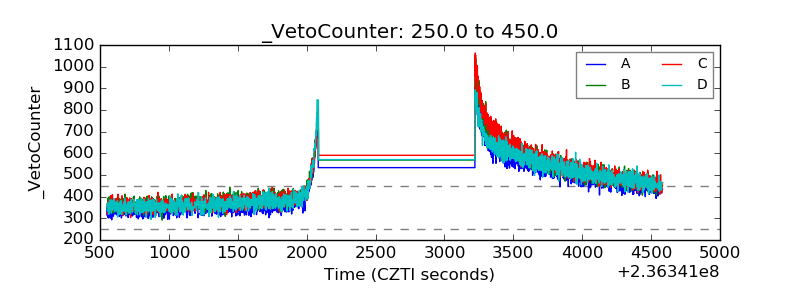 |