| Param | Original file | Final file |
|---|---|---|
| Filename | modeM0/AS1A03_051T01_9000001346_09464cztM0_level2.evt | modeM0/AS1A03_051T01_9000001346_09464cztM0_level2_quad_clean.evt |
| Size (bytes) | 627,390,720 | 131,523,840 |
| Size | 598.3 MB | 125.4 MB |
| Events in quadrant A | 4,861,286 | 877,798 |
| Events in quadrant B | 4,175,428 | 875,246 |
| Events in quadrant C | 3,902,851 | 849,806 |
| Events in quadrant D | 5,504,506 | 810,105 |
| Mode M0 | |||
|---|---|---|---|
| Quadrant | BADHDUFLAG | Total packets | Discarded packets |
| A | 0 | 19689 | 3 |
| B | 0 | 17754 | 2 |
| C | 0 | 17231 | 2 |
| D | 0 | 21716 | 2 |
| Mode M9 | |||
|---|---|---|---|
| Quadrant | BADHDUFLAG | Total packets | Discarded packets |
| A | 0 | 24 | 0 |
| B | 0 | 24 | 0 |
| C | 0 | 24 | 0 |
| D | 0 | 24 | 0 |
| Mode SS | |||
|---|---|---|---|
| Quadrant | BADHDUFLAG | Total packets | Discarded packets |
| A | 0 | 168 | 0 |
| B | 0 | 168 | 0 |
| C | 0 | 168 | 0 |
| D | 0 | 168 | 0 |
| Quadrant | Total seconds | Saturated seconds | Saturation percentage |
|---|---|---|---|
| A | 8211 | 233 | 2.837657% |
| B | 8211 | 122 | 1.485812% |
| C | 8211 | 85 | 1.035197% |
| D | 8211 | 472 | 5.748386% |
Noise dominated data is calculated using 1-second bins in cleaned event files. If a bin has >2000 counts, and if more than 50% of those come from <1% of pixels, then it is considered to be noise-dominated and hence unusable.
| Quadrant | # 1 sec bins | Bins with >0 counts | Bins with >2000 counts | High rate bins dominated by noise | Noise dominated (total time) | Noise dominated (detector-on time) | Marked lightcurve |
|---|---|---|---|---|---|---|---|
| A | 10576 | 8213 | 45 | 45 | 0.43% | 0.55% | 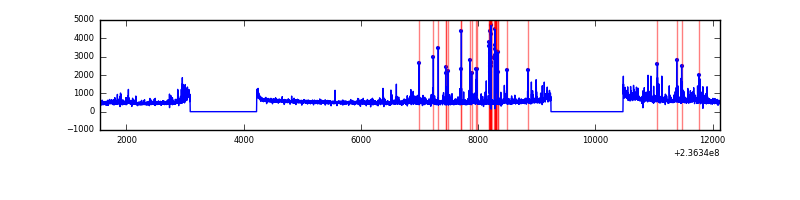 |
| B | 10576 | 8213 | 2 | 2 | 0.02% | 0.02% | 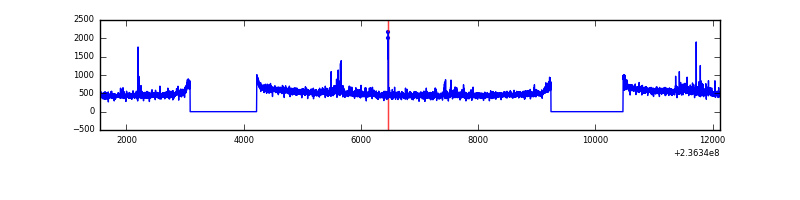 |
| C | 10576 | 8213 | 0 | 0 | 0.00% | 0.00% | 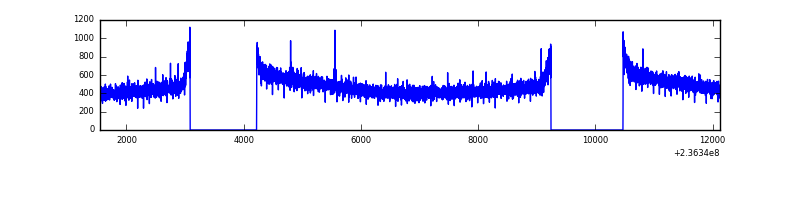 |
| D | 10576 | 8213 | 330 | 330 | 3.12% | 4.02% | 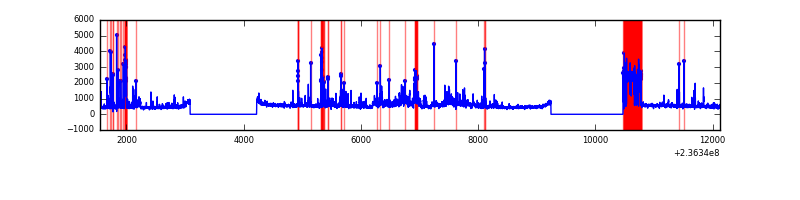 |
Top three noisy pixels from each quadrant. If the there are fewer than three noisy pixels in the level2.evt file, extra rows are filled as -1
| Pixel properties | Quadrant properties | ||||||
|---|---|---|---|---|---|---|---|
| Quadrant | DetID | PixID | Counts | Sigma | Mean | Median | Sigma |
| A | 8 | 5 | 554829 | 2638.21 | 1046 | 1027 | 209.9 |
| A | 1 | 162 | 118441 | 559.34 | 1046 | 1027 | 209.9 |
| A | 1 | 178 | 42212 | 196.2 | 1046 | 1027 | 209.9 |
| B | 0 | 214 | 75826 | 380.26 | 1037 | 1013 | 196.7 |
| B | 12 | 111 | 20645 | 99.79 | 1037 | 1013 | 196.7 |
| B | 11 | 111 | 16875 | 80.62 | 1037 | 1013 | 196.7 |
| C | 13 | 61 | 7619 | 28.69 | 999 | 1004 | 230.6 |
| C | 5 | 128 | 4359 | 14.55 | 999 | 1004 | 230.6 |
| C | 3 | 202 | 2552 | 6.71 | 999 | 1004 | 230.6 |
| D | 15 | 217 | 555855 | 2356.31 | 984 | 961 | 235.5 |
| D | 8 | 195 | 400741 | 1697.63 | 984 | 961 | 235.5 |
| D | 13 | 104 | 274604 | 1162.0 | 984 | 961 | 235.5 |
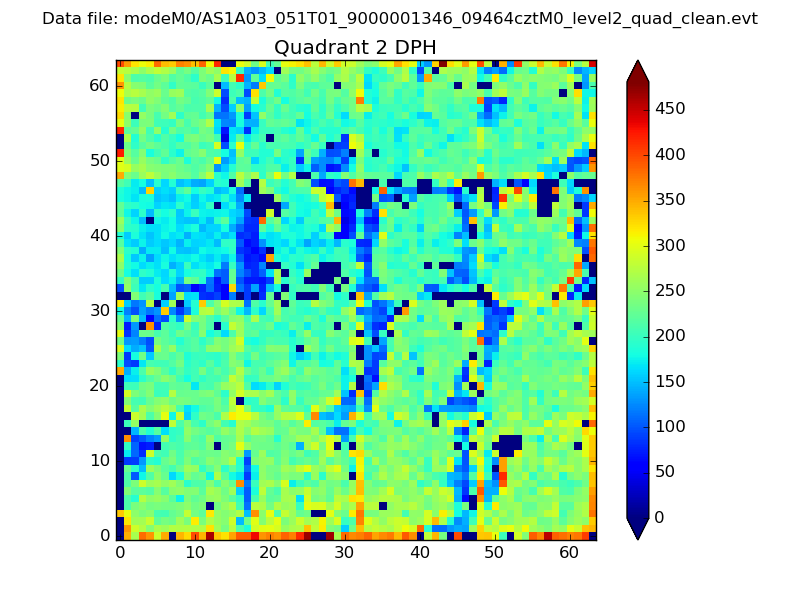
Histogram calculated using DETX and DETY for each event in the final _common_clean file
| Quadrant A | 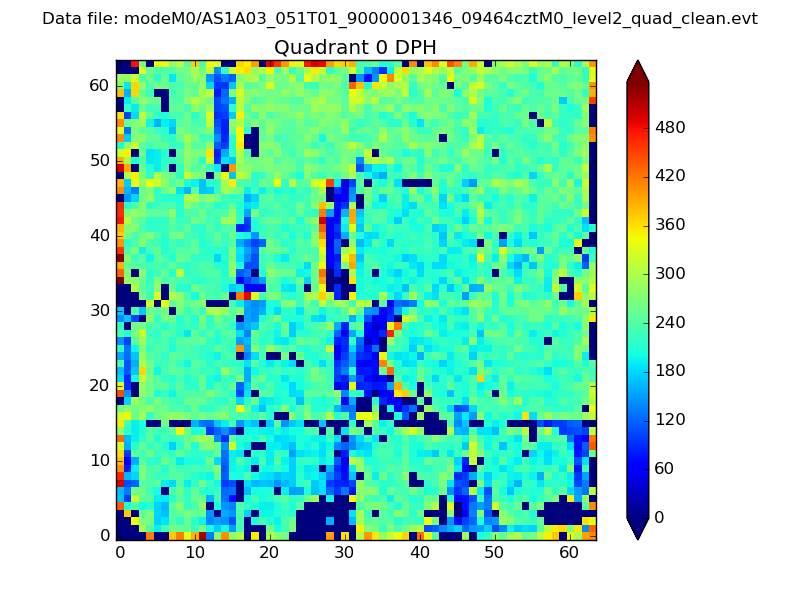 |
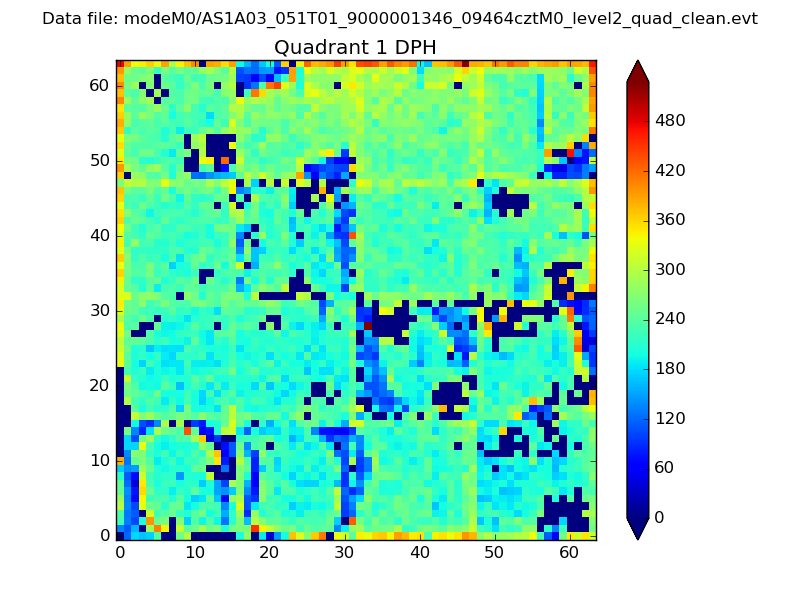 |
Quadrant B |
|---|---|---|---|
| Quadrant D | 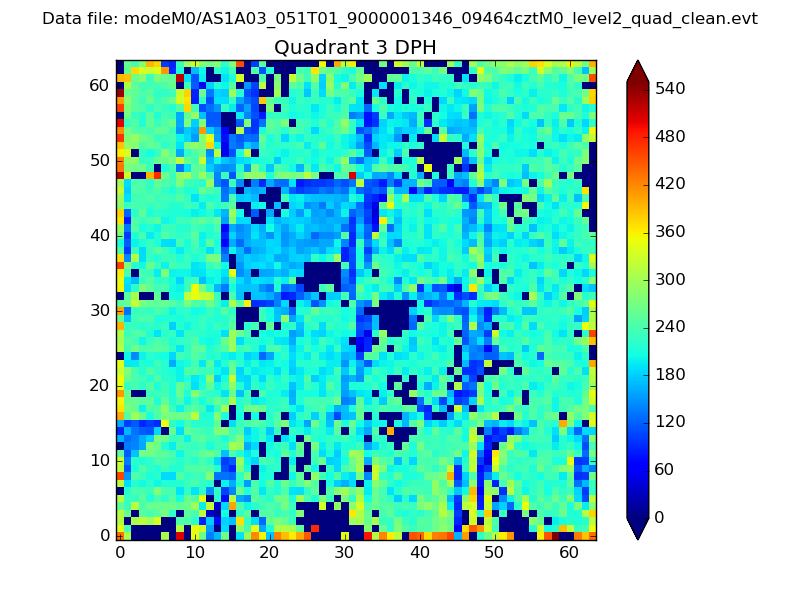 |
 |
Quadrant C |
| Plot type | Count rate plots | Images |
|---|---|---|
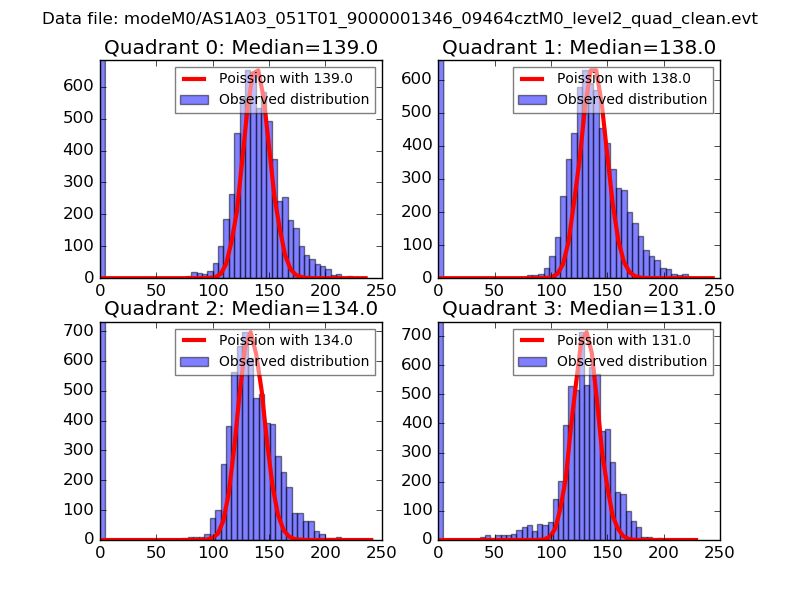
| Comparison with Poisson distribution Blue bars denote a histogram of data divided into 1 sec bins. Red curve is a Poisson curve with rate = median count rate of data. |
 |
 |
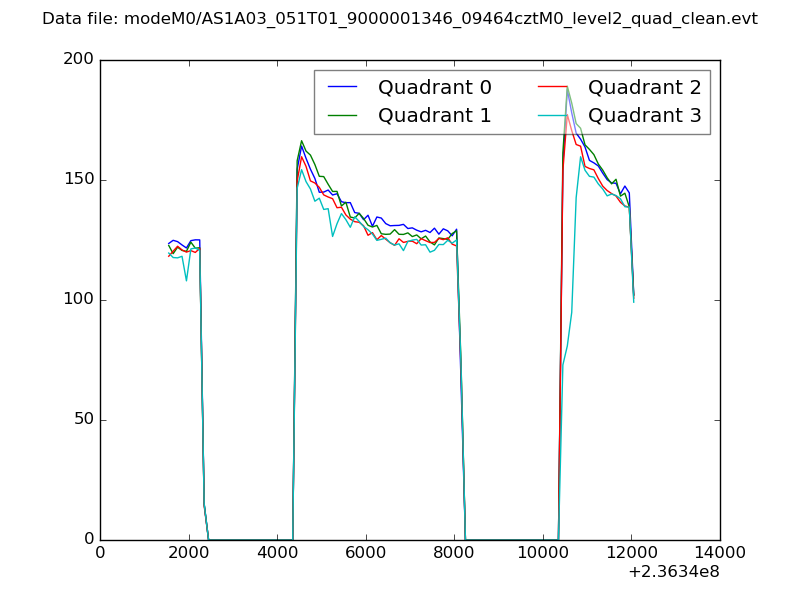
| Quadrant-wise count rates Data is divided into 100 sec bins |
 |
|
| Module-wise count rates for Quadrant A Data is divided into 100 sec bins |
 |
 |
| Module-wise count rates for Quadrant B Data is divided into 100 sec bins |
 |
 |
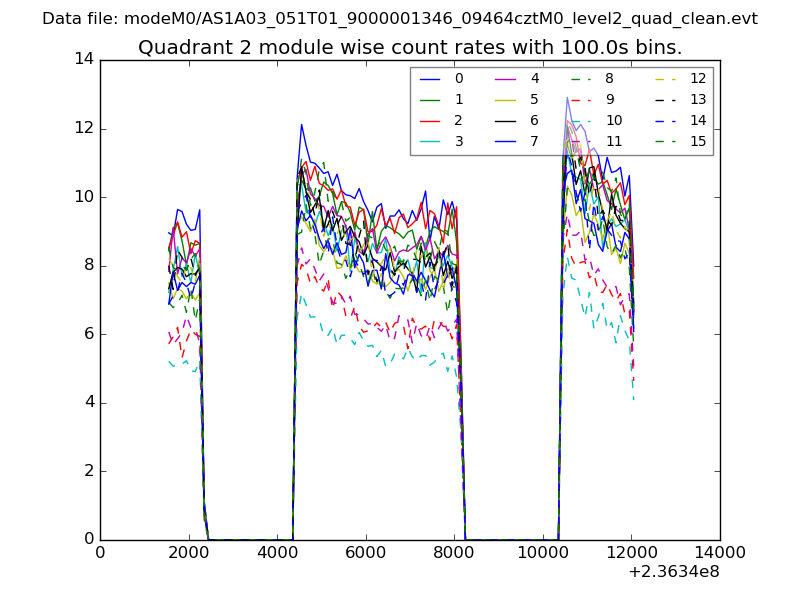
| Module-wise count rates for Quadrant C Data is divided into 100 sec bins |
 |
 |
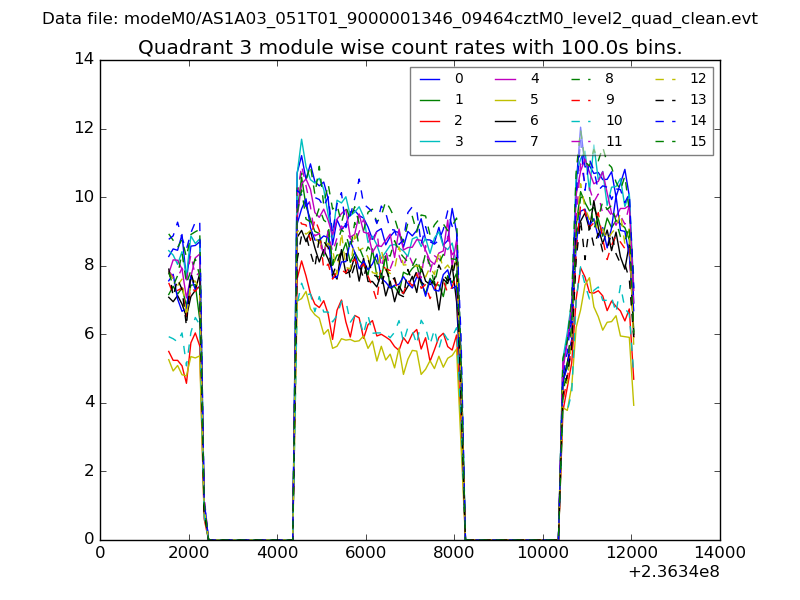
| Module-wise count rates for Quadrant D Data is divided into 100 sec bins |
 |
 |
| Parameter | Plot |
|---|---|
| CZT HV Monitor | 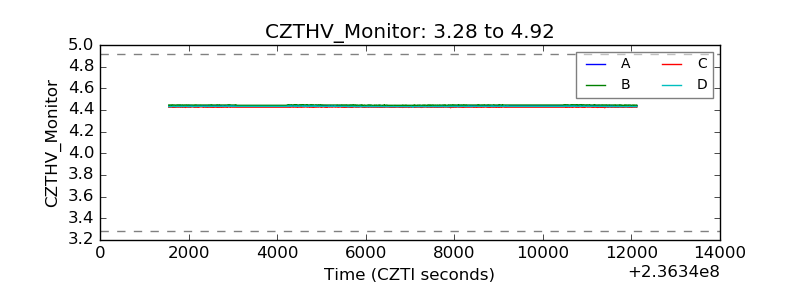 |
| D_VDD | 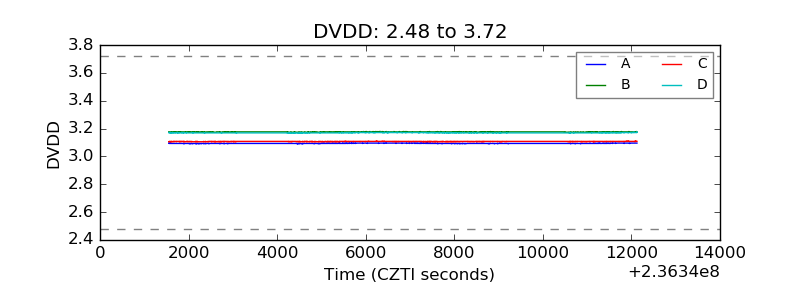 |
| Temperature 1 | 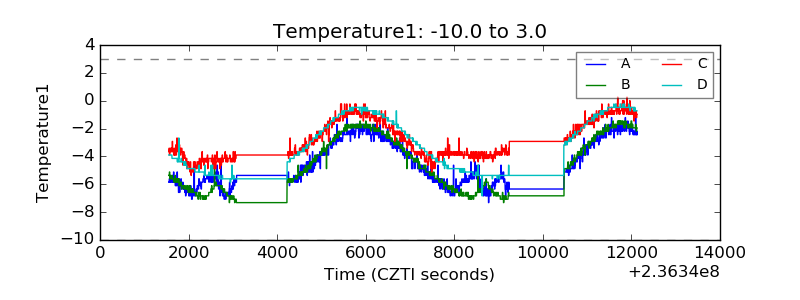 |
| Veto HV Monitor | 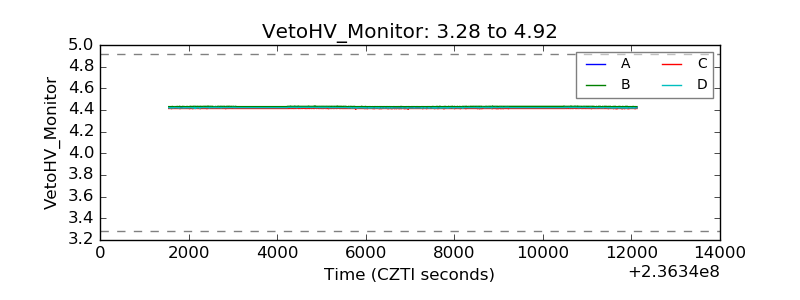 |
| Veto LLD | 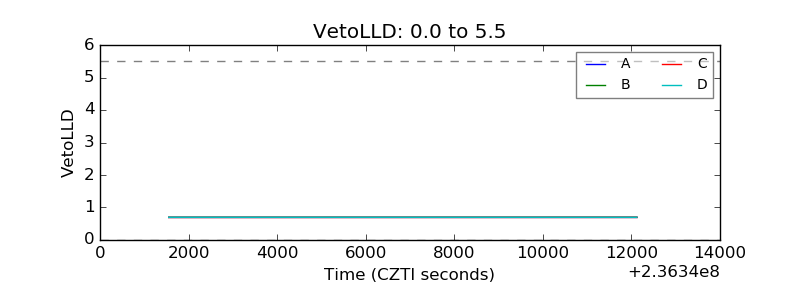 |
| Alpha Counter | 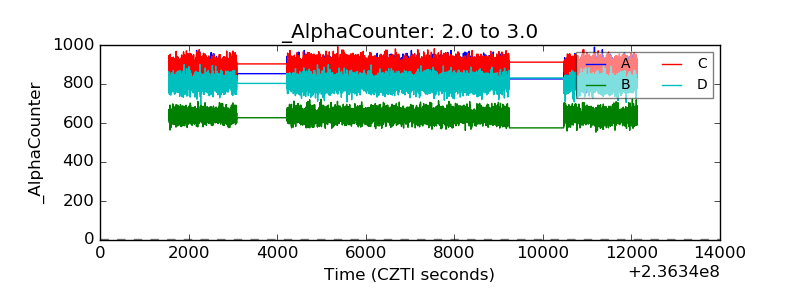 |
| _CPM_Rate | 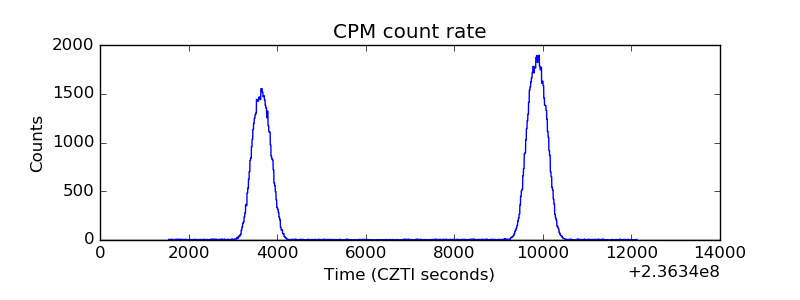 |
| CZT Counter | 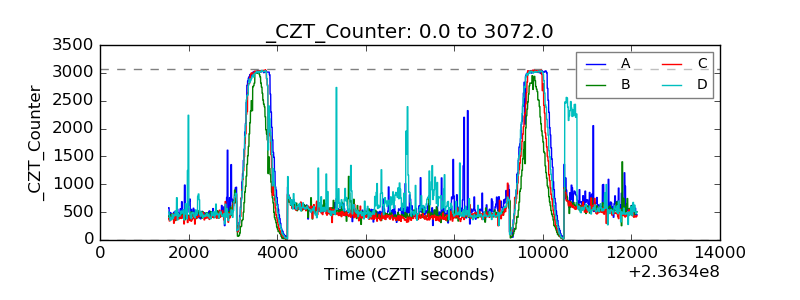 |
| +2.5 Volts monitor | 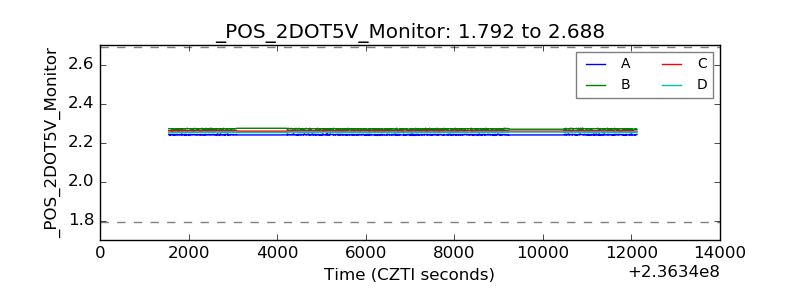 |
| +5 Volts monitor |  |
| _ROLL_ROT | 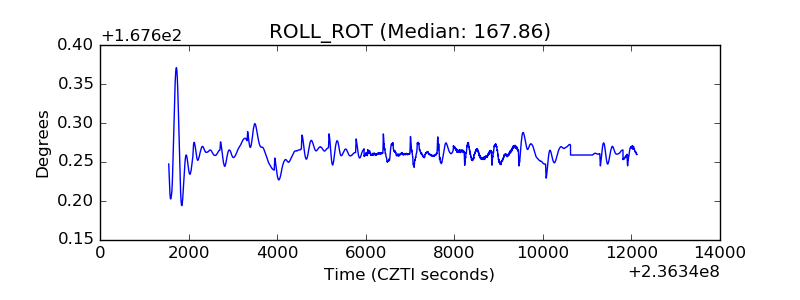 |
| _Roll_DEC | 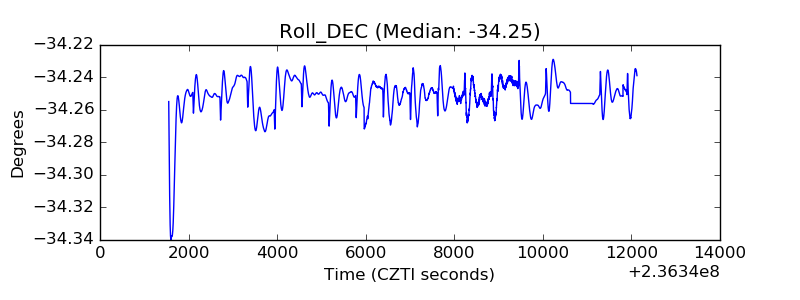 |
| _Roll_RA | 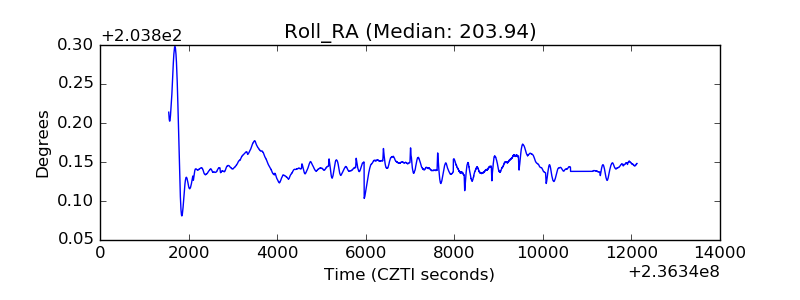 |
| Veto Counter |  |