| Param | Original file | Final file |
|---|---|---|
| Filename | modeM0/AS1A03_051T01_9000001346_09465cztM0_level2.evt | modeM0/AS1A03_051T01_9000001346_09465cztM0_level2_quad_clean.evt |
| Size (bytes) | 431,498,880 | 97,819,200 |
| Size | 411.5 MB | 93.3 MB |
| Events in quadrant A | 3,633,699 | 655,371 |
| Events in quadrant B | 3,031,794 | 647,047 |
| Events in quadrant C | 2,798,981 | 627,378 |
| Events in quadrant D | 3,204,576 | 622,658 |
| Mode M0 | |||
|---|---|---|---|
| Quadrant | BADHDUFLAG | Total packets | Discarded packets |
| A | 0 | 14777 | 2 |
| B | 0 | 12840 | 1 |
| C | 0 | 12247 | 1 |
| D | 0 | 13440 | 1 |
| Mode M9 | |||
|---|---|---|---|
| Quadrant | BADHDUFLAG | Total packets | Discarded packets |
| A | 0 | 13 | 0 |
| B | 0 | 13 | 0 |
| C | 0 | 13 | 0 |
| D | 0 | 13 | 0 |
| Mode SS | |||
|---|---|---|---|
| Quadrant | BADHDUFLAG | Total packets | Discarded packets |
| A | 0 | 118 | 0 |
| B | 0 | 118 | 0 |
| C | 0 | 118 | 0 |
| D | 0 | 118 | 0 |
| Quadrant | Total seconds | Saturated seconds | Saturation percentage |
|---|---|---|---|
| A | 5872 | 129 | 2.196866% |
| B | 5872 | 83 | 1.413488% |
| C | 5872 | 57 | 0.970708% |
| D | 5872 | 131 | 2.230926% |
Noise dominated data is calculated using 1-second bins in cleaned event files. If a bin has >2000 counts, and if more than 50% of those come from <1% of pixels, then it is considered to be noise-dominated and hence unusable.
| Quadrant | # 1 sec bins | Bins with >0 counts | Bins with >2000 counts | High rate bins dominated by noise | Noise dominated (total time) | Noise dominated (detector-on time) | Marked lightcurve |
|---|---|---|---|---|---|---|---|
| A | 7152 | 5872 | 15 | 15 | 0.21% | 0.26% | 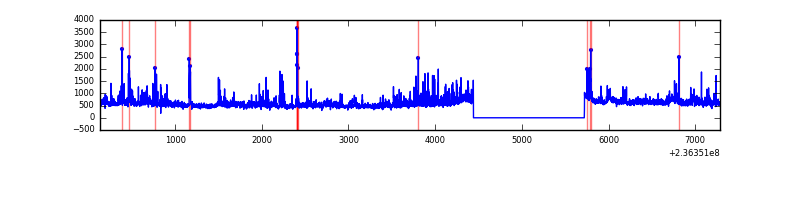 |
| B | 7152 | 5873 | 1 | 1 | 0.01% | 0.02% | 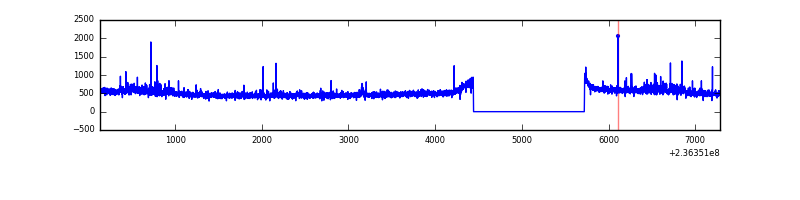 |
| C | 7152 | 5873 | 6 | 6 | 0.08% | 0.10% | 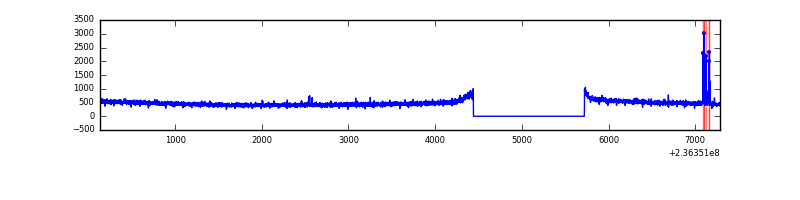 |
| D | 7152 | 5873 | 54 | 54 | 0.76% | 0.92% | 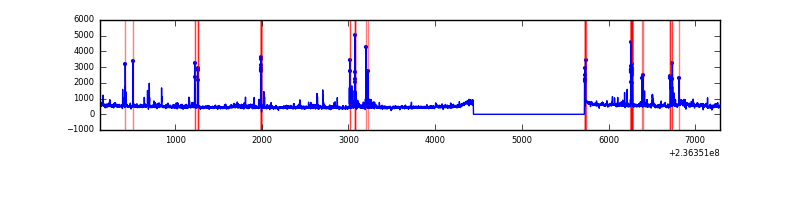 |
Top three noisy pixels from each quadrant. If the there are fewer than three noisy pixels in the level2.evt file, extra rows are filled as -1
| Pixel properties | Quadrant properties | ||||||
|---|---|---|---|---|---|---|---|
| Quadrant | DetID | PixID | Counts | Sigma | Mean | Median | Sigma |
| A | 8 | 5 | 547296 | 3610.16 | 753 | 740 | 151.4 |
| A | 1 | 162 | 87896 | 575.69 | 753 | 740 | 151.4 |
| A | 1 | 178 | 30538 | 196.82 | 753 | 740 | 151.4 |
| B | 0 | 214 | 76596 | 542.32 | 741 | 727 | 139.9 |
| B | 0 | 219 | 27639 | 192.37 | 741 | 727 | 139.9 |
| B | 0 | 229 | 18606 | 127.8 | 741 | 727 | 139.9 |
| C | 14 | 234 | 34059 | 205.14 | 707 | 711 | 162.6 |
| C | 12 | 4 | 5488 | 29.39 | 707 | 711 | 162.6 |
| C | 13 | 61 | 5267 | 28.03 | 707 | 711 | 162.6 |
| D | 8 | 195 | 149110 | 814.52 | 717 | 700 | 182.2 |
| D | 12 | 233 | 110896 | 604.79 | 717 | 700 | 182.2 |
| D | 7 | 71 | 72864 | 396.06 | 717 | 700 | 182.2 |
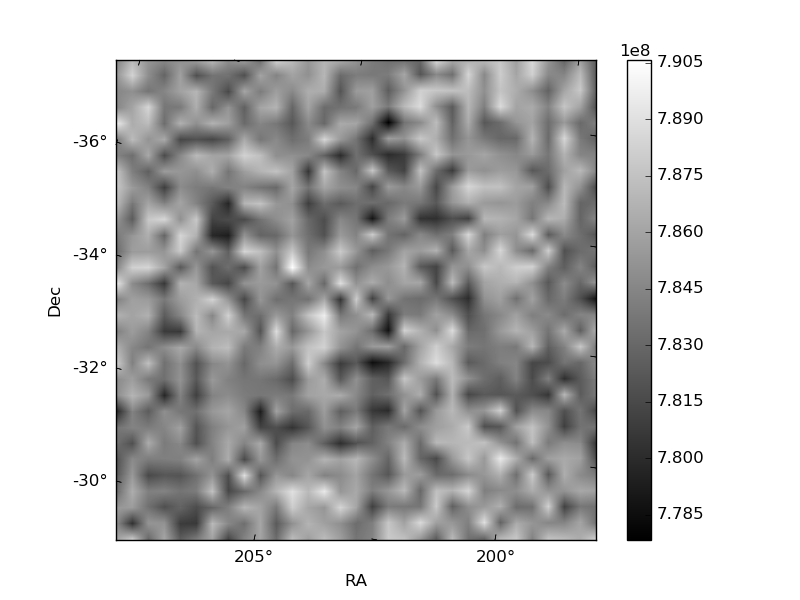
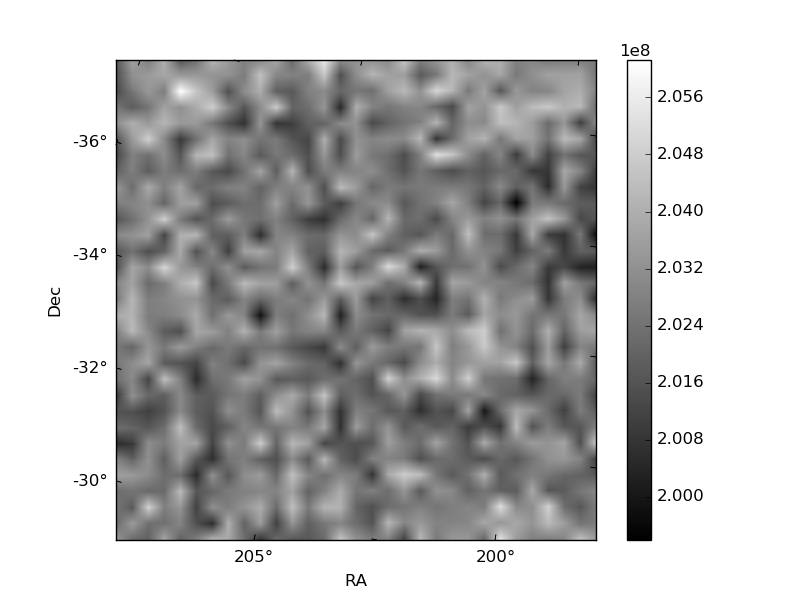
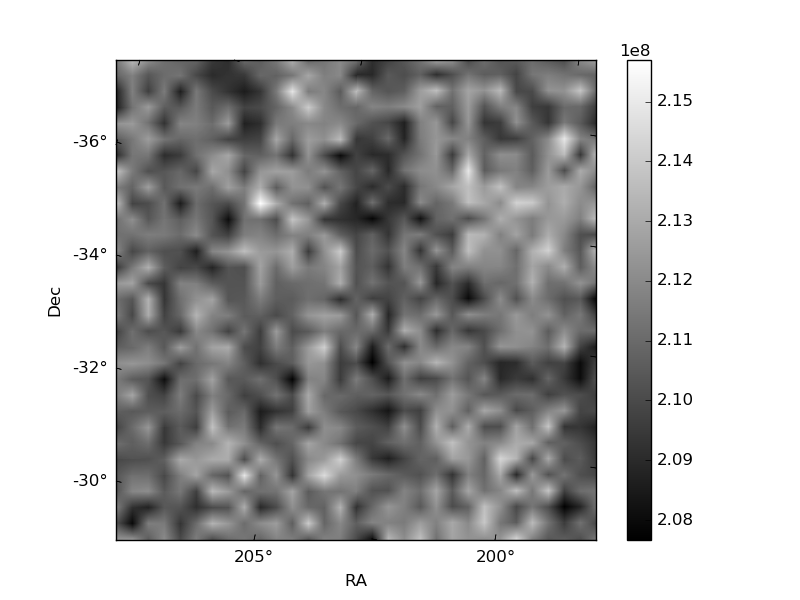
Histogram calculated using DETX and DETY for each event in the final _common_clean file
| Quadrant A | 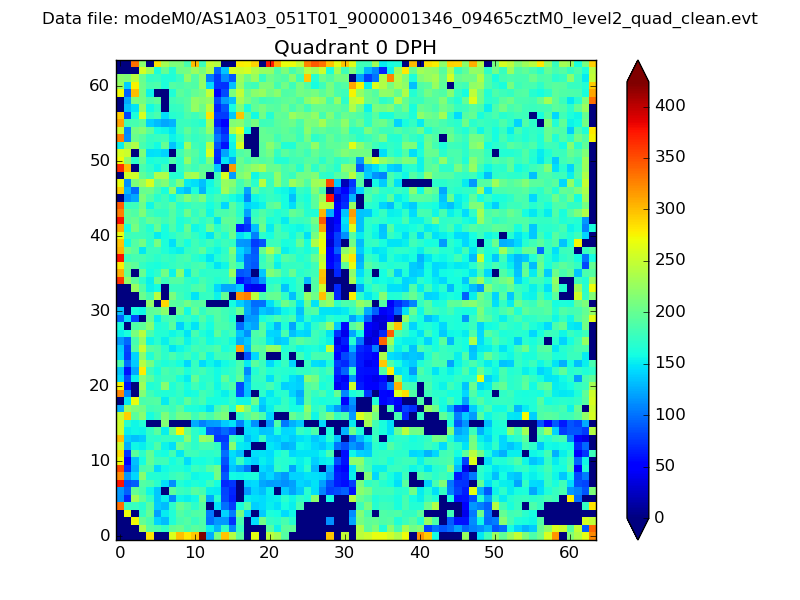 |
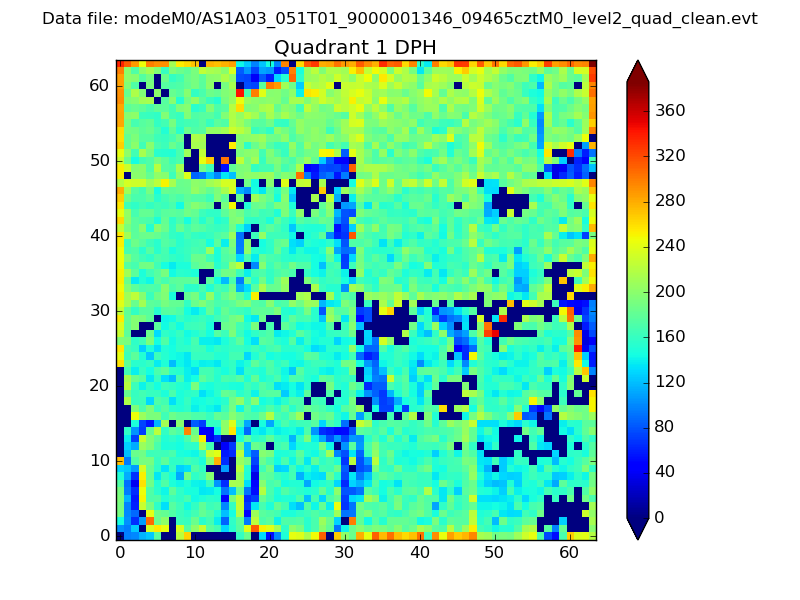 |
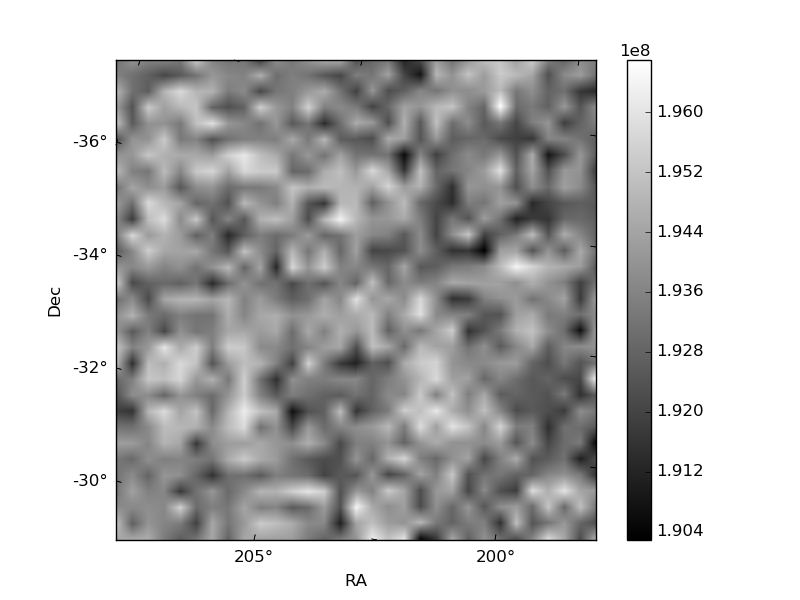
Quadrant B |
|---|---|---|---|
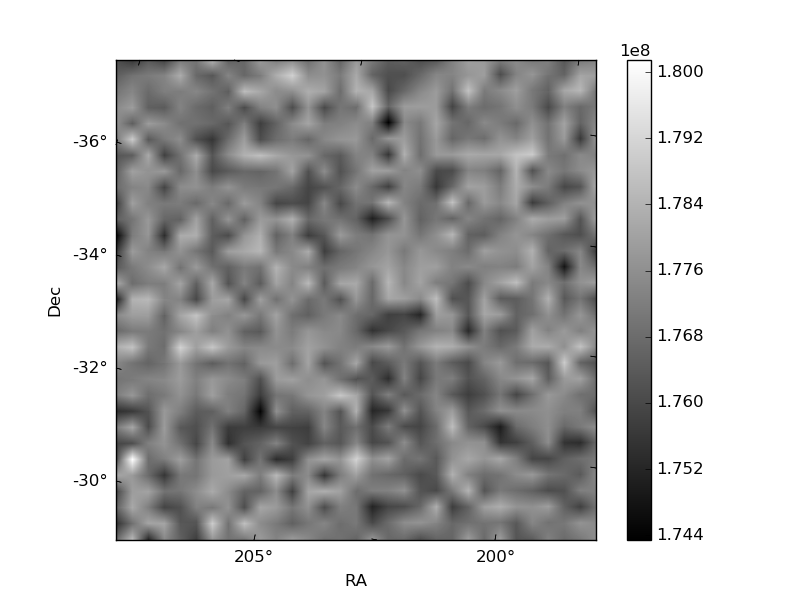
| Quadrant D | 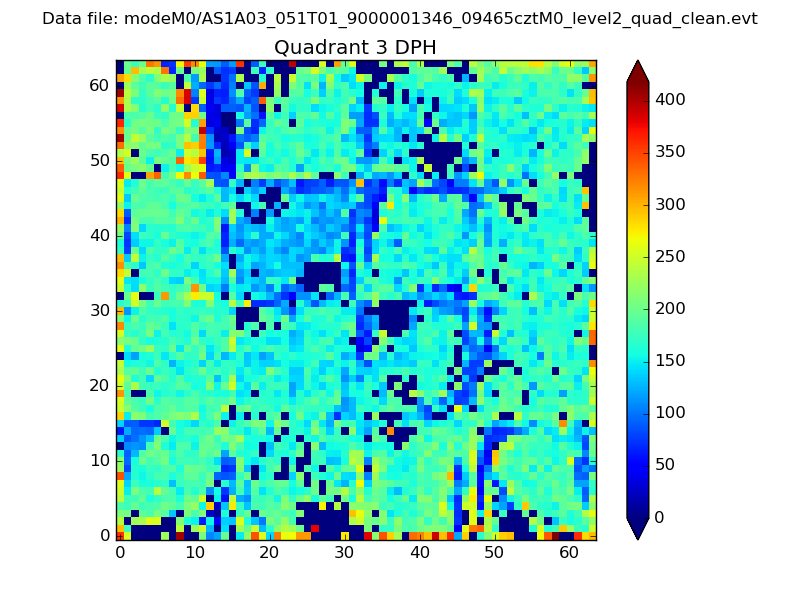 |
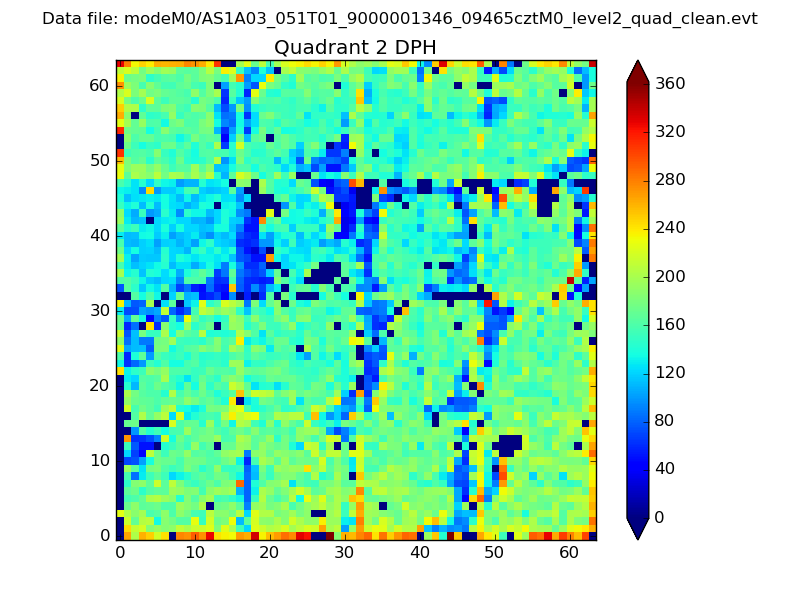 |
Quadrant C |
| Plot type | Count rate plots | Images |
|---|---|---|
| Comparison with Poisson distribution Blue bars denote a histogram of data divided into 1 sec bins. Red curve is a Poisson curve with rate = median count rate of data. |
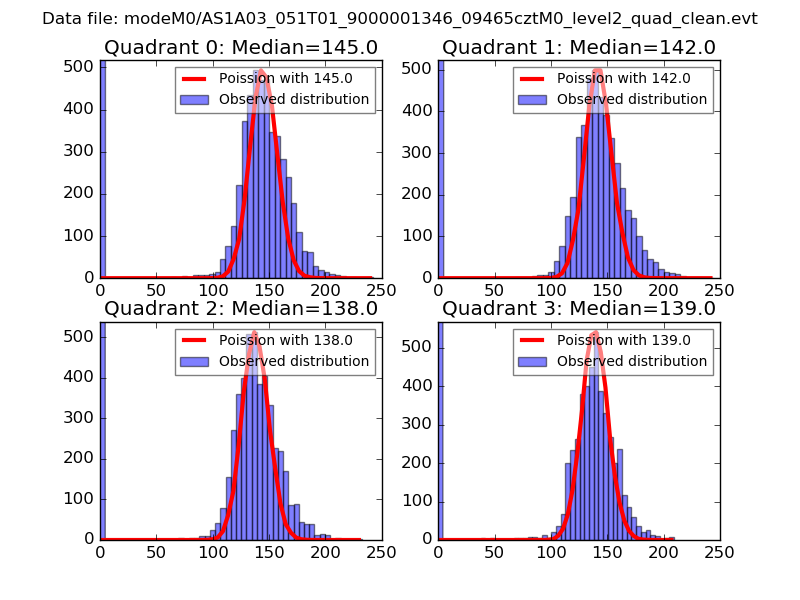 |
 |
| Quadrant-wise count rates Data is divided into 100 sec bins |
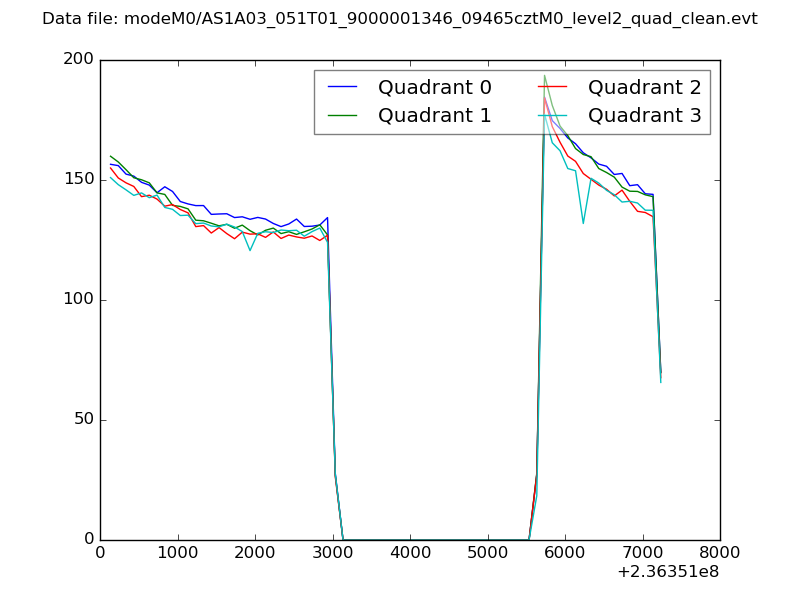 |
|
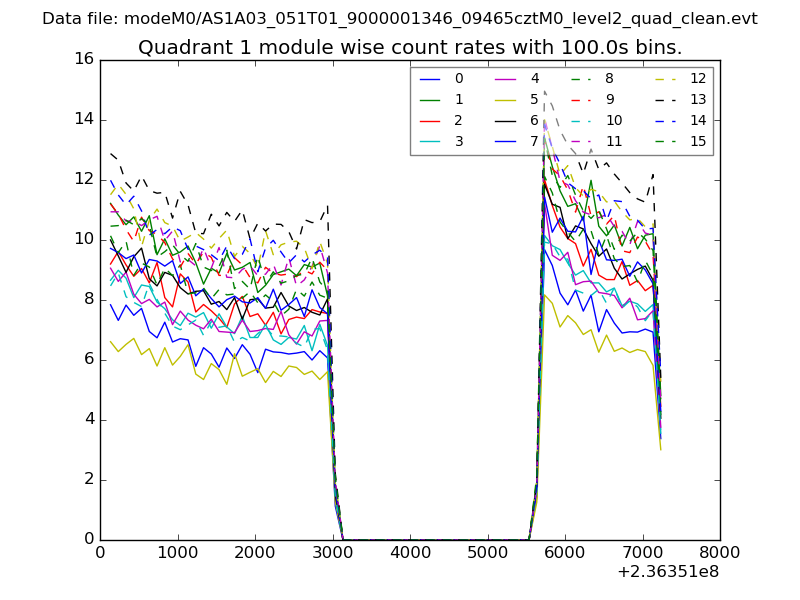
| Module-wise count rates for Quadrant A Data is divided into 100 sec bins |
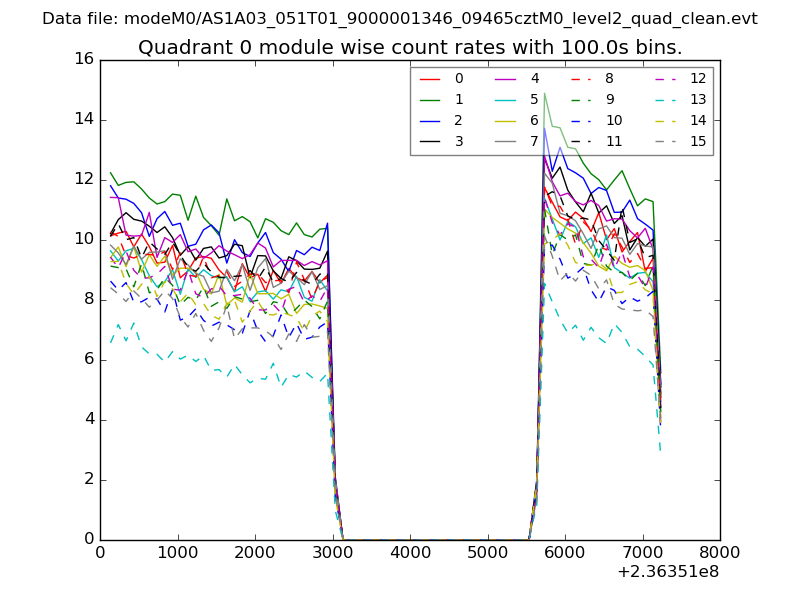 |
 |
| Module-wise count rates for Quadrant B Data is divided into 100 sec bins |
 |
 |
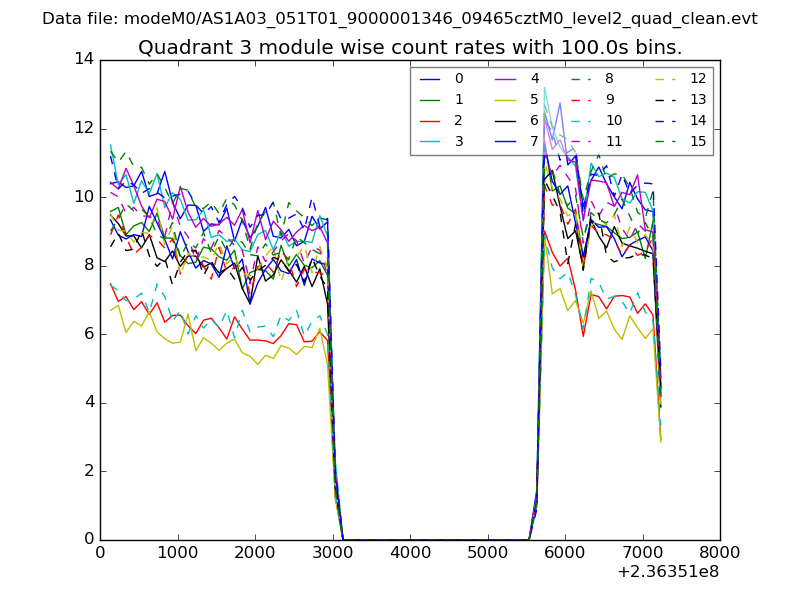
| Module-wise count rates for Quadrant C Data is divided into 100 sec bins |
 |
 |
| Module-wise count rates for Quadrant D Data is divided into 100 sec bins |
 |
 |
| Parameter | Plot |
|---|---|
| CZT HV Monitor | 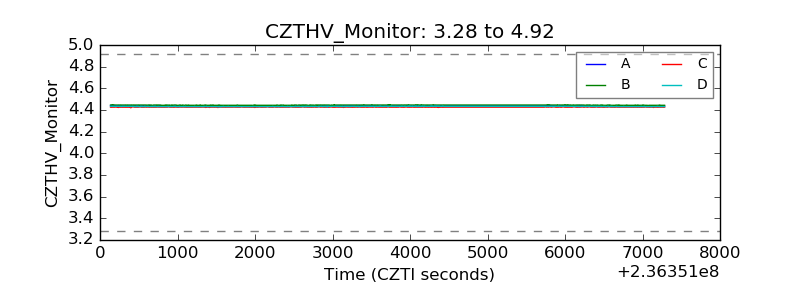 |
| D_VDD | 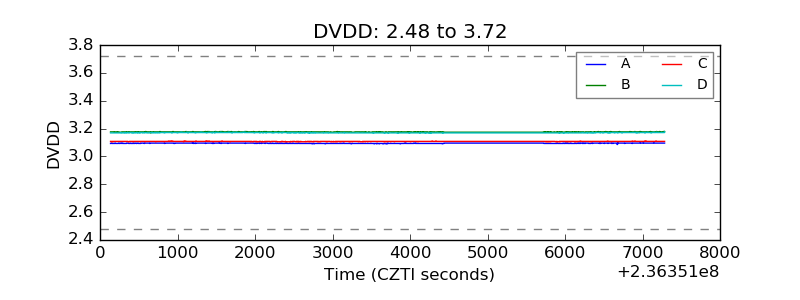 |
| Temperature 1 |  |
| Veto HV Monitor | 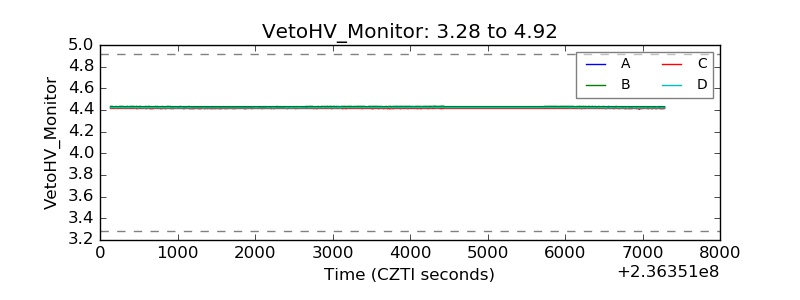 |
| Veto LLD | 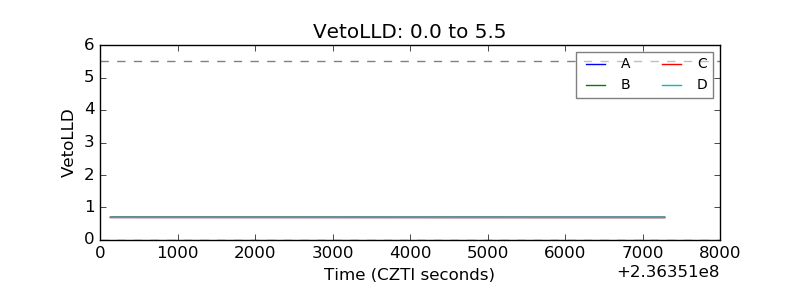 |
| Alpha Counter | 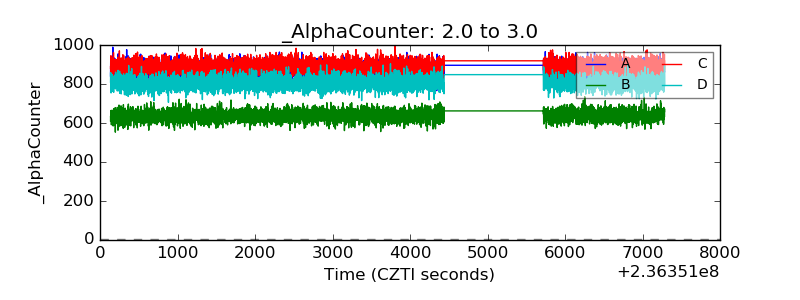 |
| _CPM_Rate | 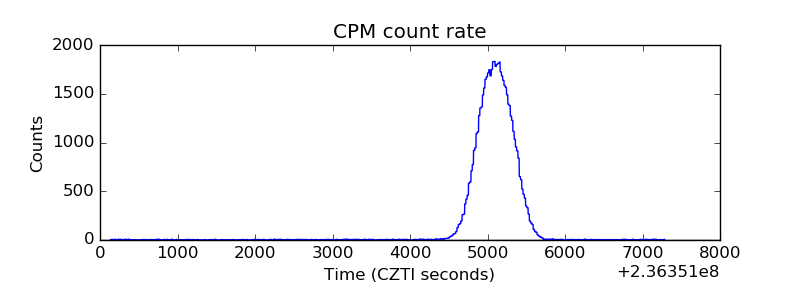 |
| CZT Counter | 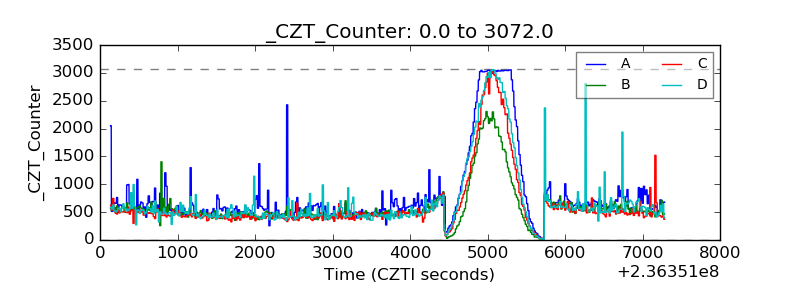 |
| +2.5 Volts monitor |  |
| +5 Volts monitor | 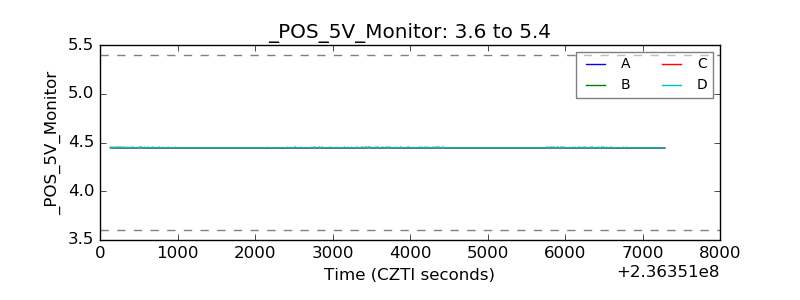 |
| _ROLL_ROT | 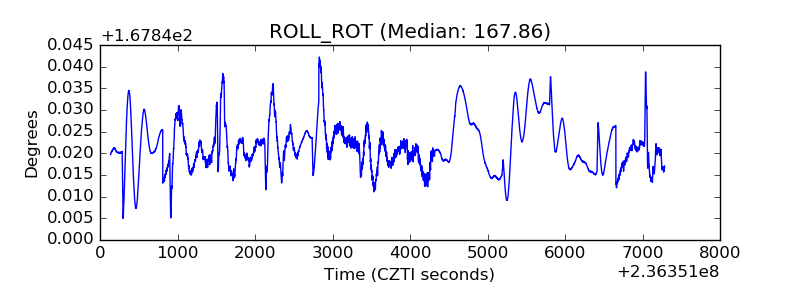 |
| _Roll_DEC | 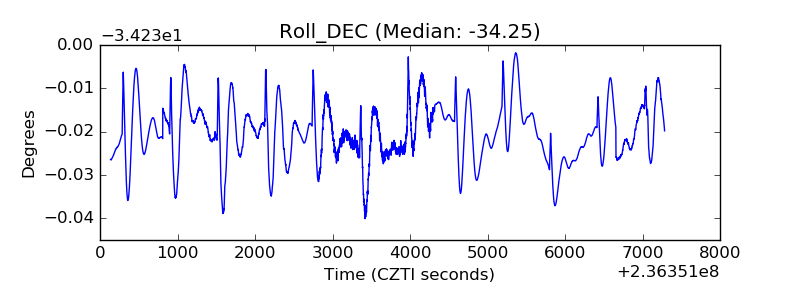 |
| _Roll_RA | 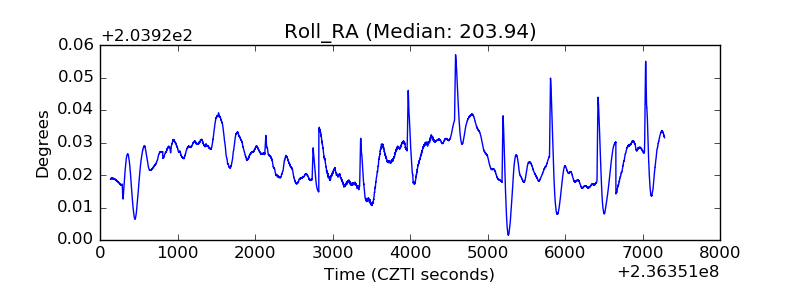 |
| Veto Counter | 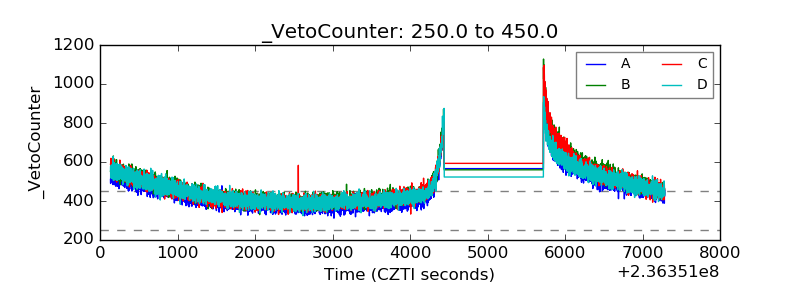 |